| Tissue | Expression Dynamics | Abbreviation |
| Esophagus | 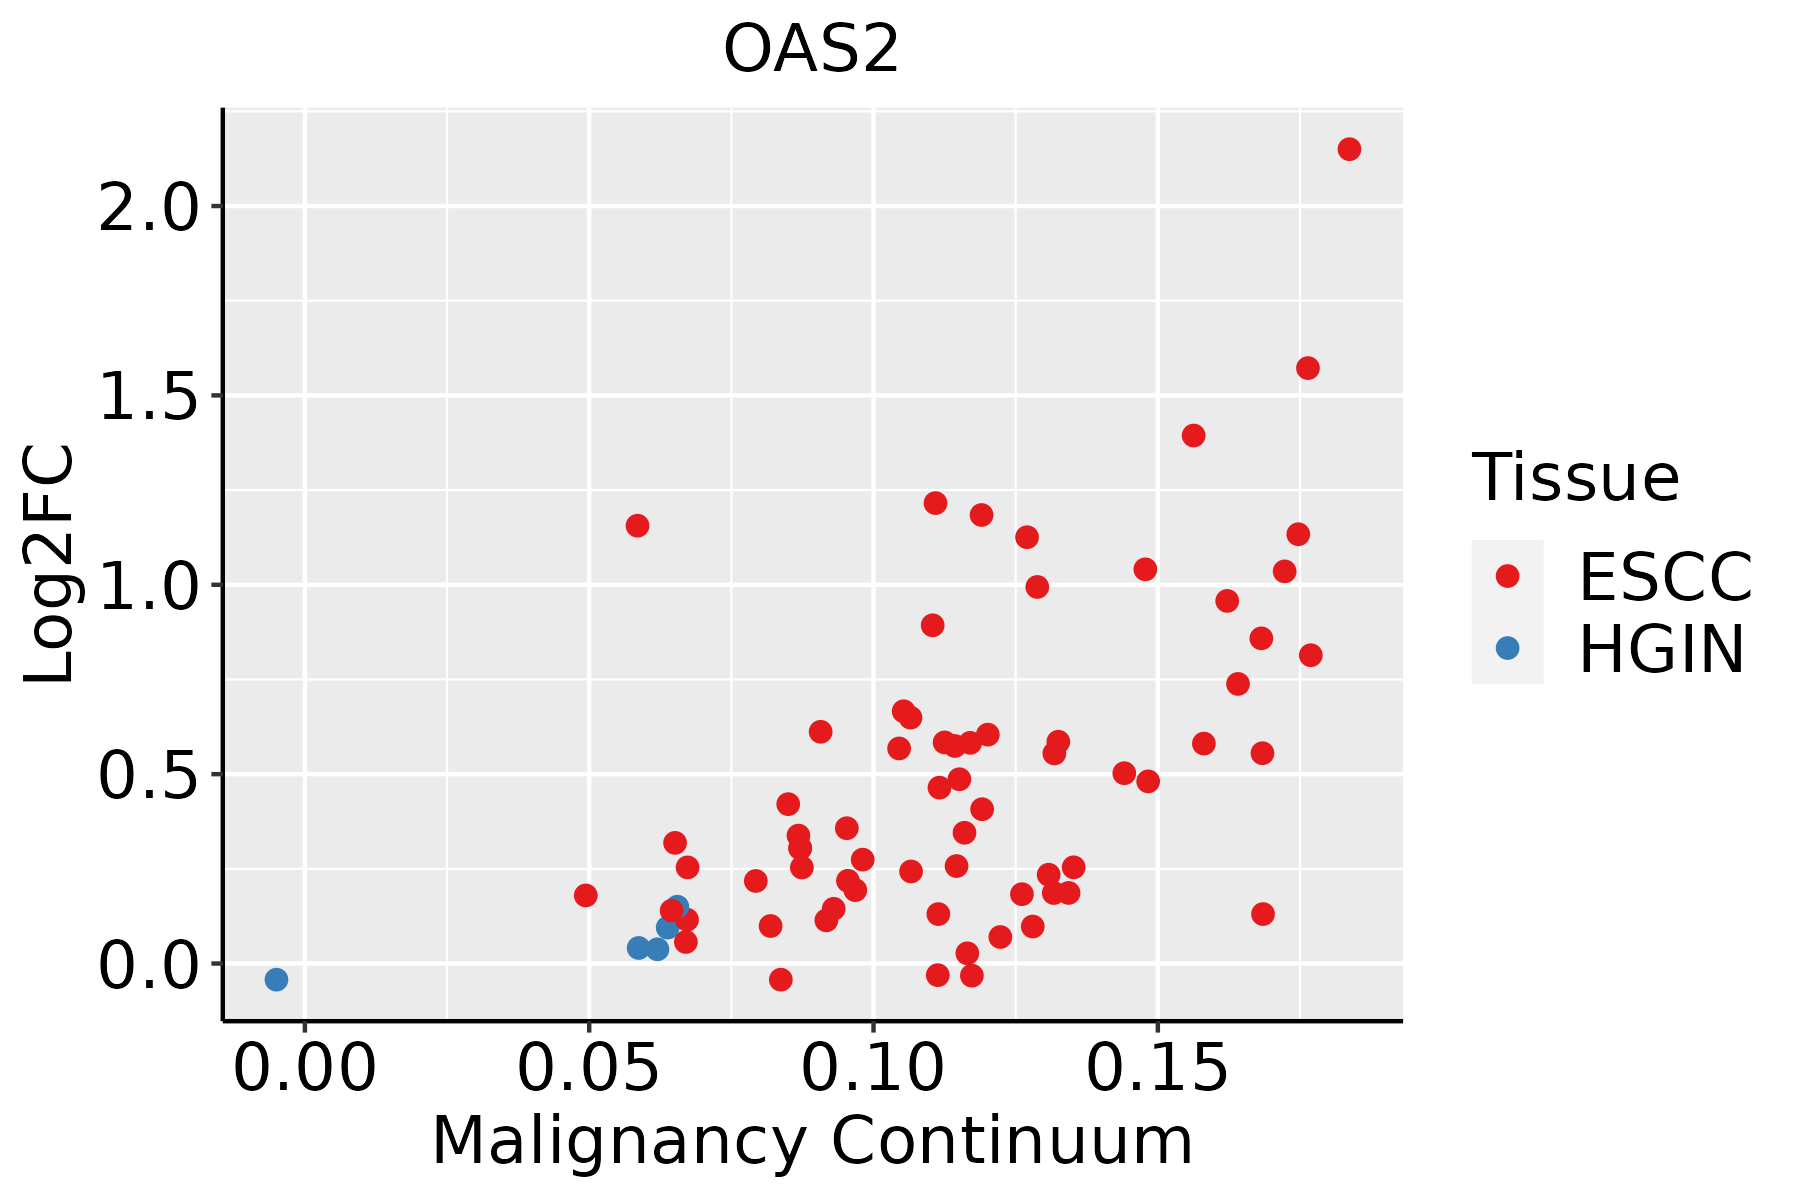 | ESCC: Esophageal squamous cell carcinoma |
| HGIN: High-grade intraepithelial neoplasias |
| LGIN: Low-grade intraepithelial neoplasias |
| Liver | 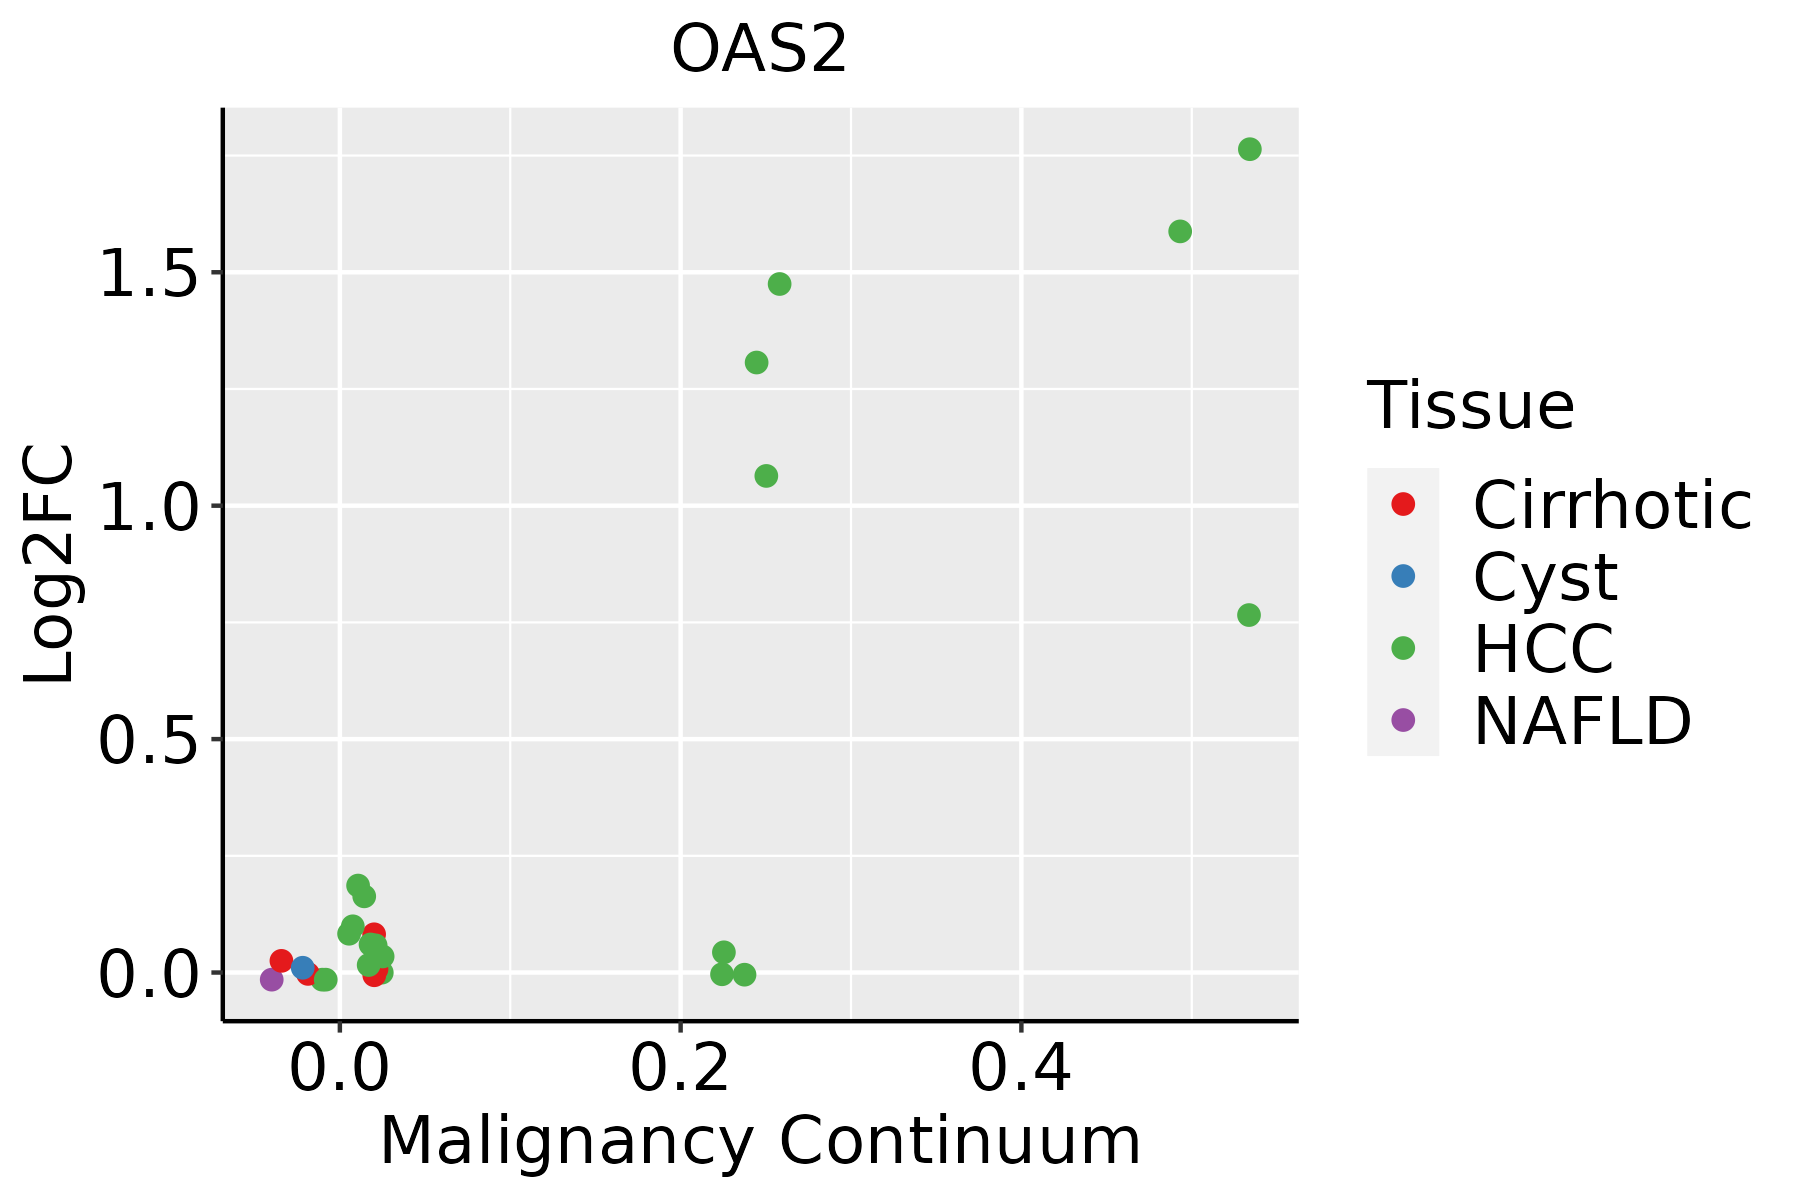 | HCC: Hepatocellular carcinoma |
| NAFLD: Non-alcoholic fatty liver disease |
| Oral Cavity |  | EOLP: Erosive Oral lichen planus |
| LP: leukoplakia |
| NEOLP: Non-erosive oral lichen planus |
| OSCC: Oral squamous cell carcinoma |
| Skin | 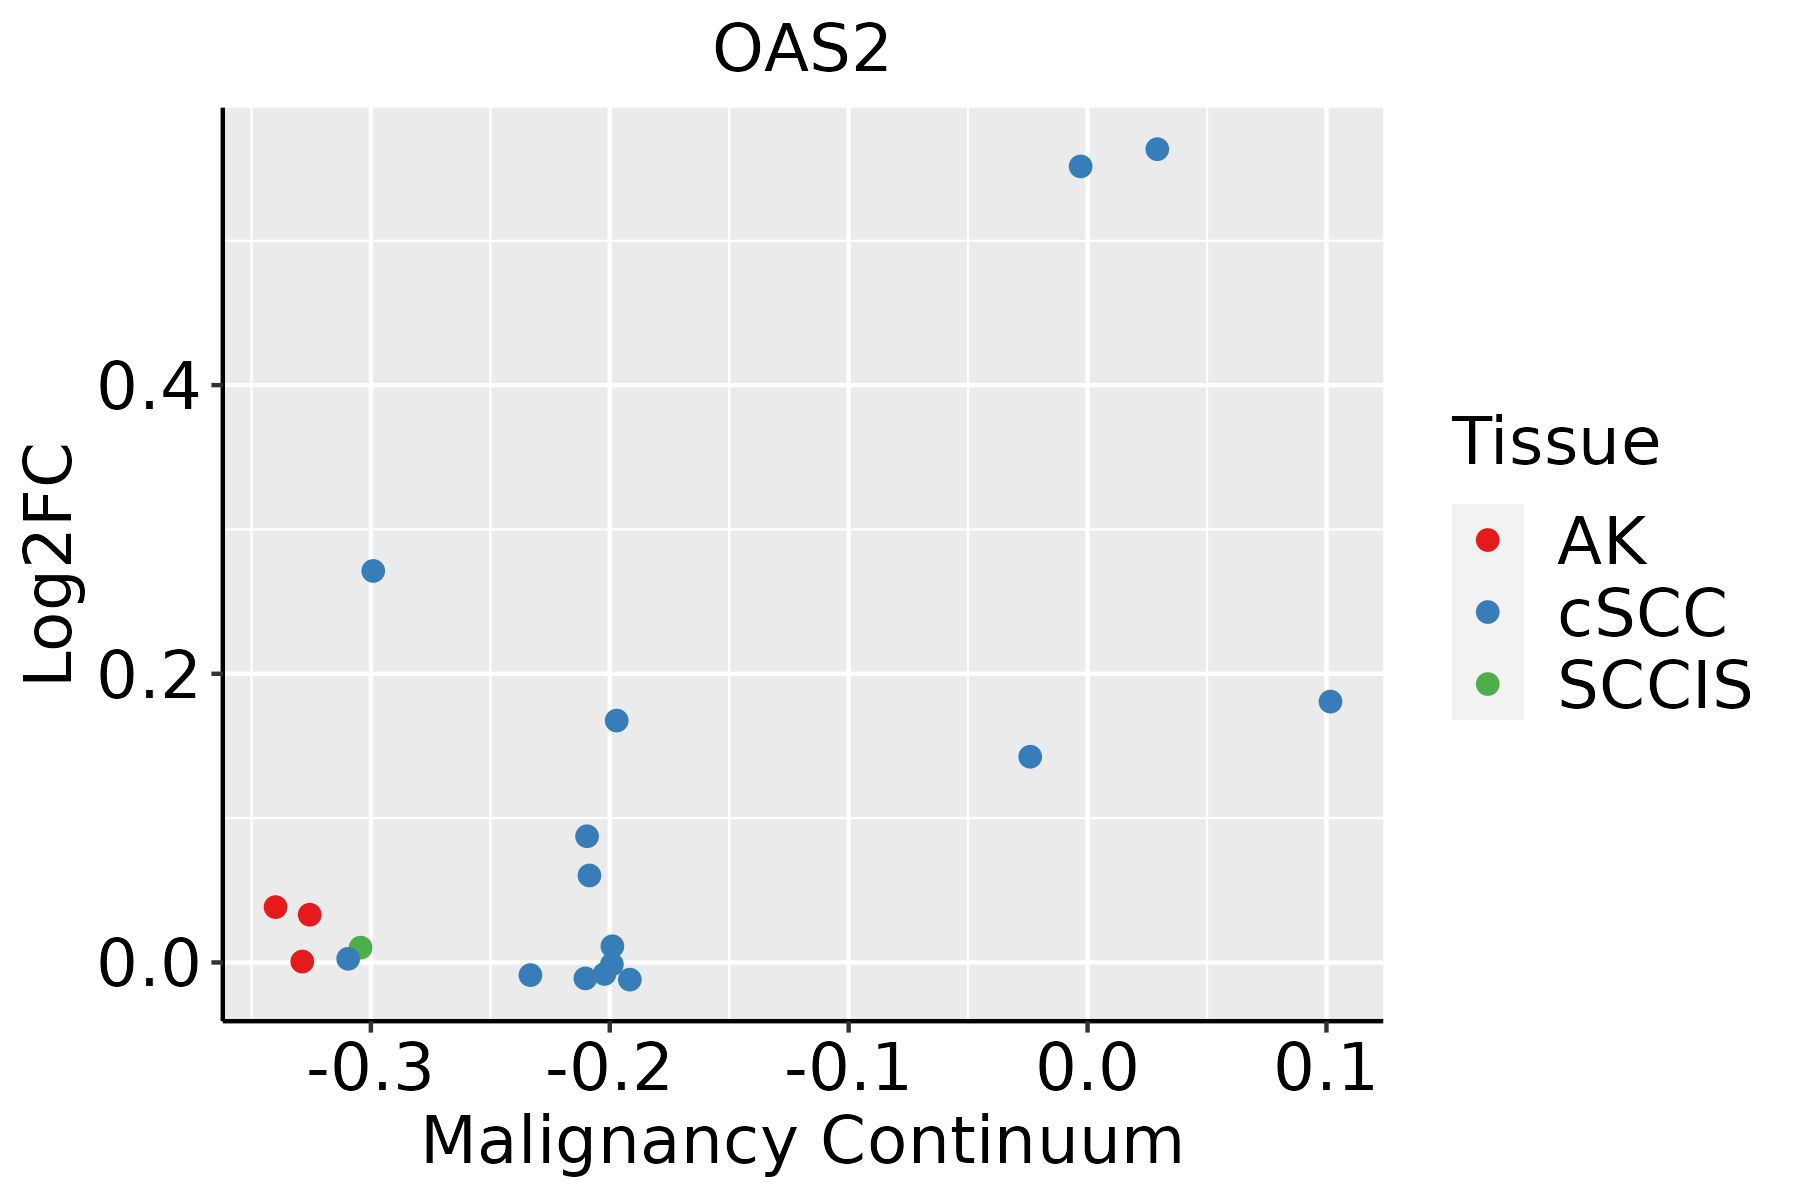 | AK: Actinic keratosis |
| cSCC: Cutaneous squamous cell carcinoma |
| SCCIS:squamous cell carcinoma in situ |
| Thyroid |  | ATC: Anaplastic thyroid cancer |
| HT: Hashimoto's thyroiditis |
| PTC: Papillary thyroid cancer |
| GO ID | Tissue | Disease Stage | Description | Gene Ratio | Bg Ratio | pvalue | p.adjust | Count |
| GO:00326085 | Skin | cSCC | interferon-beta production | 24/4864 | 56/18723 | 4.44e-03 | 2.29e-02 | 24 |
| GO:00326485 | Skin | cSCC | regulation of interferon-beta production | 24/4864 | 56/18723 | 4.44e-03 | 2.29e-02 | 24 |
| GO:00327285 | Skin | cSCC | positive regulation of interferon-beta production | 18/4864 | 39/18723 | 5.14e-03 | 2.60e-02 | 18 |
| GO:00324795 | Skin | cSCC | regulation of type I interferon production | 36/4864 | 95/18723 | 6.99e-03 | 3.38e-02 | 36 |
| GO:00326065 | Skin | cSCC | type I interferon production | 36/4864 | 95/18723 | 6.99e-03 | 3.38e-02 | 36 |
| GO:001603234 | Thyroid | ATC | viral process | 241/6293 | 415/18723 | 5.50e-25 | 2.04e-22 | 241 |
| GO:000640127 | Thyroid | ATC | RNA catabolic process | 165/6293 | 278/18723 | 8.45e-19 | 1.14e-16 | 165 |
| GO:003465525 | Thyroid | ATC | nucleobase-containing compound catabolic process | 217/6293 | 407/18723 | 1.20e-16 | 1.04e-14 | 217 |
| GO:004670024 | Thyroid | ATC | heterocycle catabolic process | 228/6293 | 445/18723 | 7.26e-15 | 4.50e-13 | 228 |
| GO:001905835 | Thyroid | ATC | viral life cycle | 173/6293 | 317/18723 | 9.22e-15 | 5.50e-13 | 173 |
| GO:004427025 | Thyroid | ATC | cellular nitrogen compound catabolic process | 229/6293 | 451/18723 | 2.25e-14 | 1.27e-12 | 229 |
| GO:001943924 | Thyroid | ATC | aromatic compound catabolic process | 232/6293 | 467/18723 | 3.05e-13 | 1.44e-11 | 232 |
| GO:190136124 | Thyroid | ATC | organic cyclic compound catabolic process | 238/6293 | 495/18723 | 1.12e-11 | 4.12e-10 | 238 |
| GO:004873233 | Thyroid | ATC | gland development | 210/6293 | 436/18723 | 1.50e-10 | 4.59e-09 | 210 |
| GO:001907929 | Thyroid | ATC | viral genome replication | 78/6293 | 131/18723 | 9.92e-10 | 2.55e-08 | 78 |
| GO:005079228 | Thyroid | ATC | regulation of viral process | 90/6293 | 164/18723 | 1.61e-08 | 3.23e-07 | 90 |
| GO:0009615111 | Thyroid | ATC | response to virus | 173/6293 | 367/18723 | 4.23e-08 | 7.71e-07 | 173 |
| GO:003434015 | Thyroid | ATC | response to type I interferon | 38/6293 | 58/18723 | 6.67e-07 | 9.13e-06 | 38 |
| GO:190390028 | Thyroid | ATC | regulation of viral life cycle | 77/6293 | 148/18723 | 2.79e-06 | 3.21e-05 | 77 |
| GO:004506926 | Thyroid | ATC | regulation of viral genome replication | 49/6293 | 85/18723 | 4.54e-06 | 4.97e-05 | 49 |
| Pathway ID | Tissue | Disease Stage | Description | Gene Ratio | Bg Ratio | pvalue | p.adjust | qvalue | Count |
| hsa05169210 | Esophagus | ESCC | Epstein-Barr virus infection | 151/4205 | 202/8465 | 1.55e-13 | 3.45e-12 | 1.77e-12 | 151 |
| hsa0516425 | Esophagus | ESCC | Influenza A | 122/4205 | 171/8465 | 5.01e-09 | 4.79e-08 | 2.45e-08 | 122 |
| hsa05171211 | Esophagus | ESCC | Coronavirus disease - COVID-19 | 156/4205 | 232/8465 | 3.18e-08 | 2.68e-07 | 1.37e-07 | 156 |
| hsa051609 | Esophagus | ESCC | Hepatitis C | 107/4205 | 157/8465 | 1.75e-06 | 1.08e-05 | 5.55e-06 | 107 |
| hsa051629 | Esophagus | ESCC | Measles | 90/4205 | 139/8465 | 2.16e-04 | 7.87e-04 | 4.03e-04 | 90 |
| hsa0462122 | Esophagus | ESCC | NOD-like receptor signaling pathway | 116/4205 | 186/8465 | 2.90e-04 | 1.03e-03 | 5.30e-04 | 116 |
| hsa0516937 | Esophagus | ESCC | Epstein-Barr virus infection | 151/4205 | 202/8465 | 1.55e-13 | 3.45e-12 | 1.77e-12 | 151 |
| hsa0516435 | Esophagus | ESCC | Influenza A | 122/4205 | 171/8465 | 5.01e-09 | 4.79e-08 | 2.45e-08 | 122 |
| hsa05171310 | Esophagus | ESCC | Coronavirus disease - COVID-19 | 156/4205 | 232/8465 | 3.18e-08 | 2.68e-07 | 1.37e-07 | 156 |
| hsa0516016 | Esophagus | ESCC | Hepatitis C | 107/4205 | 157/8465 | 1.75e-06 | 1.08e-05 | 5.55e-06 | 107 |
| hsa0516213 | Esophagus | ESCC | Measles | 90/4205 | 139/8465 | 2.16e-04 | 7.87e-04 | 4.03e-04 | 90 |
| hsa0462132 | Esophagus | ESCC | NOD-like receptor signaling pathway | 116/4205 | 186/8465 | 2.90e-04 | 1.03e-03 | 5.30e-04 | 116 |
| hsa0517142 | Liver | HCC | Coronavirus disease - COVID-19 | 167/4020 | 232/8465 | 1.50e-14 | 4.19e-13 | 2.33e-13 | 167 |
| hsa0516921 | Liver | HCC | Epstein-Barr virus infection | 128/4020 | 202/8465 | 3.17e-06 | 2.79e-05 | 1.55e-05 | 128 |
| hsa0516021 | Liver | HCC | Hepatitis C | 94/4020 | 157/8465 | 1.11e-03 | 4.10e-03 | 2.28e-03 | 94 |
| hsa0516421 | Liver | HCC | Influenza A | 101/4020 | 171/8465 | 1.41e-03 | 5.07e-03 | 2.82e-03 | 101 |
| hsa0517152 | Liver | HCC | Coronavirus disease - COVID-19 | 167/4020 | 232/8465 | 1.50e-14 | 4.19e-13 | 2.33e-13 | 167 |
| hsa0516931 | Liver | HCC | Epstein-Barr virus infection | 128/4020 | 202/8465 | 3.17e-06 | 2.79e-05 | 1.55e-05 | 128 |
| hsa0516031 | Liver | HCC | Hepatitis C | 94/4020 | 157/8465 | 1.11e-03 | 4.10e-03 | 2.28e-03 | 94 |
| hsa0516431 | Liver | HCC | Influenza A | 101/4020 | 171/8465 | 1.41e-03 | 5.07e-03 | 2.82e-03 | 101 |
| Hugo Symbol | Variant Class | Variant Classification | dbSNP RS | HGVSc | HGVSp | HGVSp Short | SWISSPROT | BIOTYPE | SIFT | PolyPhen | Tumor Sample Barcode | Tissue | Histology | Sex | Age | Stage | Therapy Types | Drugs | Outcome |
| OAS2 | SNV | Missense_Mutation | rs200589437 | c.686N>T | p.Thr229Met | p.T229M | P29728 | protein_coding | deleterious(0) | probably_damaging(0.991) | TCGA-A8-A082-01 | Breast | breast invasive carcinoma | Female | <65 | I/II | Chemotherapy | 5-fluorouracil | CR |
| OAS2 | SNV | Missense_Mutation | | c.220G>A | p.Asp74Asn | p.D74N | P29728 | protein_coding | deleterious(0.02) | probably_damaging(0.997) | TCGA-A8-A08J-01 | Breast | breast invasive carcinoma | Female | <65 | III/IV | Unknown | Unknown | PD |
| OAS2 | SNV | Missense_Mutation | | c.59N>C | p.Ile20Thr | p.I20T | P29728 | protein_coding | deleterious(0) | possibly_damaging(0.498) | TCGA-AC-A23H-01 | Breast | breast invasive carcinoma | Female | >=65 | I/II | Unknown | Unknown | PD |
| OAS2 | SNV | Missense_Mutation | rs568482198 | c.433G>A | p.Ala145Thr | p.A145T | P29728 | protein_coding | tolerated(0.06) | benign(0.264) | TCGA-AC-A62X-01 | Breast | breast invasive carcinoma | Female | >=65 | I/II | Unknown | Unknown | SD |
| OAS2 | SNV | Missense_Mutation | rs753242512 | c.1586N>A | p.Arg529Gln | p.R529Q | P29728 | protein_coding | deleterious(0.03) | benign(0.044) | TCGA-AN-A046-01 | Breast | breast invasive carcinoma | Female | >=65 | I/II | Unknown | Unknown | SD |
| OAS2 | SNV | Missense_Mutation | | c.373G>C | p.Asp125His | p.D125H | P29728 | protein_coding | tolerated(0.15) | benign(0.001) | TCGA-D8-A1JA-01 | Breast | breast invasive carcinoma | Female | <65 | III/IV | Chemotherapy | adriamycin | PD |
| OAS2 | SNV | Missense_Mutation | | c.706N>T | p.Gly236Trp | p.G236W | P29728 | protein_coding | deleterious(0.01) | probably_damaging(1) | TCGA-E9-A1NA-01 | Breast | breast invasive carcinoma | Female | <65 | I/II | Chemotherapy | cyclophosphamide | SD |
| OAS2 | SNV | Missense_Mutation | rs775523501 | c.688N>A | p.Val230Met | p.V230M | P29728 | protein_coding | deleterious(0) | probably_damaging(1) | TCGA-GM-A2DA-01 | Breast | breast invasive carcinoma | Female | <65 | I/II | Chemotherapy | fluorouracil | PD |
| OAS2 | SNV | Missense_Mutation | | c.641N>A | p.Ile214Asn | p.I214N | P29728 | protein_coding | tolerated(0.37) | benign(0) | TCGA-GM-A2DK-01 | Breast | breast invasive carcinoma | Female | <65 | I/II | Hormone Therapy | arimidex | CR |
| OAS2 | SNV | Missense_Mutation | novel | c.1916N>T | p.Ala639Val | p.A639V | P29728 | protein_coding | deleterious(0) | probably_damaging(0.969) | TCGA-LL-A5YM-01 | Breast | breast invasive carcinoma | Female | >=65 | III/IV | Unspecific | letrozole | PD |


