| Tissue | Expression Dynamics | Abbreviation |
| Cervix | 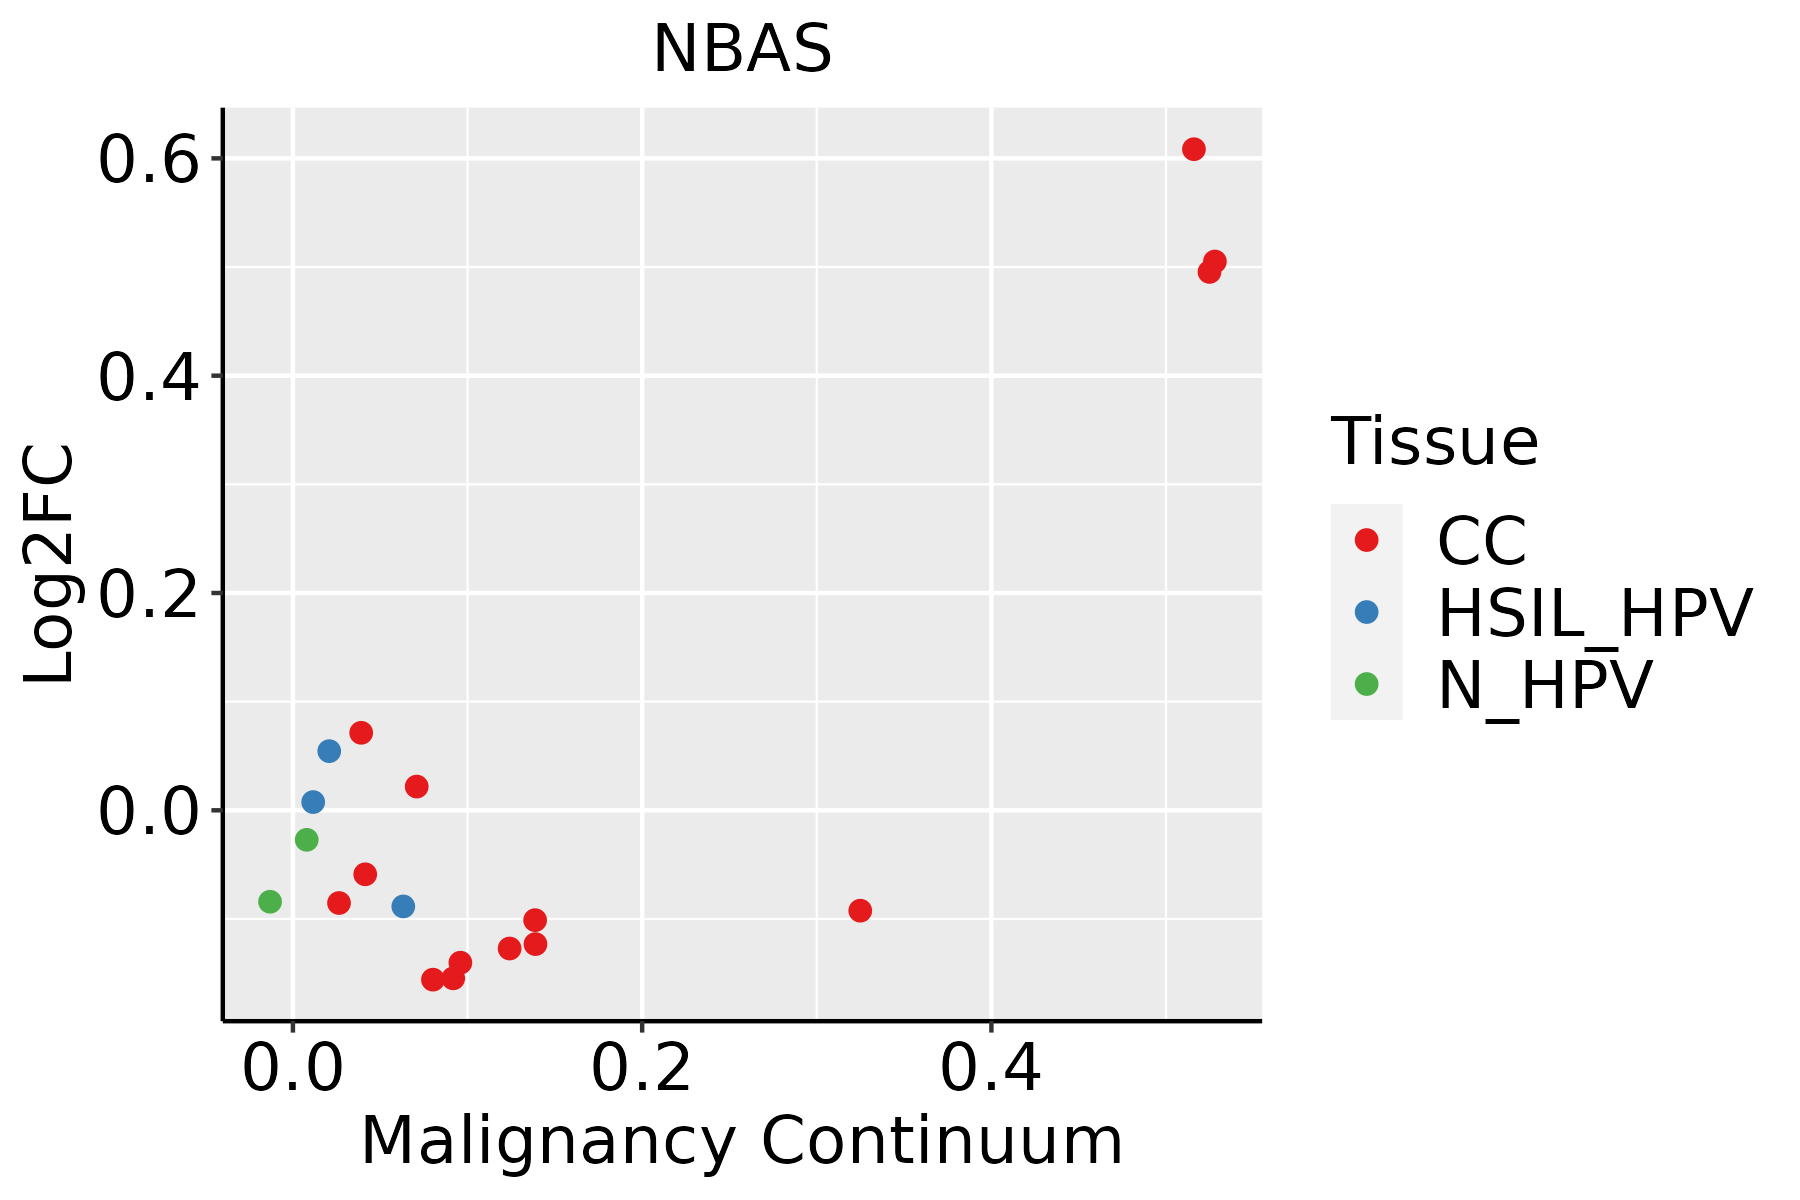 | CC: Cervix cancer |
| HSIL_HPV: HPV-infected high-grade squamous intraepithelial lesions |
| N_HPV: HPV-infected normal cervix |
| Colorectum (GSE201348) | 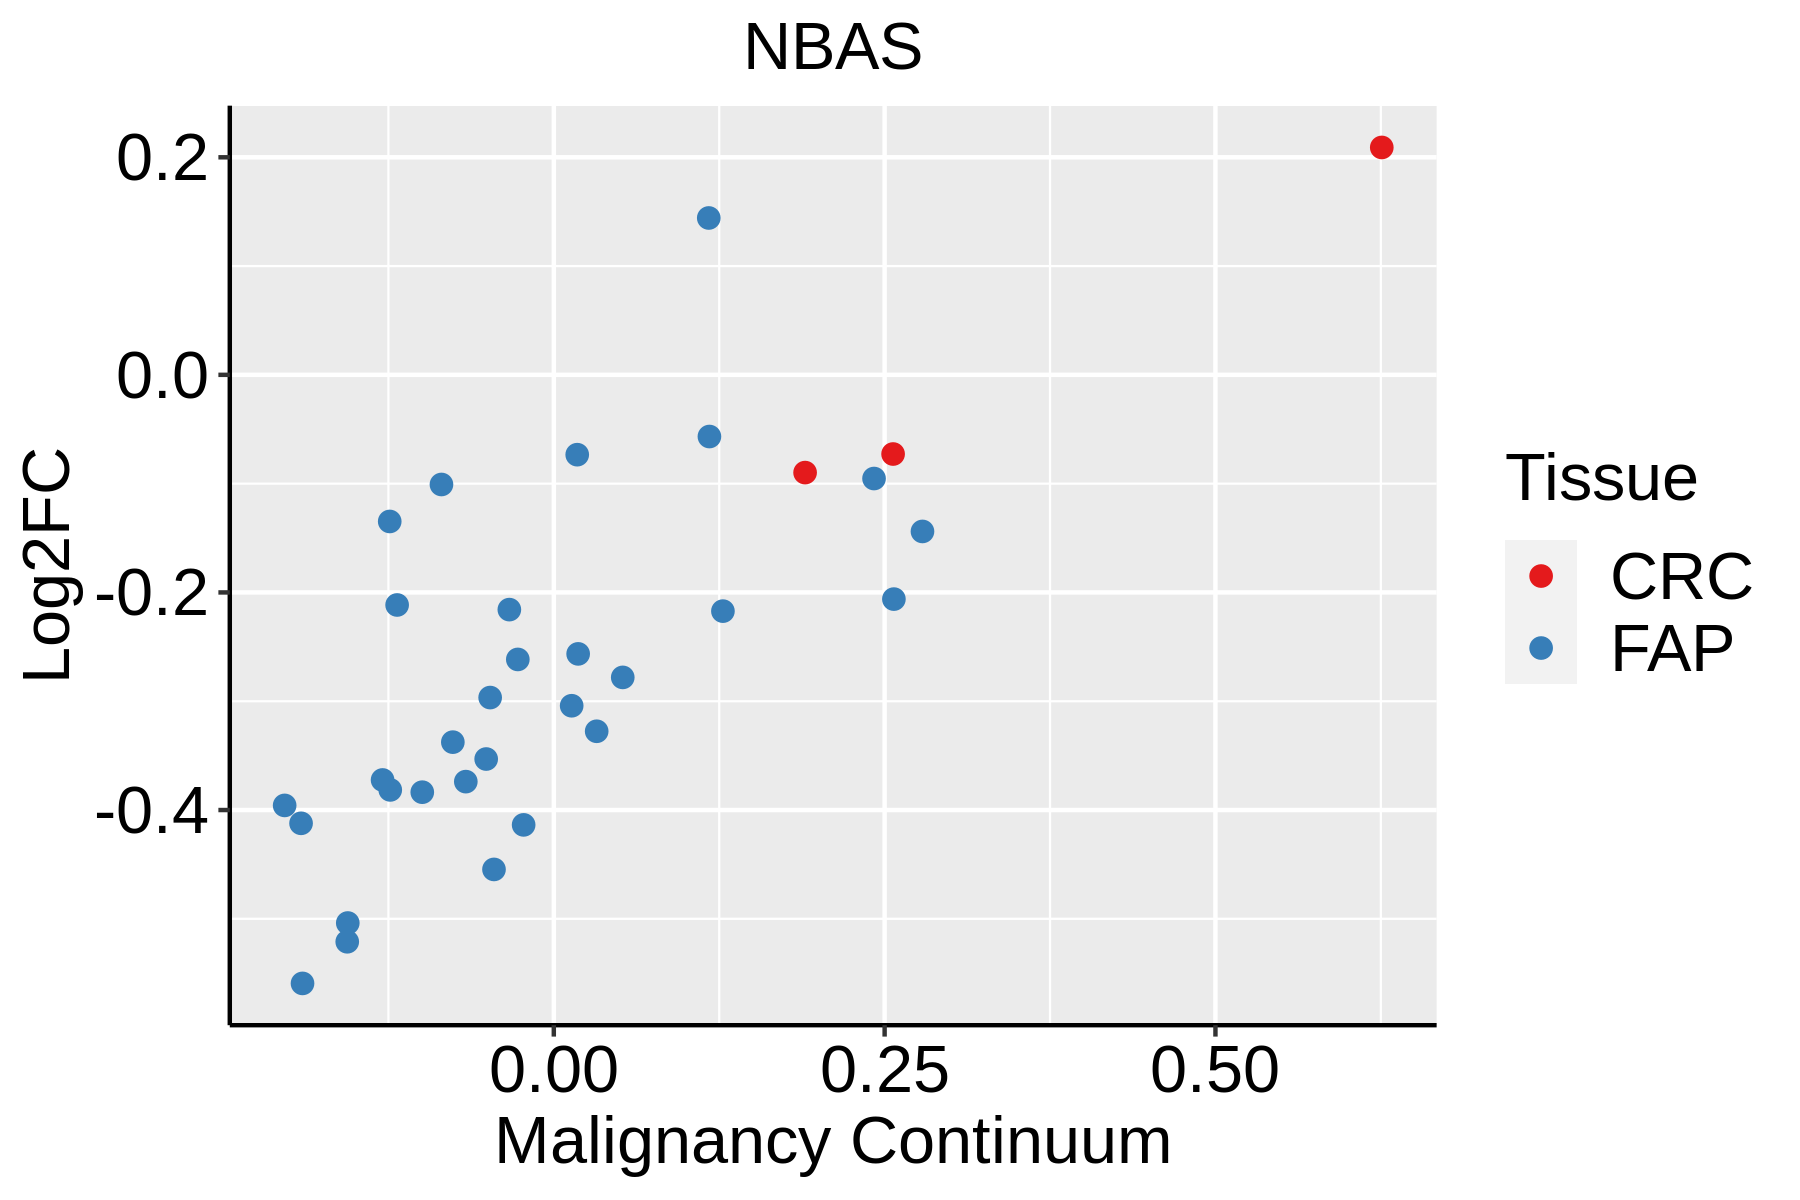 | FAP: Familial adenomatous polyposis |
| CRC: Colorectal cancer |
| Colorectum (HTA11) |  | AD: Adenomas |
| SER: Sessile serrated lesions |
| MSI-H: Microsatellite-high colorectal cancer |
| MSS: Microsatellite stable colorectal cancer |
| Endometrium | 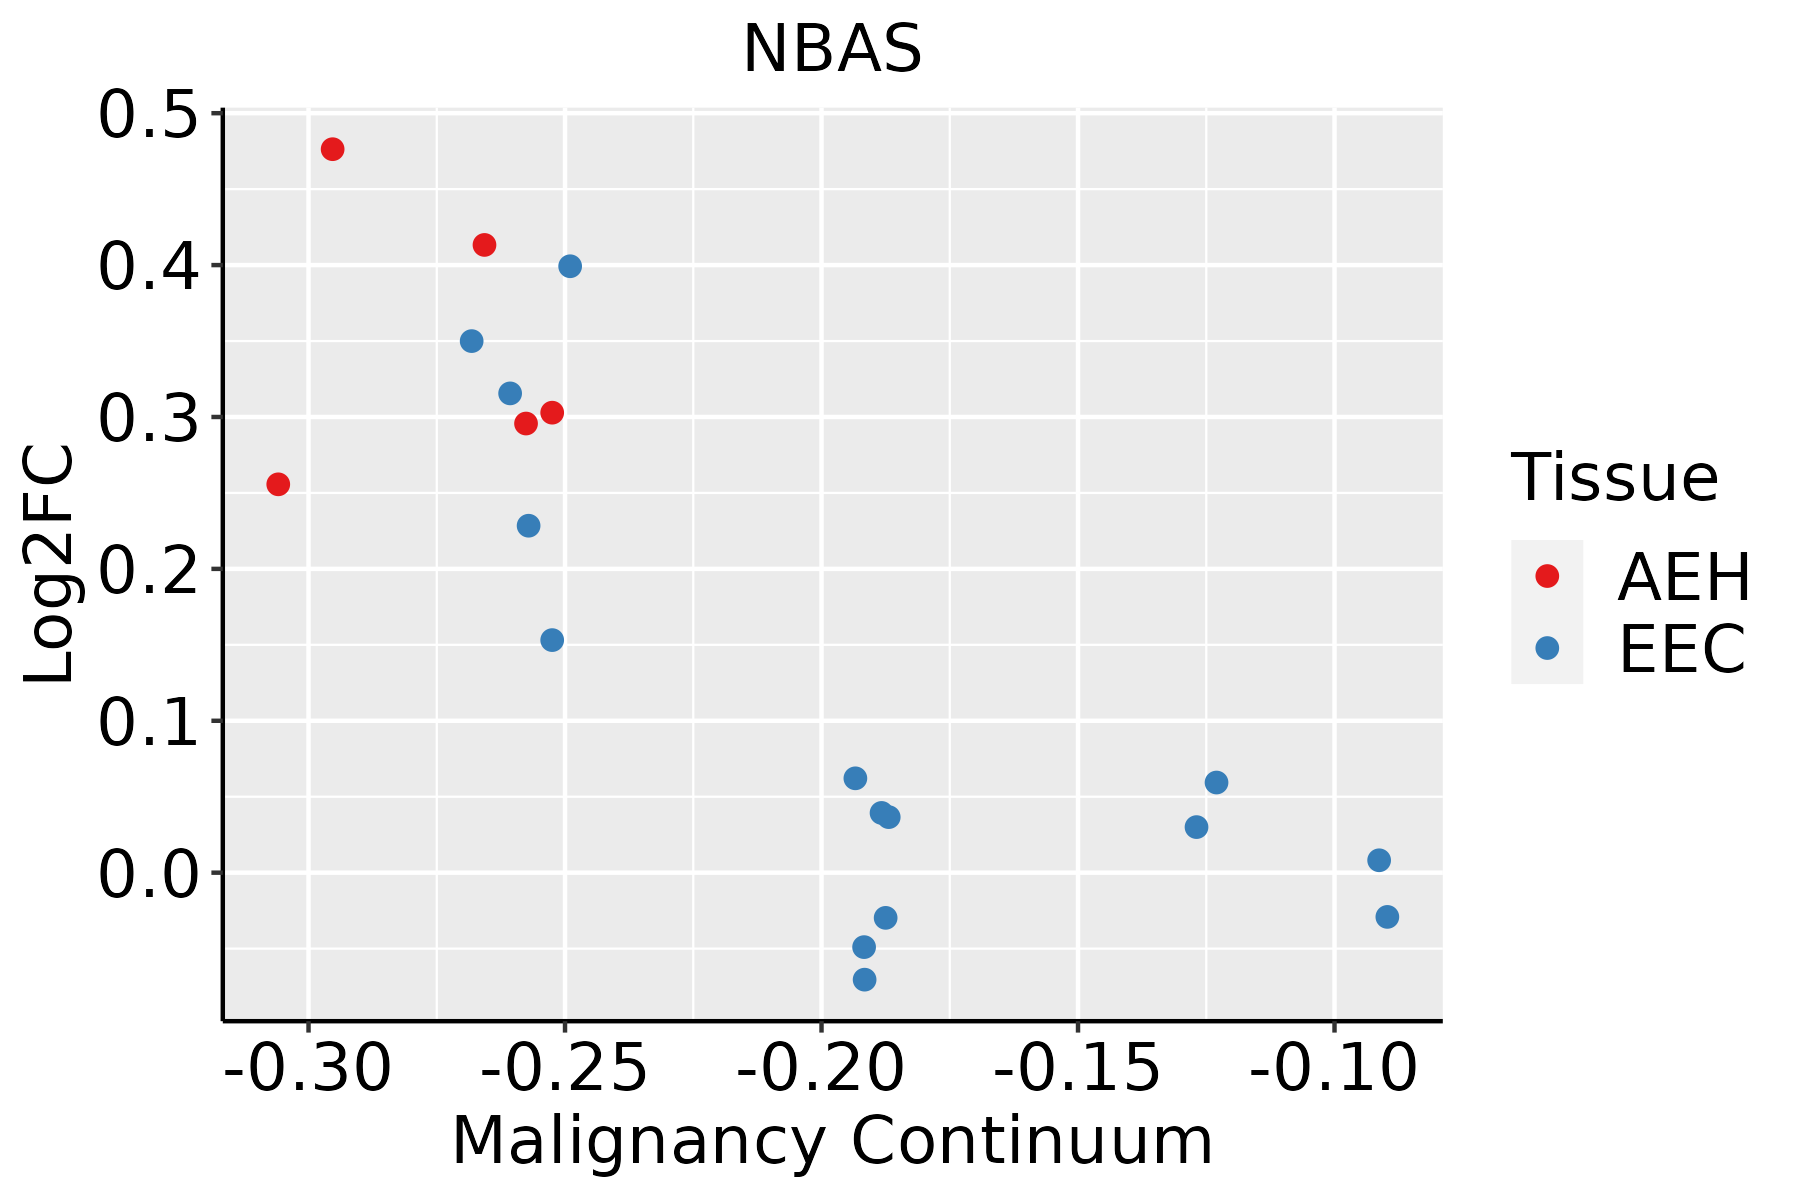 | AEH: Atypical endometrial hyperplasia |
| EEC: Endometrioid Cancer |
| Esophagus |  | ESCC: Esophageal squamous cell carcinoma |
| HGIN: High-grade intraepithelial neoplasias |
| LGIN: Low-grade intraepithelial neoplasias |
| Liver | 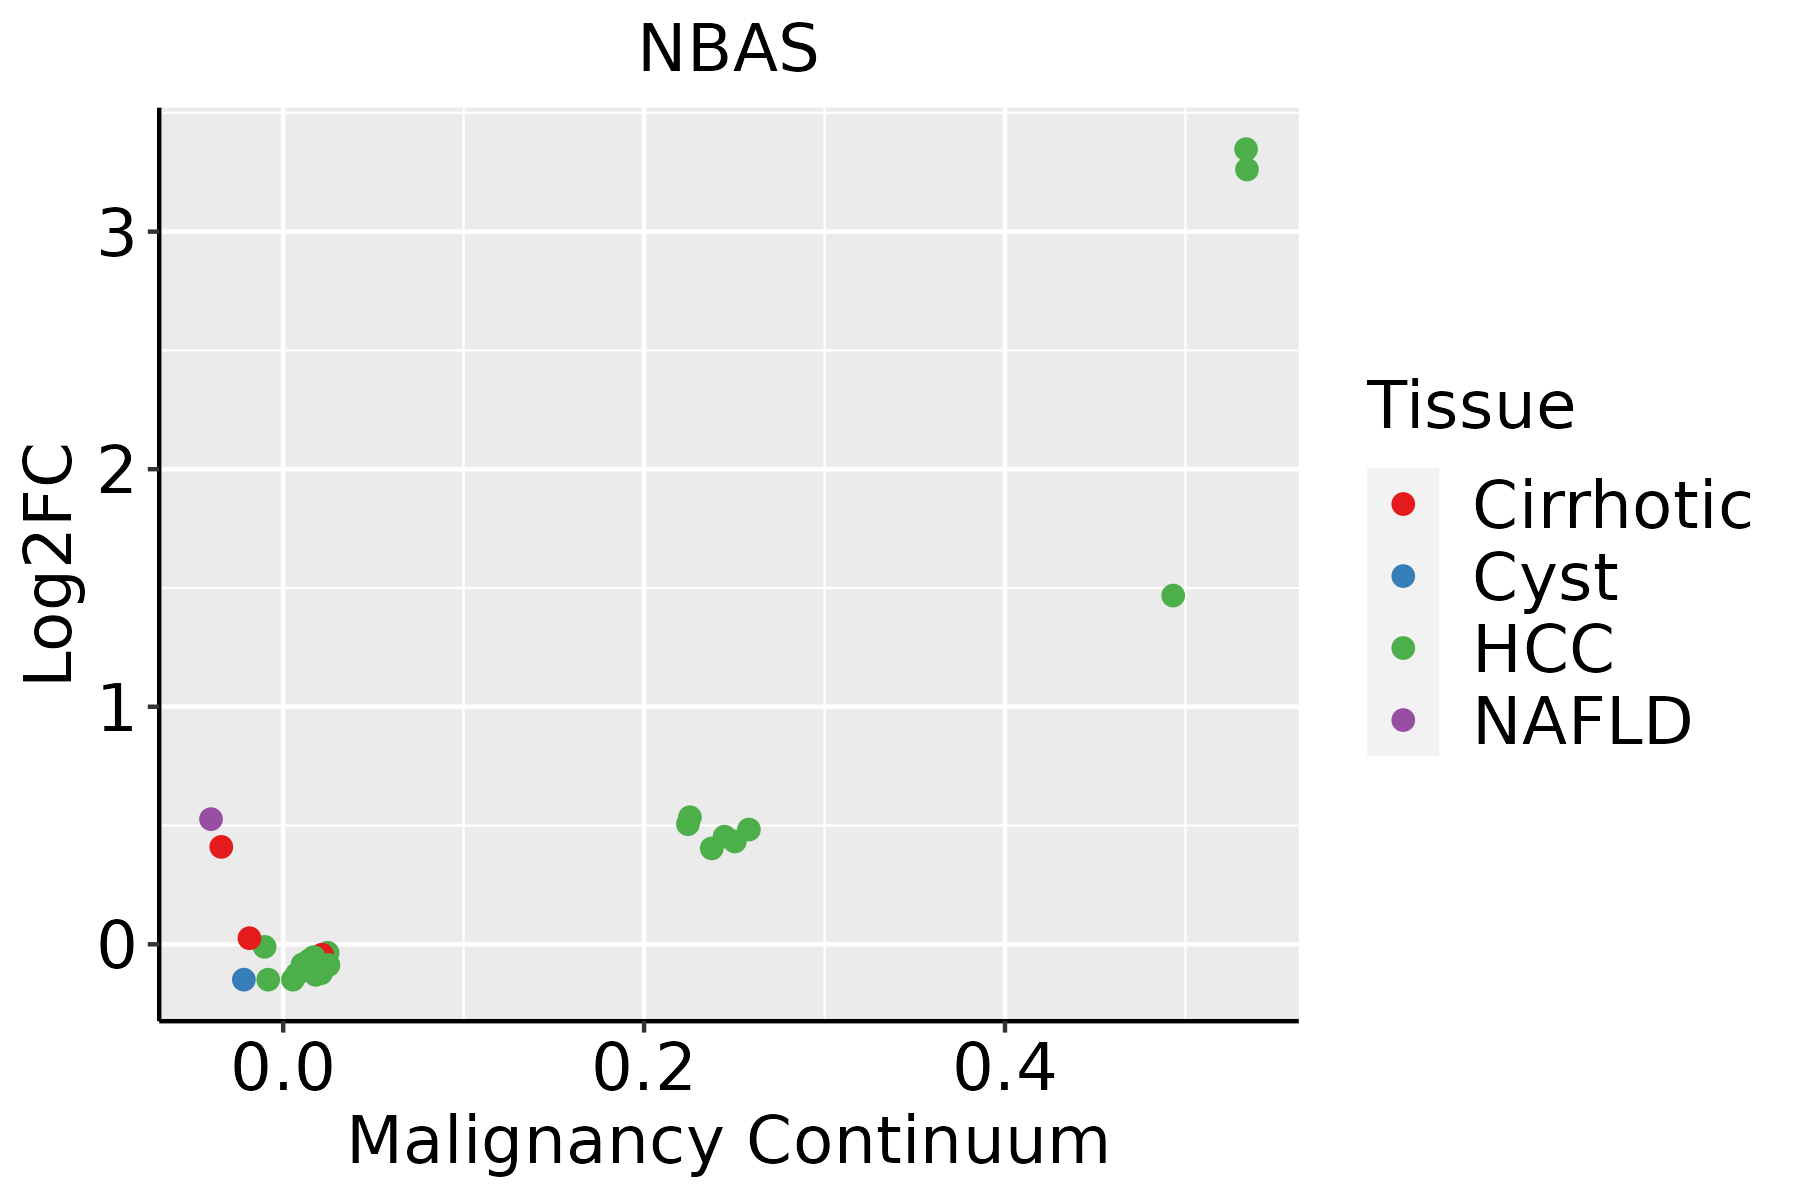 | HCC: Hepatocellular carcinoma |
| NAFLD: Non-alcoholic fatty liver disease |
| Thyroid |  | ATC: Anaplastic thyroid cancer |
| HT: Hashimoto's thyroiditis |
| PTC: Papillary thyroid cancer |
| GO ID | Tissue | Disease Stage | Description | Gene Ratio | Bg Ratio | pvalue | p.adjust | Count |
| GO:004670017 | Esophagus | HGIN | heterocycle catabolic process | 103/2587 | 445/18723 | 5.44e-08 | 2.99e-06 | 103 |
| GO:004427018 | Esophagus | HGIN | cellular nitrogen compound catabolic process | 103/2587 | 451/18723 | 1.10e-07 | 5.56e-06 | 103 |
| GO:001943917 | Esophagus | HGIN | aromatic compound catabolic process | 105/2587 | 467/18723 | 1.89e-07 | 9.31e-06 | 105 |
| GO:190136117 | Esophagus | HGIN | organic cyclic compound catabolic process | 106/2587 | 495/18723 | 1.94e-06 | 7.13e-05 | 106 |
| GO:190331226 | Esophagus | HGIN | negative regulation of mRNA metabolic process | 29/2587 | 92/18723 | 1.01e-05 | 2.92e-04 | 29 |
| GO:006101318 | Esophagus | HGIN | regulation of mRNA catabolic process | 43/2587 | 166/18723 | 2.48e-05 | 6.53e-04 | 43 |
| GO:000689016 | Esophagus | HGIN | retrograde vesicle-mediated transport, Golgi to endoplasmic reticulum | 19/2587 | 52/18723 | 3.44e-05 | 8.67e-04 | 19 |
| GO:00001846 | Esophagus | HGIN | nuclear-transcribed mRNA catabolic process, nonsense-mediated decay | 15/2587 | 37/18723 | 5.66e-05 | 1.33e-03 | 15 |
| GO:190236915 | Esophagus | HGIN | negative regulation of RNA catabolic process | 21/2587 | 75/18723 | 9.58e-04 | 1.21e-02 | 21 |
| GO:190237314 | Esophagus | HGIN | negative regulation of mRNA catabolic process | 17/2587 | 63/18723 | 4.29e-03 | 3.82e-02 | 17 |
| GO:004819318 | Esophagus | ESCC | Golgi vesicle transport | 231/8552 | 296/18723 | 1.82e-30 | 9.63e-28 | 231 |
| GO:1903311110 | Esophagus | ESCC | regulation of mRNA metabolic process | 210/8552 | 288/18723 | 3.25e-21 | 5.56e-19 | 210 |
| GO:0006401110 | Esophagus | ESCC | RNA catabolic process | 204/8552 | 278/18723 | 3.39e-21 | 5.66e-19 | 204 |
| GO:0034655110 | Esophagus | ESCC | nucleobase-containing compound catabolic process | 272/8552 | 407/18723 | 2.92e-18 | 2.90e-16 | 272 |
| GO:0006402110 | Esophagus | ESCC | mRNA catabolic process | 170/8552 | 232/18723 | 8.70e-18 | 8.00e-16 | 170 |
| GO:004670018 | Esophagus | ESCC | heterocycle catabolic process | 286/8552 | 445/18723 | 1.12e-15 | 7.47e-14 | 286 |
| GO:004427019 | Esophagus | ESCC | cellular nitrogen compound catabolic process | 288/8552 | 451/18723 | 3.03e-15 | 1.79e-13 | 288 |
| GO:001943918 | Esophagus | ESCC | aromatic compound catabolic process | 295/8552 | 467/18723 | 1.09e-14 | 5.98e-13 | 295 |
| GO:190136118 | Esophagus | ESCC | organic cyclic compound catabolic process | 307/8552 | 495/18723 | 9.99e-14 | 4.80e-12 | 307 |
| GO:000095618 | Esophagus | ESCC | nuclear-transcribed mRNA catabolic process | 88/8552 | 112/18723 | 9.41e-13 | 4.14e-11 | 88 |
| Hugo Symbol | Variant Class | Variant Classification | dbSNP RS | HGVSc | HGVSp | HGVSp Short | SWISSPROT | BIOTYPE | SIFT | PolyPhen | Tumor Sample Barcode | Tissue | Histology | Sex | Age | Stage | Therapy Types | Drugs | Outcome |
| NBAS | SNV | Missense_Mutation | | c.6169N>T | p.Gly2057Trp | p.G2057W | A2RRP1 | protein_coding | deleterious(0.05) | possibly_damaging(0.598) | TCGA-A2-A04U-01 | Breast | breast invasive carcinoma | Female | <65 | I/II | Chemotherapy | adriamycin | SD |
| NBAS | SNV | Missense_Mutation | rs758776096 | c.6114G>C | p.Gln2038His | p.Q2038H | A2RRP1 | protein_coding | tolerated(0.24) | benign(0) | TCGA-A2-A0EQ-01 | Breast | breast invasive carcinoma | Female | <65 | I/II | Chemotherapy | adriamycin | SD |
| NBAS | SNV | Missense_Mutation | rs773223545 | c.5830N>A | p.Ala1944Thr | p.A1944T | A2RRP1 | protein_coding | tolerated(0.29) | benign(0.001) | TCGA-A2-A0T0-01 | Breast | breast invasive carcinoma | Female | <65 | I/II | Chemotherapy | taxotere | SD |
| NBAS | SNV | Missense_Mutation | novel | c.3172N>A | p.Pro1058Thr | p.P1058T | A2RRP1 | protein_coding | tolerated(0.37) | possibly_damaging(0.899) | TCGA-A2-A25A-01 | Breast | breast invasive carcinoma | Female | <65 | I/II | Unspecific | Cytoxan | SD |
| NBAS | SNV | Missense_Mutation | novel | c.6051N>A | p.Met2017Ile | p.M2017I | A2RRP1 | protein_coding | tolerated(0.08) | benign(0.035) | TCGA-AN-A046-01 | Breast | breast invasive carcinoma | Female | >=65 | I/II | Unknown | Unknown | SD |
| NBAS | SNV | Missense_Mutation | | c.6094N>A | p.Ser2032Thr | p.S2032T | A2RRP1 | protein_coding | tolerated(0.19) | benign(0.019) | TCGA-AN-A0FY-01 | Breast | breast invasive carcinoma | Female | <65 | I/II | Unknown | Unknown | SD |
| NBAS | SNV | Missense_Mutation | | c.4618G>A | p.Asp1540Asn | p.D1540N | A2RRP1 | protein_coding | deleterious(0) | probably_damaging(1) | TCGA-AR-A0TX-01 | Breast | breast invasive carcinoma | Female | <65 | I/II | Unknown | Unknown | SD |
| NBAS | SNV | Missense_Mutation | | c.1391N>T | p.Gly464Val | p.G464V | A2RRP1 | protein_coding | tolerated(0.12) | benign(0.36) | TCGA-AR-A24W-01 | Breast | breast invasive carcinoma | Female | <65 | I/II | Hormone Therapy | letrozole | SD |
| NBAS | SNV | Missense_Mutation | | c.1018G>A | p.Gly340Arg | p.G340R | A2RRP1 | protein_coding | deleterious(0) | probably_damaging(0.988) | TCGA-C8-A12V-01 | Breast | breast invasive carcinoma | Female | <65 | I/II | Unknown | Unknown | SD |
| NBAS | SNV | Missense_Mutation | | c.4990N>A | p.Asp1664Asn | p.D1664N | A2RRP1 | protein_coding | tolerated(0.45) | benign(0.003) | TCGA-C8-A26Y-01 | Breast | breast invasive carcinoma | Female | >=65 | I/II | Unknown | Unknown | SD |


