| Tissue | Expression Dynamics | Abbreviation |
| Cervix | 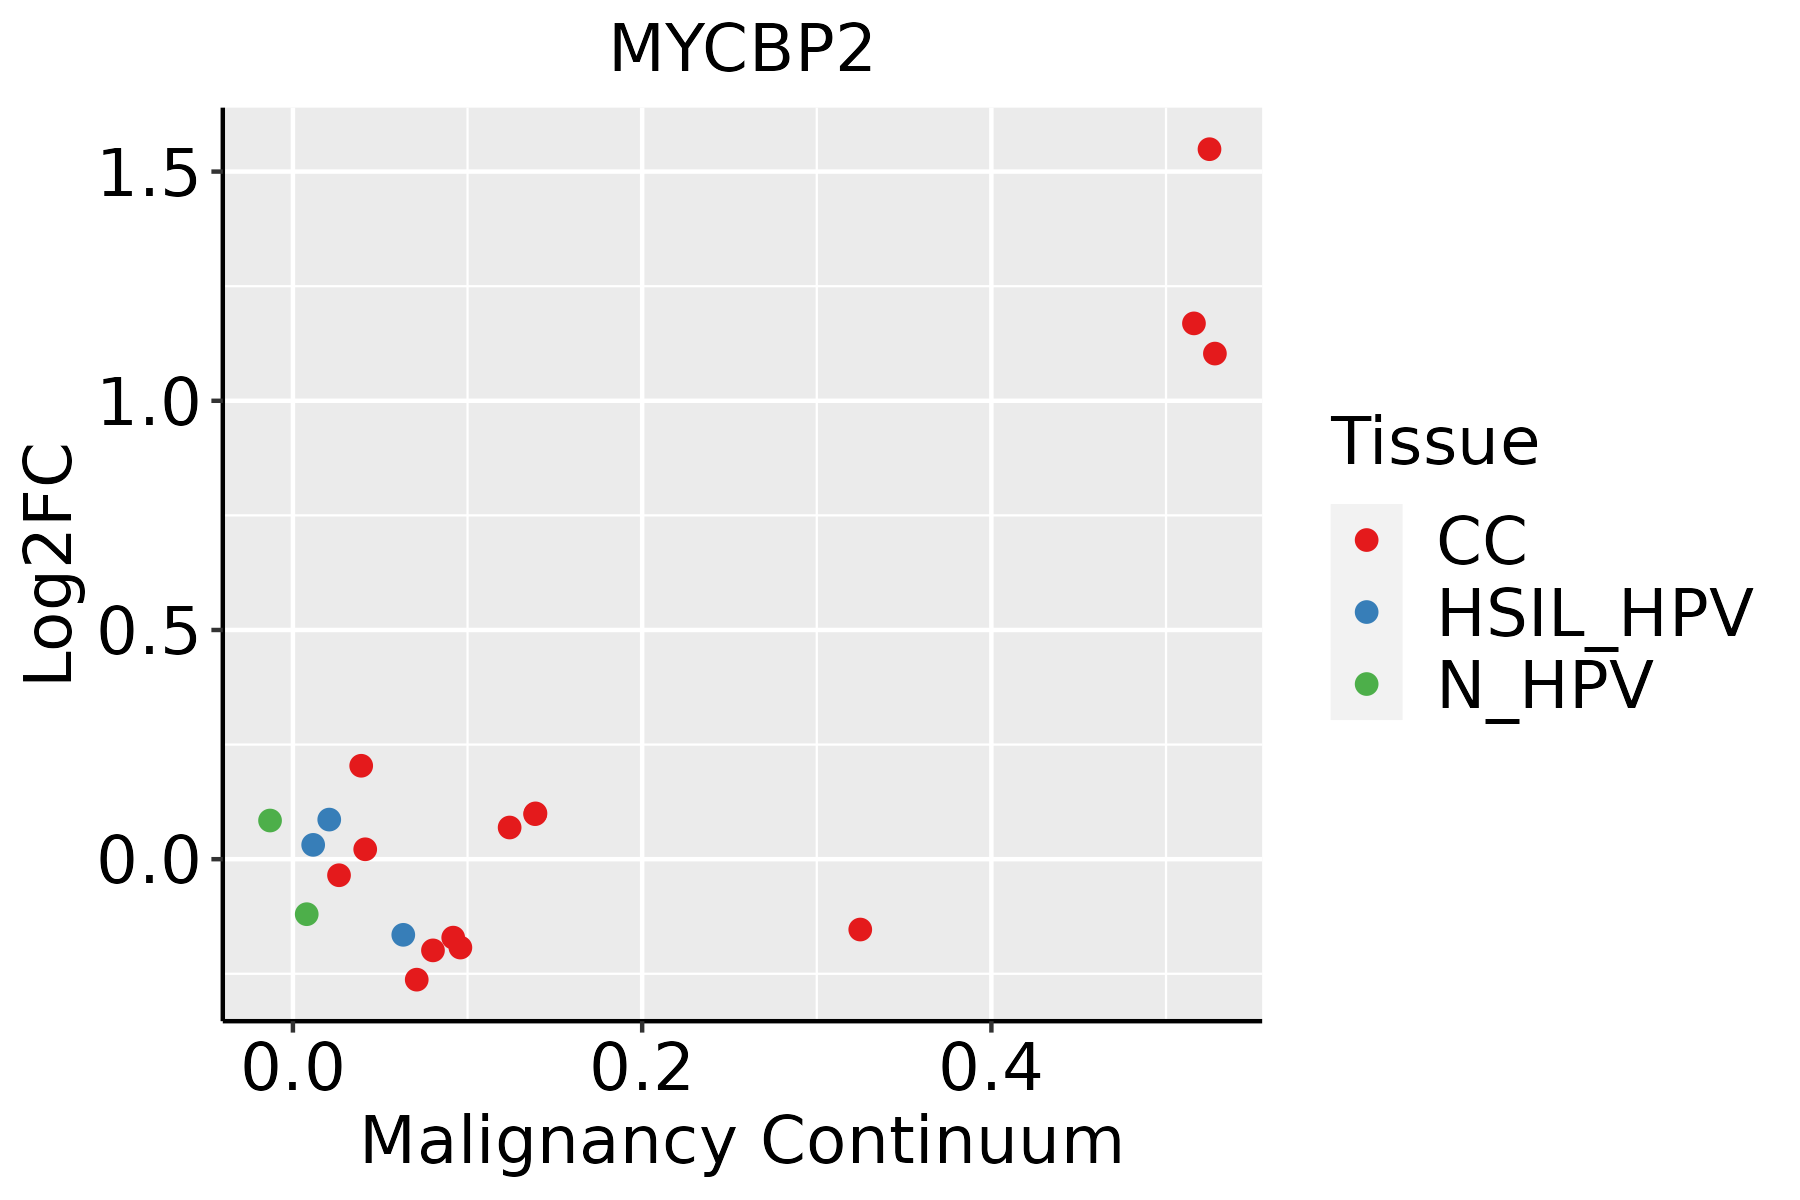 | CC: Cervix cancer |
| HSIL_HPV: HPV-infected high-grade squamous intraepithelial lesions |
| N_HPV: HPV-infected normal cervix |
| Colorectum (GSE201348) |  | FAP: Familial adenomatous polyposis |
| CRC: Colorectal cancer |
| Colorectum (HTA11) |  | AD: Adenomas |
| SER: Sessile serrated lesions |
| MSI-H: Microsatellite-high colorectal cancer |
| MSS: Microsatellite stable colorectal cancer |
| Esophagus |  | ESCC: Esophageal squamous cell carcinoma |
| HGIN: High-grade intraepithelial neoplasias |
| LGIN: Low-grade intraepithelial neoplasias |
| Liver | 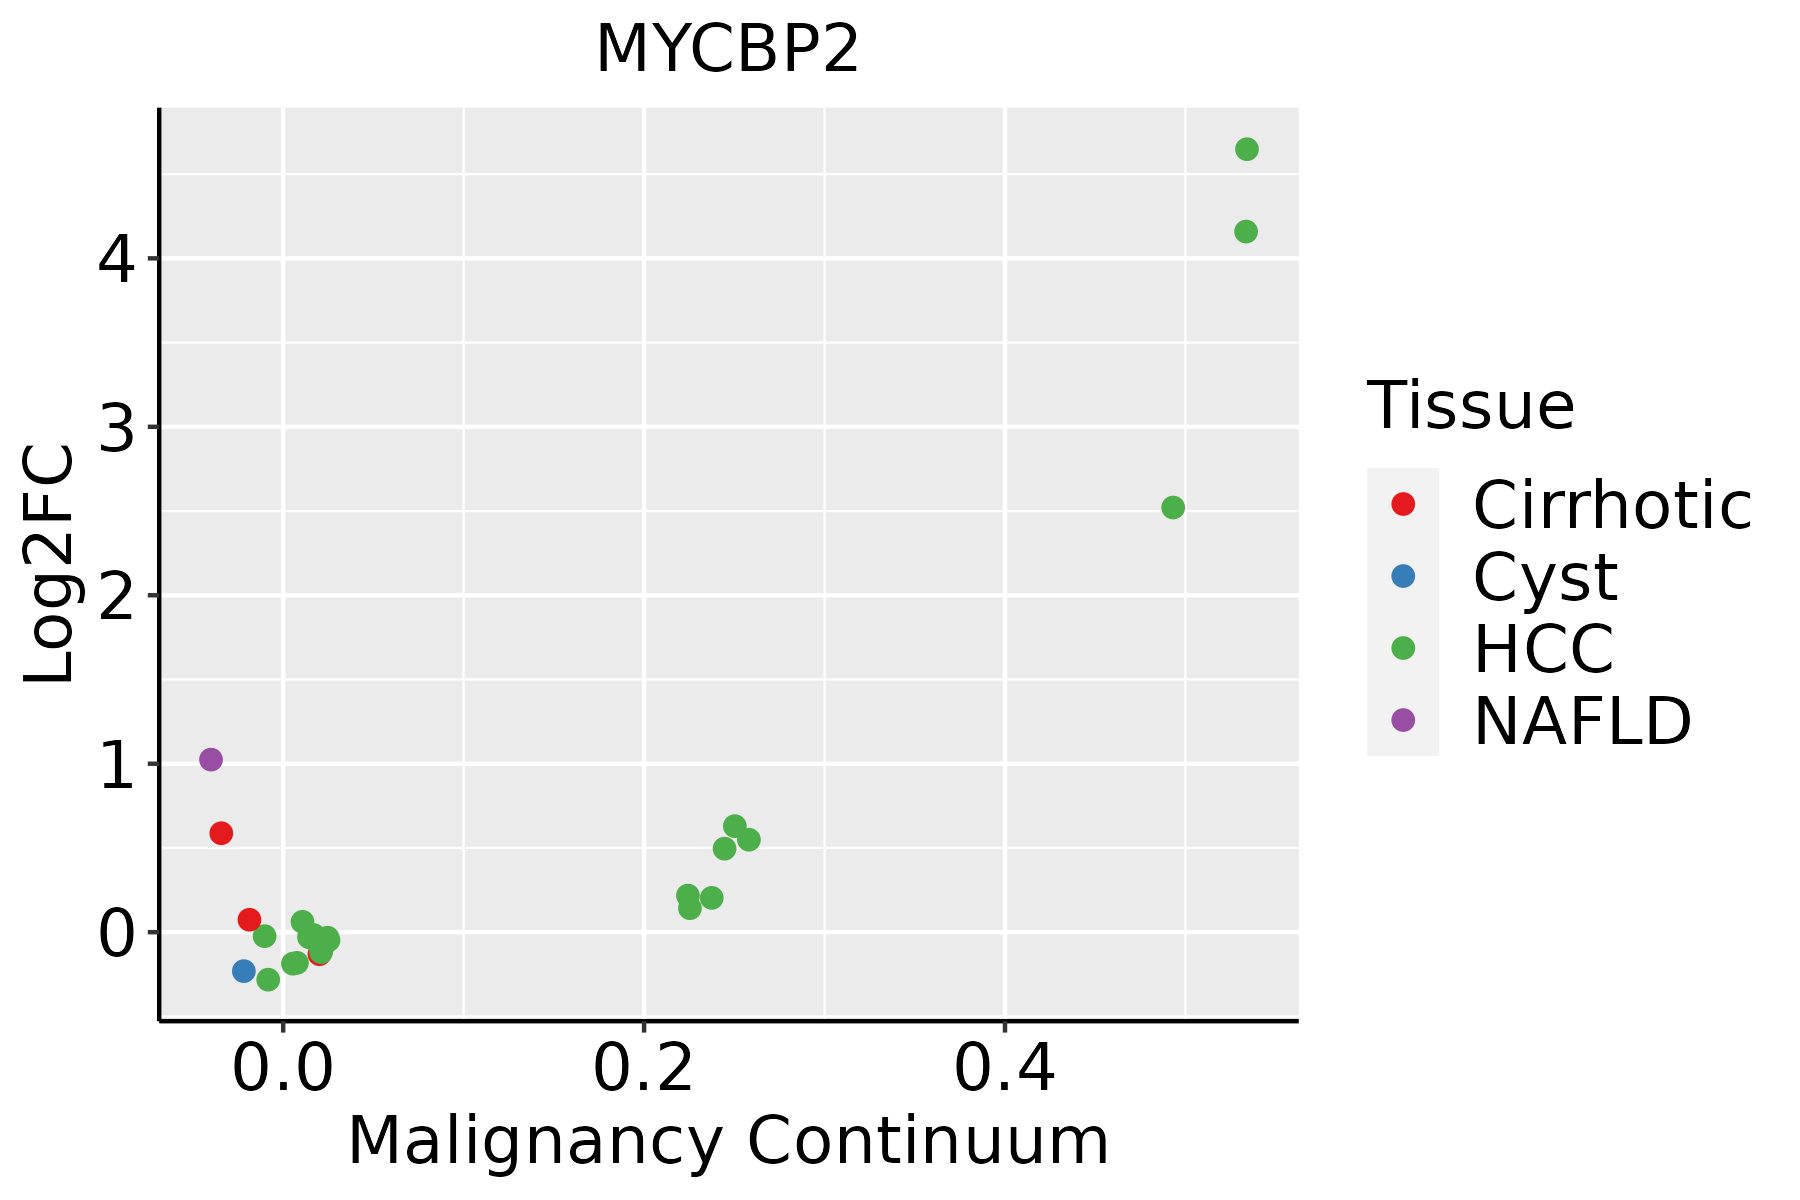 | HCC: Hepatocellular carcinoma |
| NAFLD: Non-alcoholic fatty liver disease |
| Lung | 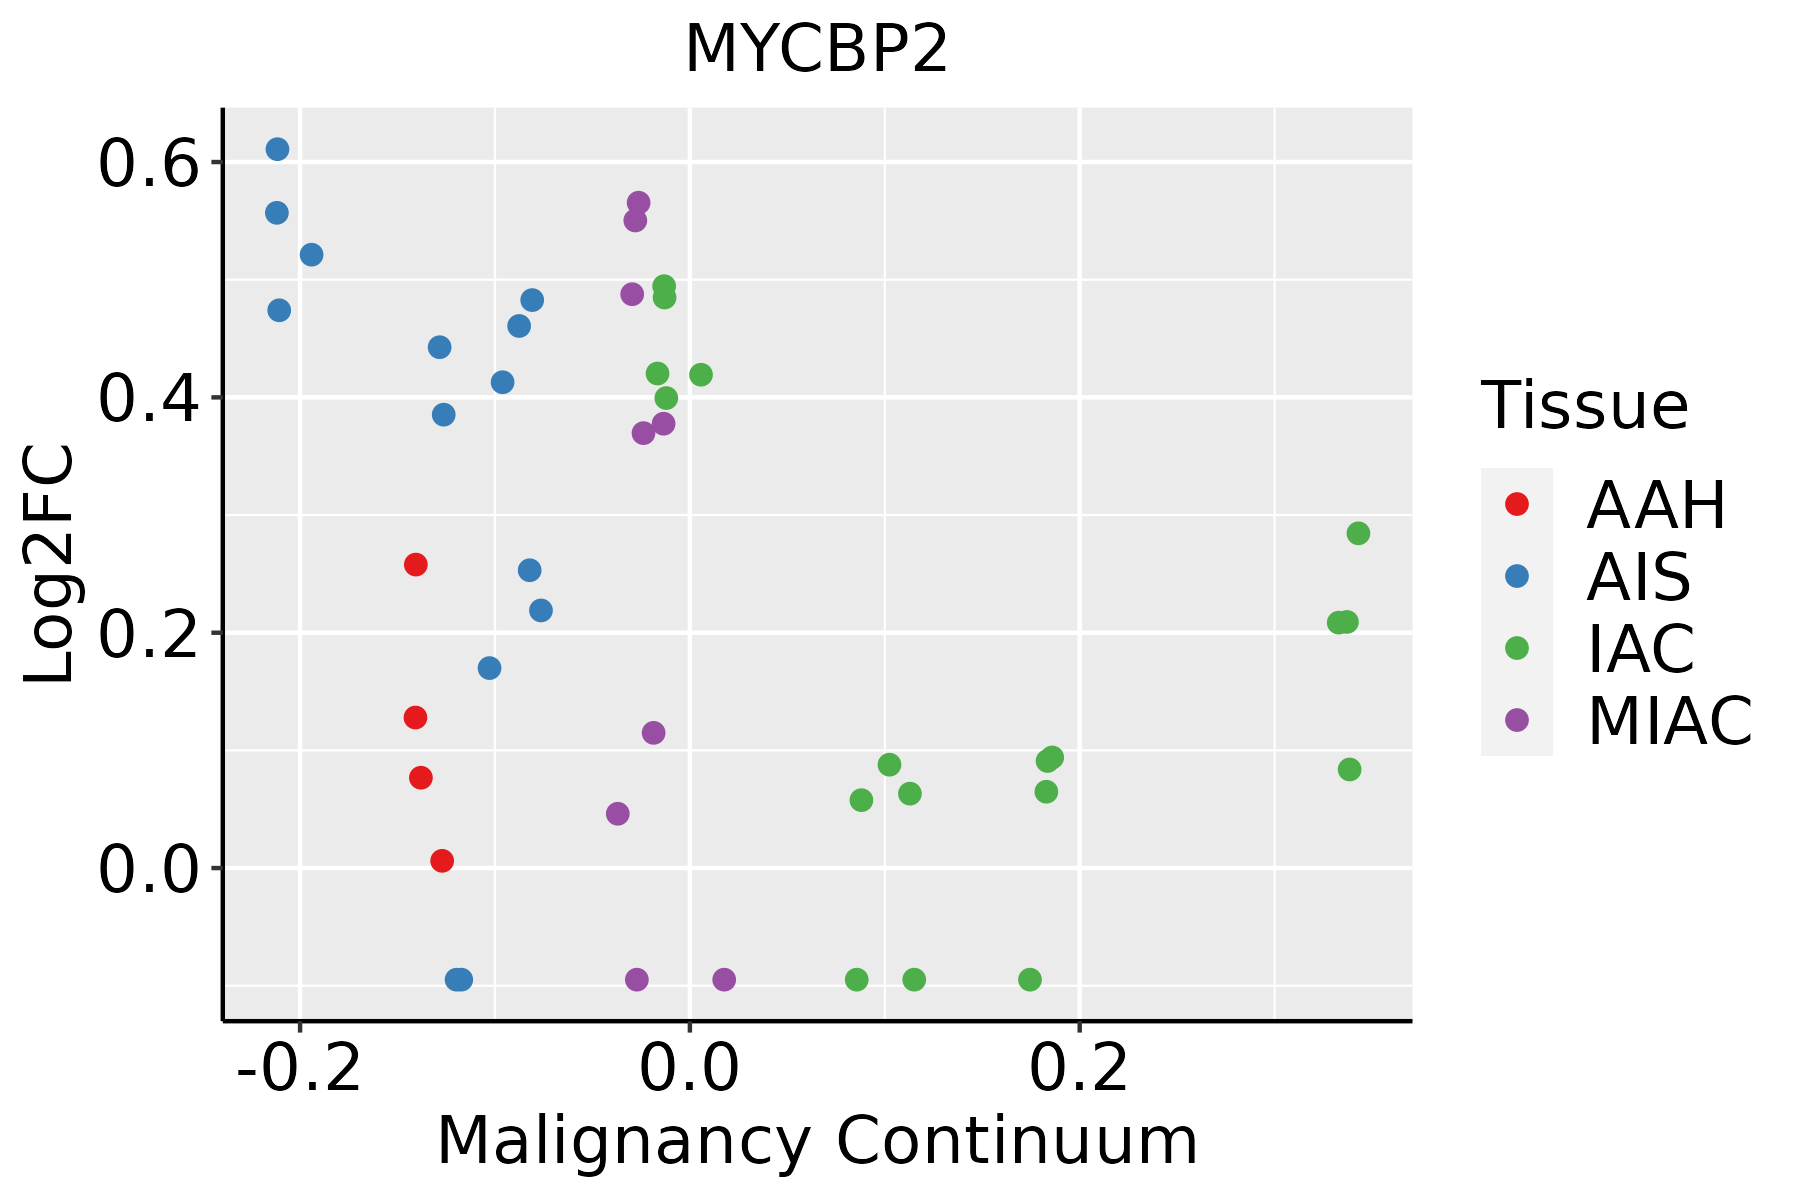 | AAH: Atypical adenomatous hyperplasia |
| AIS: Adenocarcinoma in situ |
| IAC: Invasive lung adenocarcinoma |
| MIA: Minimally invasive adenocarcinoma |
| Oral Cavity | 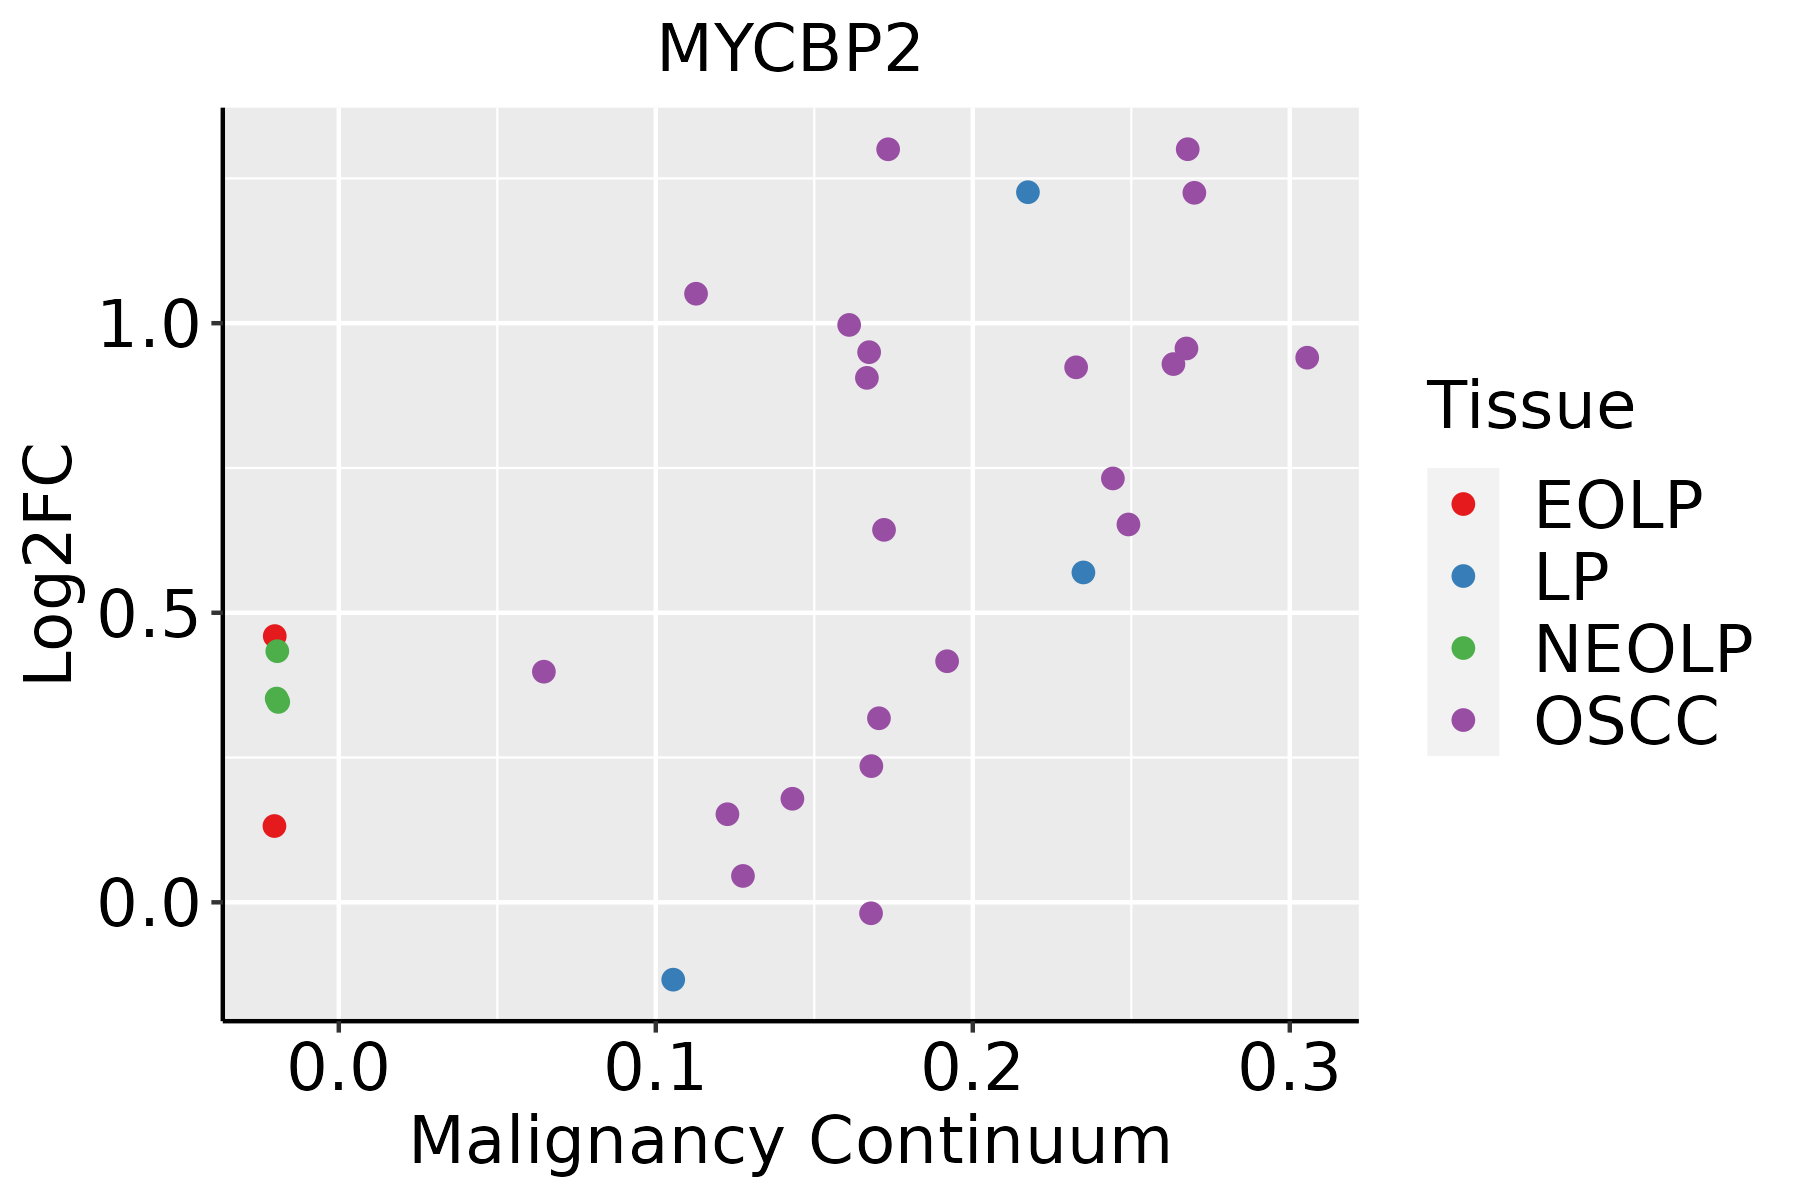 | EOLP: Erosive Oral lichen planus |
| LP: leukoplakia |
| NEOLP: Non-erosive oral lichen planus |
| OSCC: Oral squamous cell carcinoma |
| Prostate | 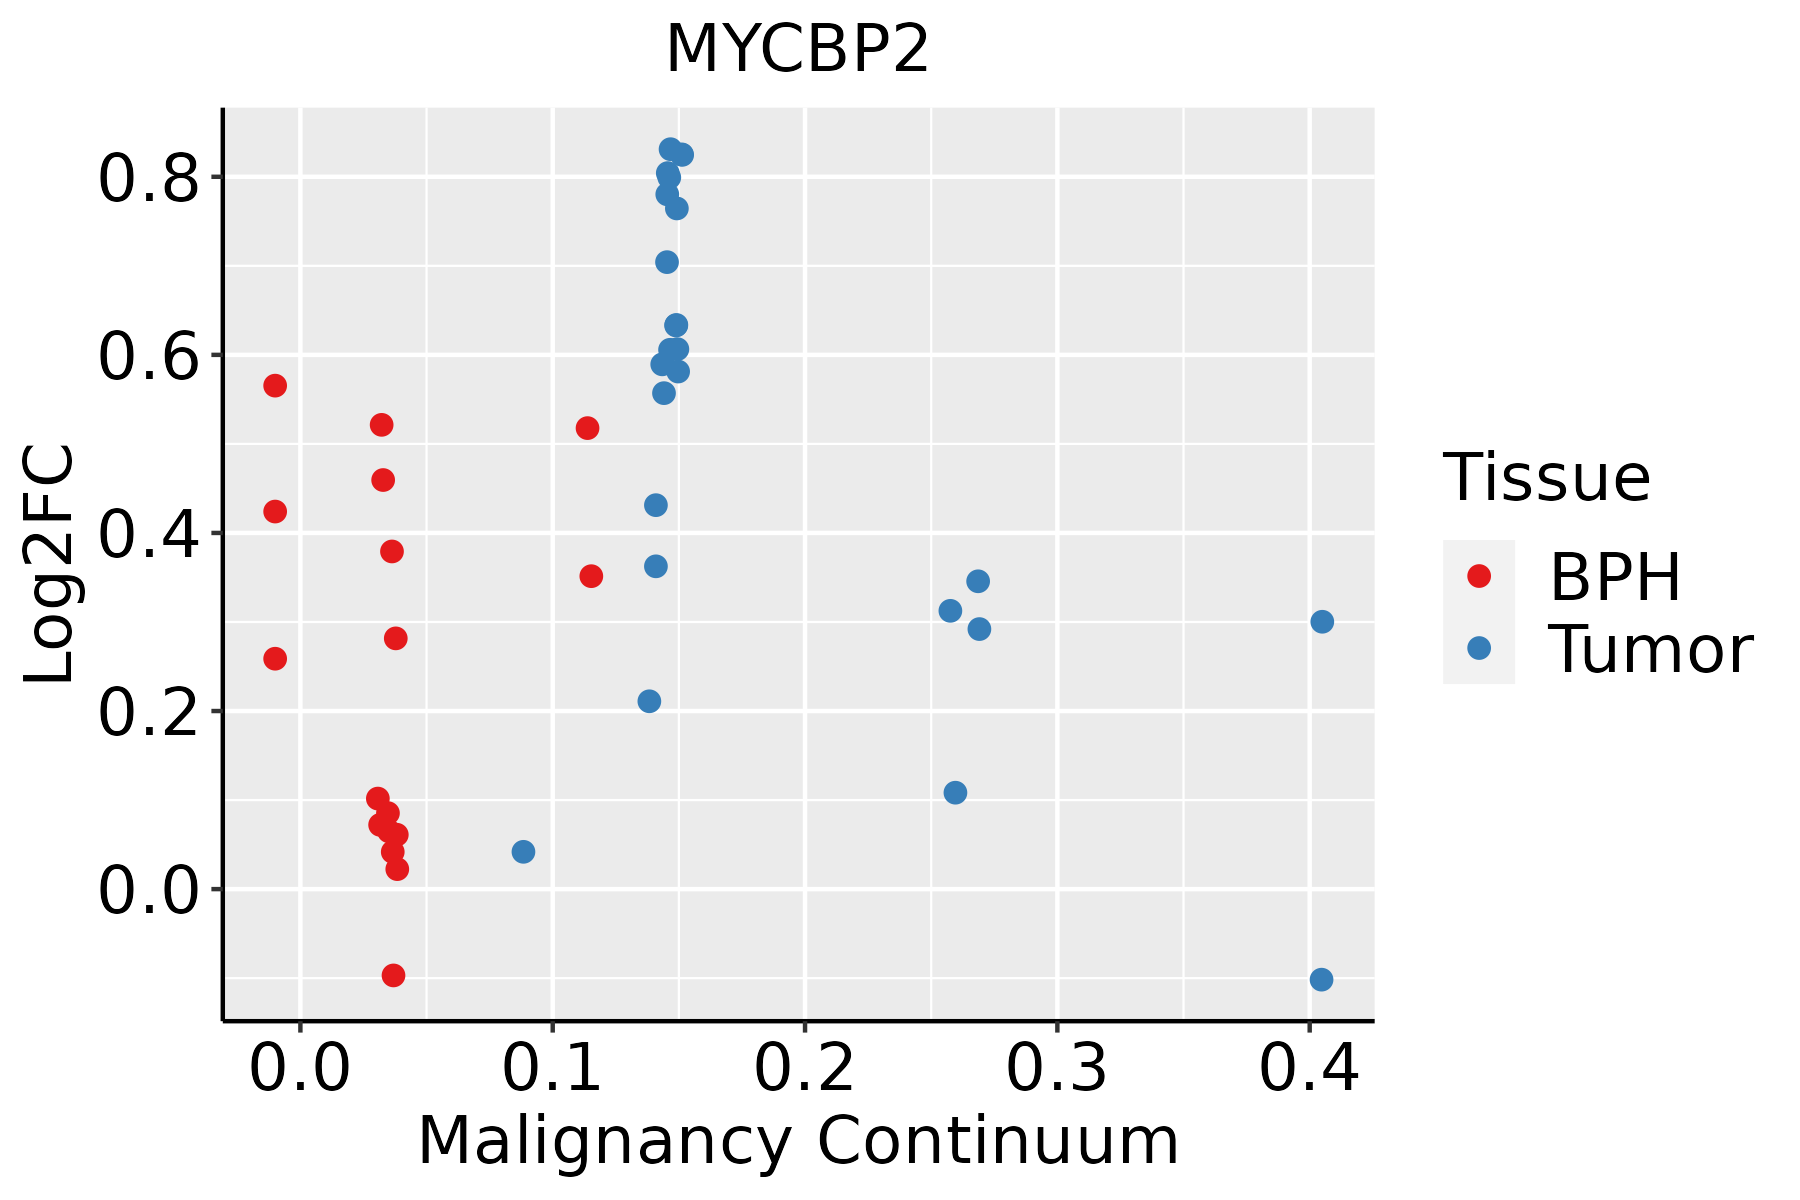 | BPH: Benign Prostatic Hyperplasia |
| Skin |  | AK: Actinic keratosis |
| cSCC: Cutaneous squamous cell carcinoma |
| SCCIS:squamous cell carcinoma in situ |
| Thyroid | 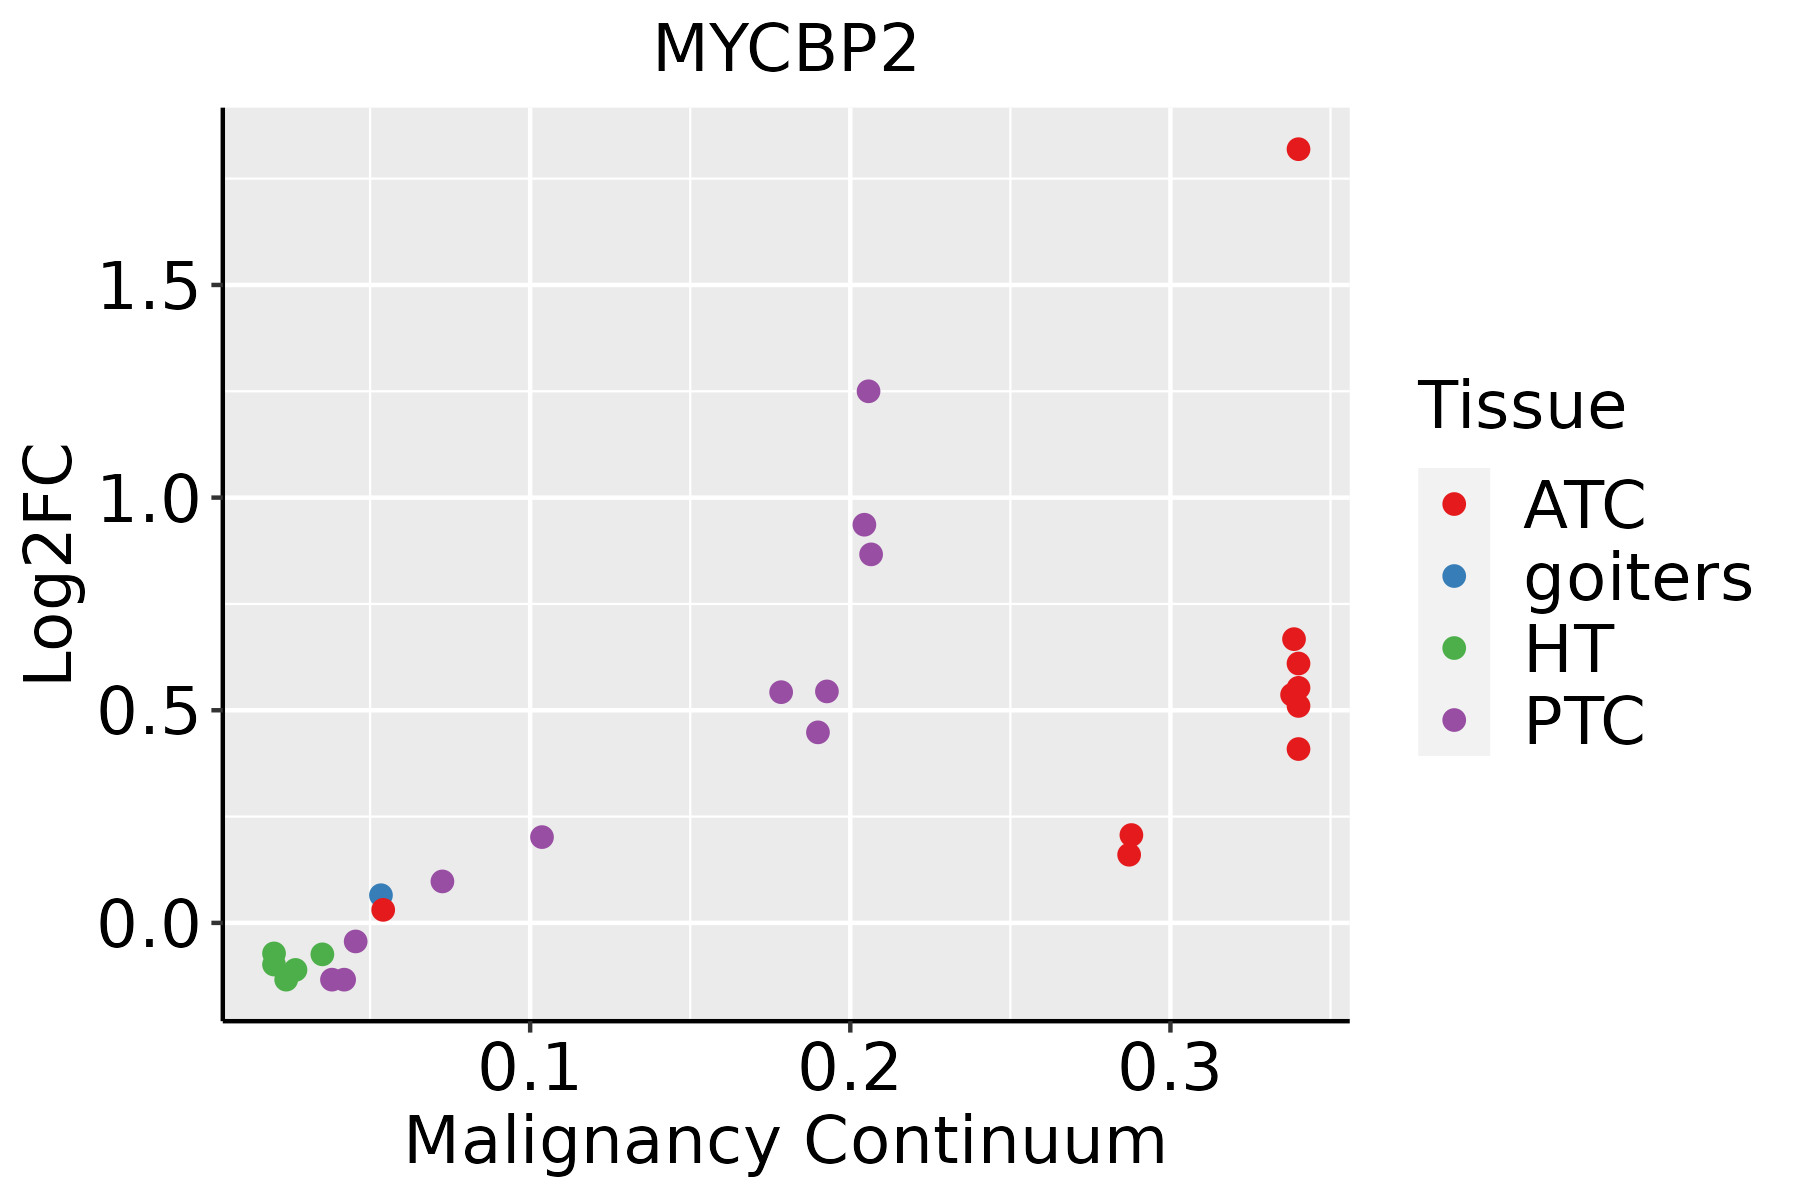 | ATC: Anaplastic thyroid cancer |
| HT: Hashimoto's thyroiditis |
| PTC: Papillary thyroid cancer |
| GO ID | Tissue | Disease Stage | Description | Gene Ratio | Bg Ratio | pvalue | p.adjust | Count |
| GO:004851112 | Lung | AIS | rhythmic process | 61/1849 | 298/18723 | 2.63e-08 | 3.40e-06 | 61 |
| GO:000762313 | Lung | AIS | circadian rhythm | 46/1849 | 210/18723 | 1.71e-07 | 1.72e-05 | 46 |
| GO:003139613 | Lung | AIS | regulation of protein ubiquitination | 46/1849 | 210/18723 | 1.71e-07 | 1.72e-05 | 46 |
| GO:003292211 | Lung | AIS | circadian regulation of gene expression | 21/1849 | 68/18723 | 1.33e-06 | 8.53e-05 | 21 |
| GO:000989513 | Lung | AIS | negative regulation of catabolic process | 55/1849 | 320/18723 | 3.22e-05 | 1.01e-03 | 55 |
| GO:004217713 | Lung | AIS | negative regulation of protein catabolic process | 26/1849 | 121/18723 | 1.09e-04 | 2.57e-03 | 26 |
| GO:000740911 | Lung | AIS | axonogenesis | 64/1849 | 418/18723 | 2.62e-04 | 5.04e-03 | 64 |
| GO:006156411 | Lung | AIS | axon development | 69/1849 | 467/18723 | 4.37e-04 | 7.41e-03 | 69 |
| GO:190332211 | Lung | AIS | positive regulation of protein modification by small protein conjugation or removal | 25/1849 | 138/18723 | 2.05e-03 | 2.26e-02 | 25 |
| GO:003139811 | Lung | AIS | positive regulation of protein ubiquitination | 22/1849 | 119/18723 | 2.85e-03 | 2.84e-02 | 22 |
| GO:002195511 | Lung | AIS | central nervous system neuron axonogenesis | 9/1849 | 35/18723 | 5.76e-03 | 4.81e-02 | 9 |
| GO:004217620 | Oral cavity | OSCC | regulation of protein catabolic process | 254/7305 | 391/18723 | 1.07e-25 | 3.22e-23 | 254 |
| GO:190332020 | Oral cavity | OSCC | regulation of protein modification by small protein conjugation or removal | 165/7305 | 242/18723 | 2.52e-20 | 3.99e-18 | 165 |
| GO:003139620 | Oral cavity | OSCC | regulation of protein ubiquitination | 143/7305 | 210/18723 | 1.01e-17 | 9.80e-16 | 143 |
| GO:000989519 | Oral cavity | OSCC | negative regulation of catabolic process | 180/7305 | 320/18723 | 2.44e-10 | 6.86e-09 | 180 |
| GO:19033227 | Oral cavity | OSCC | positive regulation of protein modification by small protein conjugation or removal | 88/7305 | 138/18723 | 3.24e-09 | 7.39e-08 | 88 |
| GO:004217719 | Oral cavity | OSCC | negative regulation of protein catabolic process | 77/7305 | 121/18723 | 3.49e-08 | 6.64e-07 | 77 |
| GO:00313986 | Oral cavity | OSCC | positive regulation of protein ubiquitination | 75/7305 | 119/18723 | 9.46e-08 | 1.65e-06 | 75 |
| GO:004851116 | Oral cavity | OSCC | rhythmic process | 157/7305 | 298/18723 | 1.00e-06 | 1.36e-05 | 157 |
| GO:000762316 | Oral cavity | OSCC | circadian rhythm | 110/7305 | 210/18723 | 5.40e-05 | 4.48e-04 | 110 |
| Hugo Symbol | Variant Class | Variant Classification | dbSNP RS | HGVSc | HGVSp | HGVSp Short | SWISSPROT | BIOTYPE | SIFT | PolyPhen | Tumor Sample Barcode | Tissue | Histology | Sex | Age | Stage | Therapy Types | Drugs | Outcome |
| MYCBP2 | SNV | Missense_Mutation | | c.8219A>T | p.Lys2740Met | p.K2740M | O75592 | protein_coding | deleterious_low_confidence(0) | probably_damaging(0.99) | TCGA-A1-A0SO-01 | Breast | breast invasive carcinoma | Female | >=65 | I/II | Chemotherapy | | SD |
| MYCBP2 | SNV | Missense_Mutation | | c.11849N>T | p.Trp3950Leu | p.W3950L | O75592 | protein_coding | deleterious(0) | probably_damaging(0.932) | TCGA-A2-A0CP-01 | Breast | breast invasive carcinoma | Female | <65 | I/II | Chemotherapy | cytoxan | SD |
| MYCBP2 | SNV | Missense_Mutation | rs150834693 | c.9229N>G | p.Ile3077Val | p.I3077V | O75592 | protein_coding | tolerated(0.57) | possibly_damaging(0.558) | TCGA-A8-A06P-01 | Breast | breast invasive carcinoma | Female | <65 | III/IV | Unspecific | | SD |
| MYCBP2 | SNV | Missense_Mutation | | c.10846C>T | p.His3616Tyr | p.H3616Y | O75592 | protein_coding | deleterious(0) | possibly_damaging(0.838) | TCGA-A8-A095-01 | Breast | breast invasive carcinoma | Female | <65 | I/II | Chemotherapy | 5-fluorouracil | CR |
| MYCBP2 | SNV | Missense_Mutation | | c.11147C>T | p.Pro3716Leu | p.P3716L | O75592 | protein_coding | deleterious(0.01) | probably_damaging(0.987) | TCGA-A8-A09Z-01 | Breast | breast invasive carcinoma | Female | >=65 | I/II | Unknown | Unknown | SD |
| MYCBP2 | SNV | Missense_Mutation | | c.8154N>C | p.Lys2718Asn | p.K2718N | O75592 | protein_coding | tolerated(0.25) | benign(0.04) | TCGA-AC-A23H-01 | Breast | breast invasive carcinoma | Female | >=65 | I/II | Unknown | Unknown | PD |
| MYCBP2 | SNV | Missense_Mutation | | c.7918N>C | p.Asp2640His | p.D2640H | O75592 | protein_coding | deleterious(0.01) | possibly_damaging(0.674) | TCGA-AC-A23H-01 | Breast | breast invasive carcinoma | Female | >=65 | I/II | Unknown | Unknown | PD |
| MYCBP2 | SNV | Missense_Mutation | | c.3984N>C | p.Lys1328Asn | p.K1328N | O75592 | protein_coding | deleterious(0.02) | probably_damaging(0.99) | TCGA-AC-A23H-01 | Breast | breast invasive carcinoma | Female | >=65 | I/II | Unknown | Unknown | PD |
| MYCBP2 | SNV | Missense_Mutation | rs770147270 | c.6037N>A | p.Glu2013Lys | p.E2013K | O75592 | protein_coding | deleterious(0) | probably_damaging(0.935) | TCGA-AN-A046-01 | Breast | breast invasive carcinoma | Female | >=65 | I/II | Unknown | Unknown | SD |
| MYCBP2 | SNV | Missense_Mutation | novel | c.2920N>A | p.Val974Ile | p.V974I | O75592 | protein_coding | tolerated(0.1) | possibly_damaging(0.846) | TCGA-AN-A046-01 | Breast | breast invasive carcinoma | Female | >=65 | I/II | Unknown | Unknown | SD |


