
|
|||||
|
 | |
| |
| |
| |
| |
| |
|
Gene: MIA3 |
Gene summary for MIA3 |
| Gene information | Species | Human | Gene symbol | MIA3 | Gene ID | 375056 |
| Gene name | MIA SH3 domain ER export factor 3 | |
| Gene Alias | ARNT | |
| Cytomap | 1q41 | |
| Gene Type | protein-coding | GO ID | GO:0001525 | UniProtAcc | Q5JRA6 |
Top |
Malignant transformation analysis |
| Identification of the aberrant gene expression in precancerous and cancerous lesions by comparing the gene expression of stem-like cells in diseased tissues with normal stem cells |
| Entrez ID | Symbol | Replicates | Species | Organ | Tissue | Adj P-value | Log2FC | Malignancy |
| 375056 | MIA3 | LZE2T | Human | Esophagus | ESCC | 5.15e-10 | 6.99e-01 | 0.082 |
| 375056 | MIA3 | LZE4T | Human | Esophagus | ESCC | 5.61e-15 | 4.75e-01 | 0.0811 |
| 375056 | MIA3 | LZE5T | Human | Esophagus | ESCC | 3.25e-05 | 5.34e-01 | 0.0514 |
| 375056 | MIA3 | LZE7T | Human | Esophagus | ESCC | 7.83e-12 | 6.69e-01 | 0.0667 |
| 375056 | MIA3 | LZE20T | Human | Esophagus | ESCC | 7.03e-08 | 2.04e-01 | 0.0662 |
| 375056 | MIA3 | LZE22D1 | Human | Esophagus | HGIN | 6.09e-03 | 8.30e-02 | 0.0595 |
| 375056 | MIA3 | LZE22T | Human | Esophagus | ESCC | 1.58e-05 | 5.56e-01 | 0.068 |
| 375056 | MIA3 | LZE24T | Human | Esophagus | ESCC | 1.06e-21 | 6.70e-01 | 0.0596 |
| 375056 | MIA3 | LZE6T | Human | Esophagus | ESCC | 4.92e-03 | 2.37e-01 | 0.0845 |
| 375056 | MIA3 | P1T-E | Human | Esophagus | ESCC | 2.91e-20 | 7.80e-01 | 0.0875 |
| 375056 | MIA3 | P2T-E | Human | Esophagus | ESCC | 1.37e-44 | 8.44e-01 | 0.1177 |
| 375056 | MIA3 | P4T-E | Human | Esophagus | ESCC | 1.47e-11 | 3.95e-01 | 0.1323 |
| 375056 | MIA3 | P5T-E | Human | Esophagus | ESCC | 2.35e-20 | 3.02e-01 | 0.1327 |
| 375056 | MIA3 | P8T-E | Human | Esophagus | ESCC | 1.32e-23 | 4.53e-01 | 0.0889 |
| 375056 | MIA3 | P9T-E | Human | Esophagus | ESCC | 6.11e-15 | 3.93e-01 | 0.1131 |
| 375056 | MIA3 | P10T-E | Human | Esophagus | ESCC | 1.90e-30 | 5.58e-01 | 0.116 |
| 375056 | MIA3 | P11T-E | Human | Esophagus | ESCC | 4.21e-19 | 6.70e-01 | 0.1426 |
| 375056 | MIA3 | P12T-E | Human | Esophagus | ESCC | 1.13e-18 | 3.74e-01 | 0.1122 |
| 375056 | MIA3 | P15T-E | Human | Esophagus | ESCC | 1.79e-23 | 5.28e-01 | 0.1149 |
| 375056 | MIA3 | P16T-E | Human | Esophagus | ESCC | 3.00e-24 | 5.53e-01 | 0.1153 |
| Page: 1 2 3 4 5 6 7 |
| Tissue | Expression Dynamics | Abbreviation |
| Esophagus | 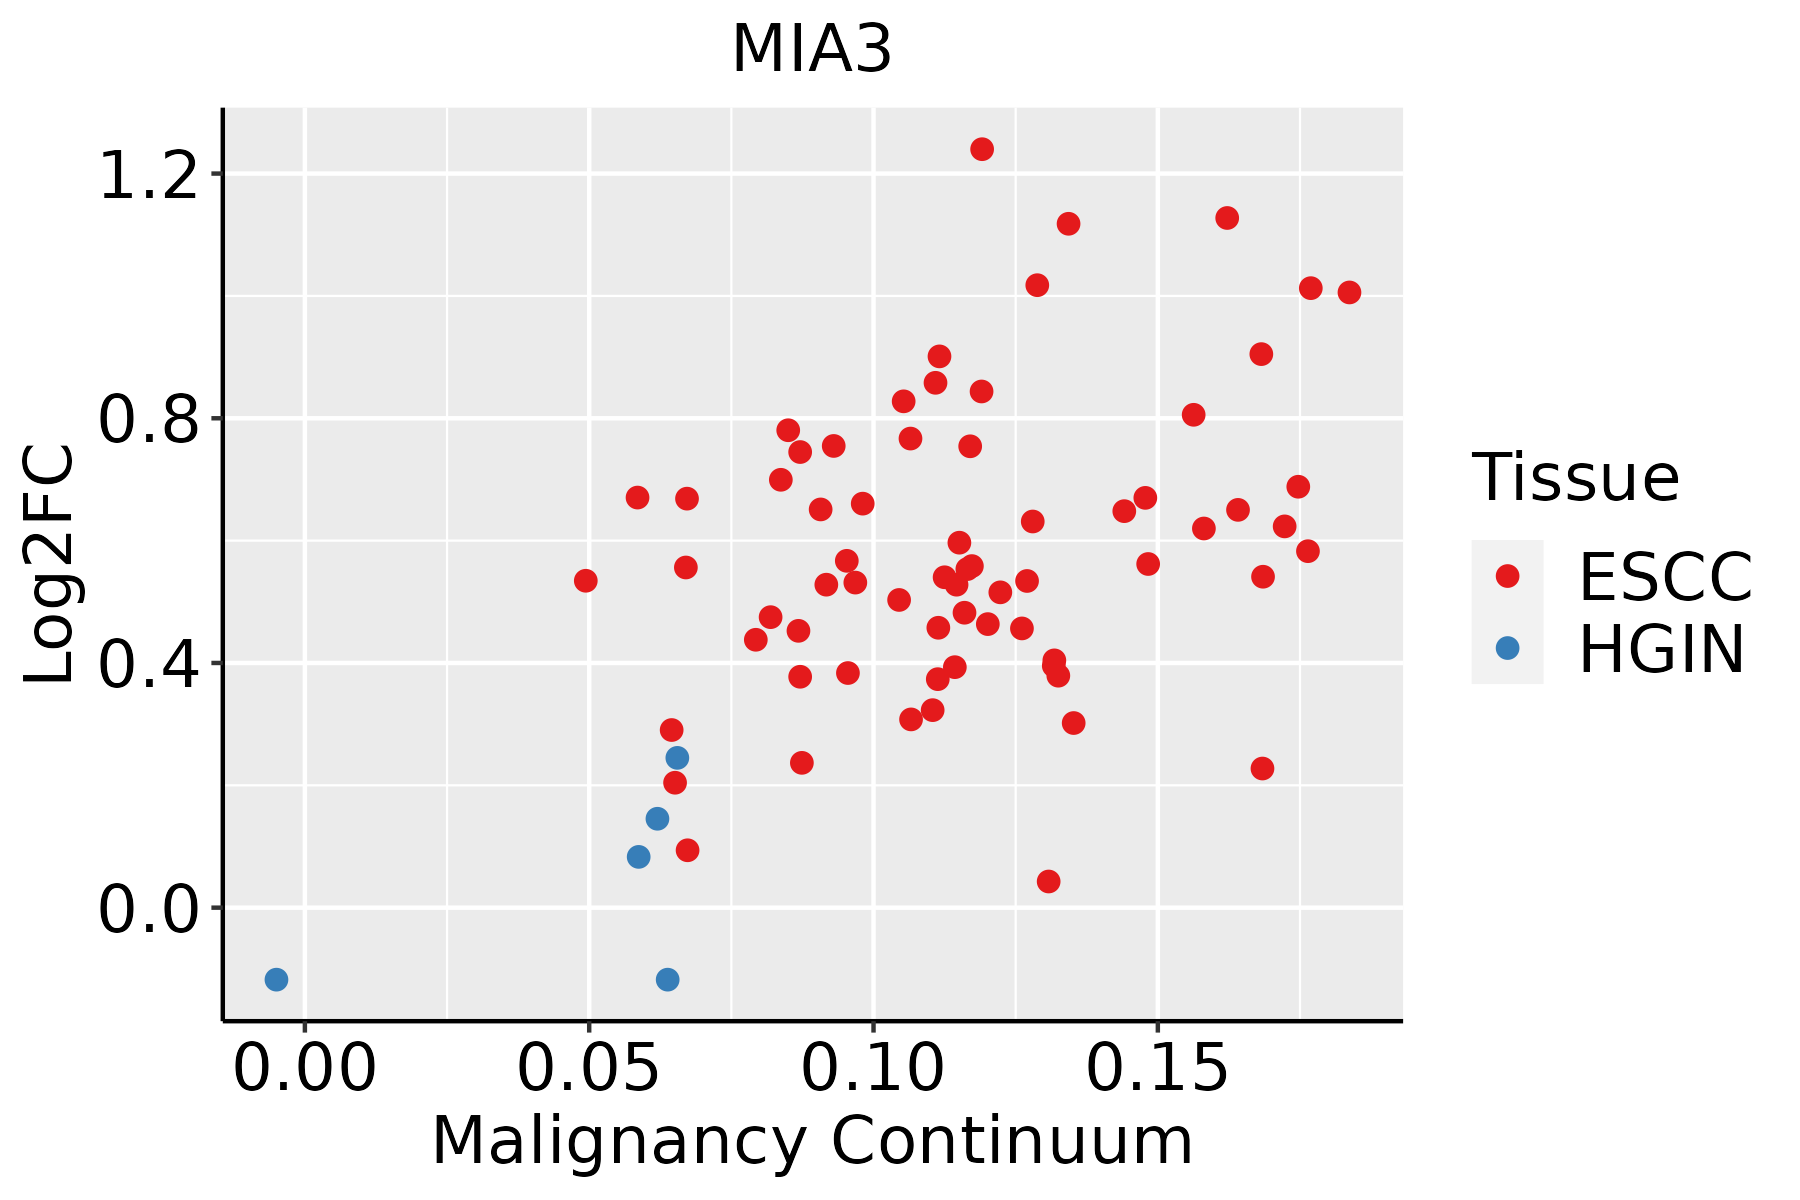 | ESCC: Esophageal squamous cell carcinoma |
| HGIN: High-grade intraepithelial neoplasias | ||
| LGIN: Low-grade intraepithelial neoplasias | ||
| Liver | 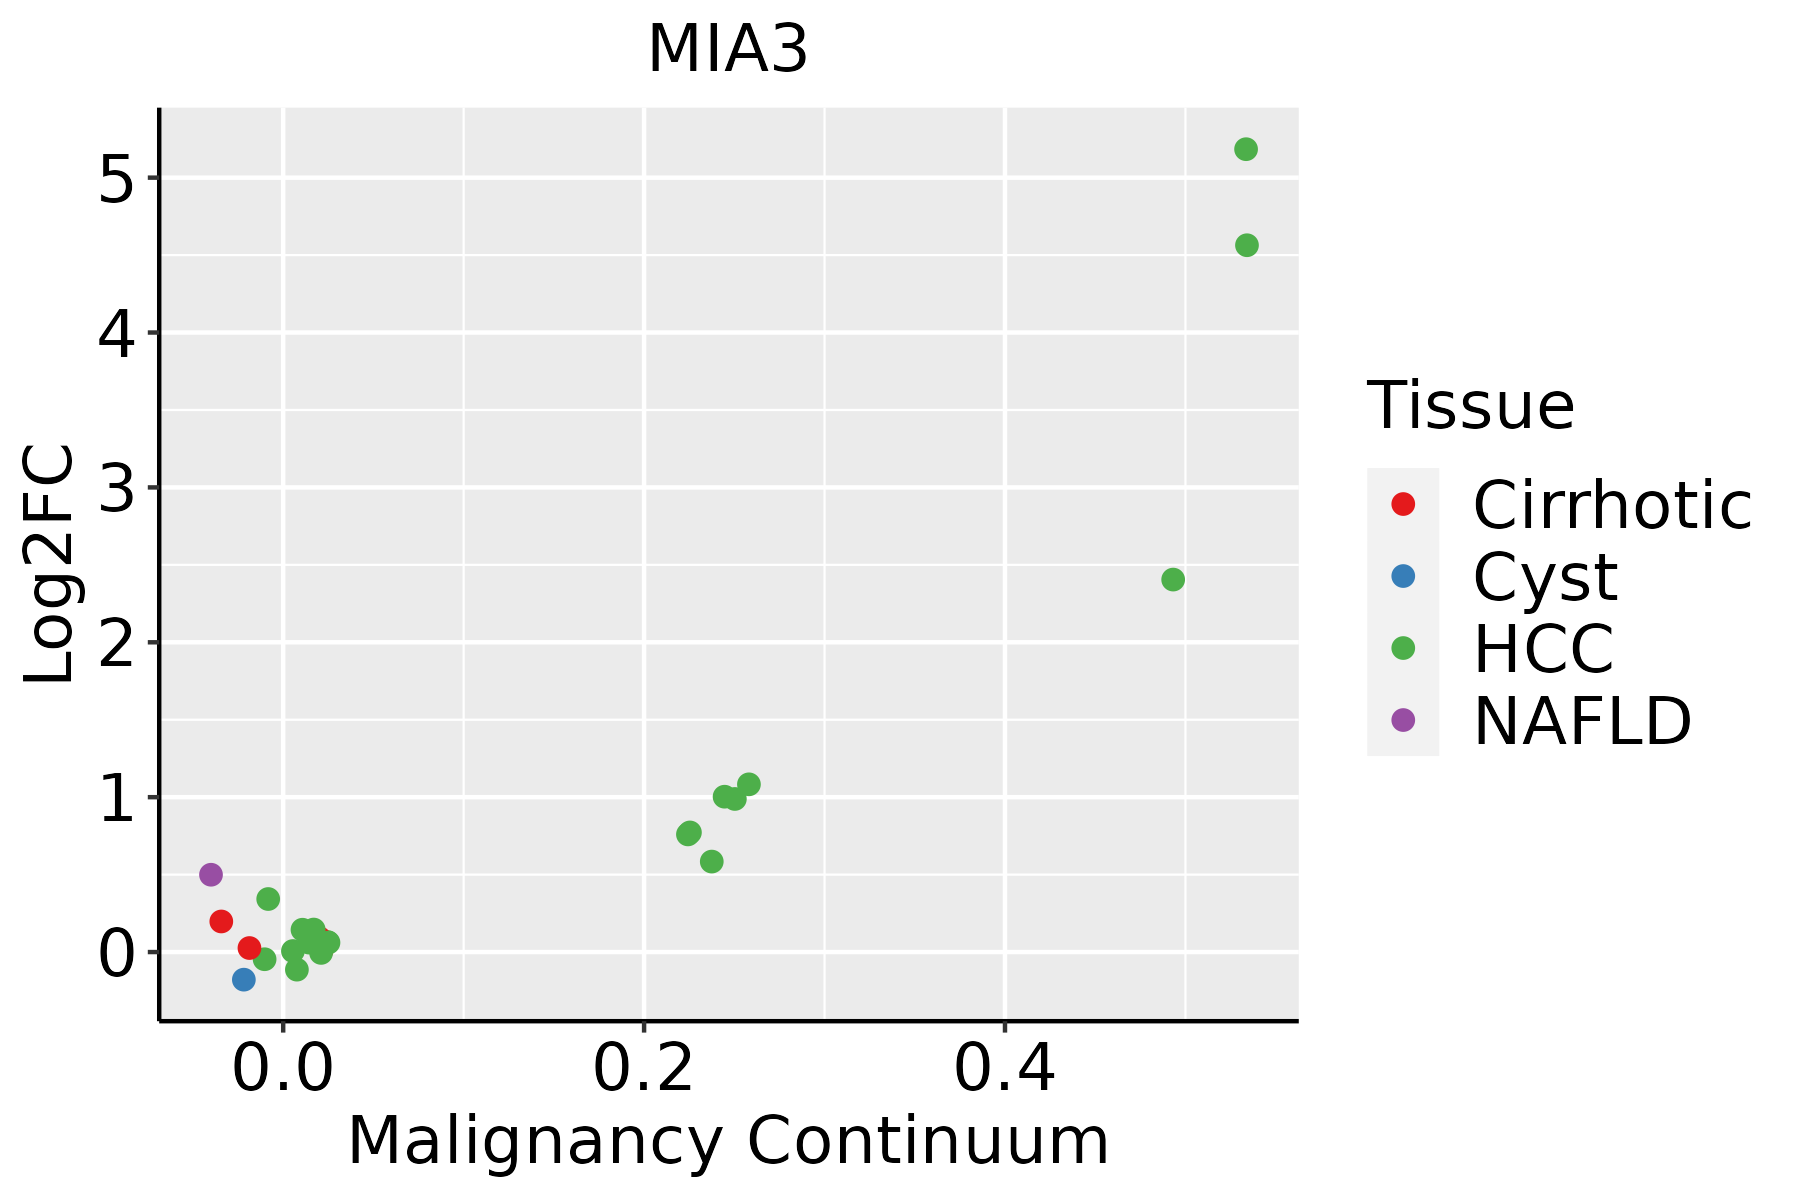 | HCC: Hepatocellular carcinoma |
| NAFLD: Non-alcoholic fatty liver disease | ||
| Oral Cavity | 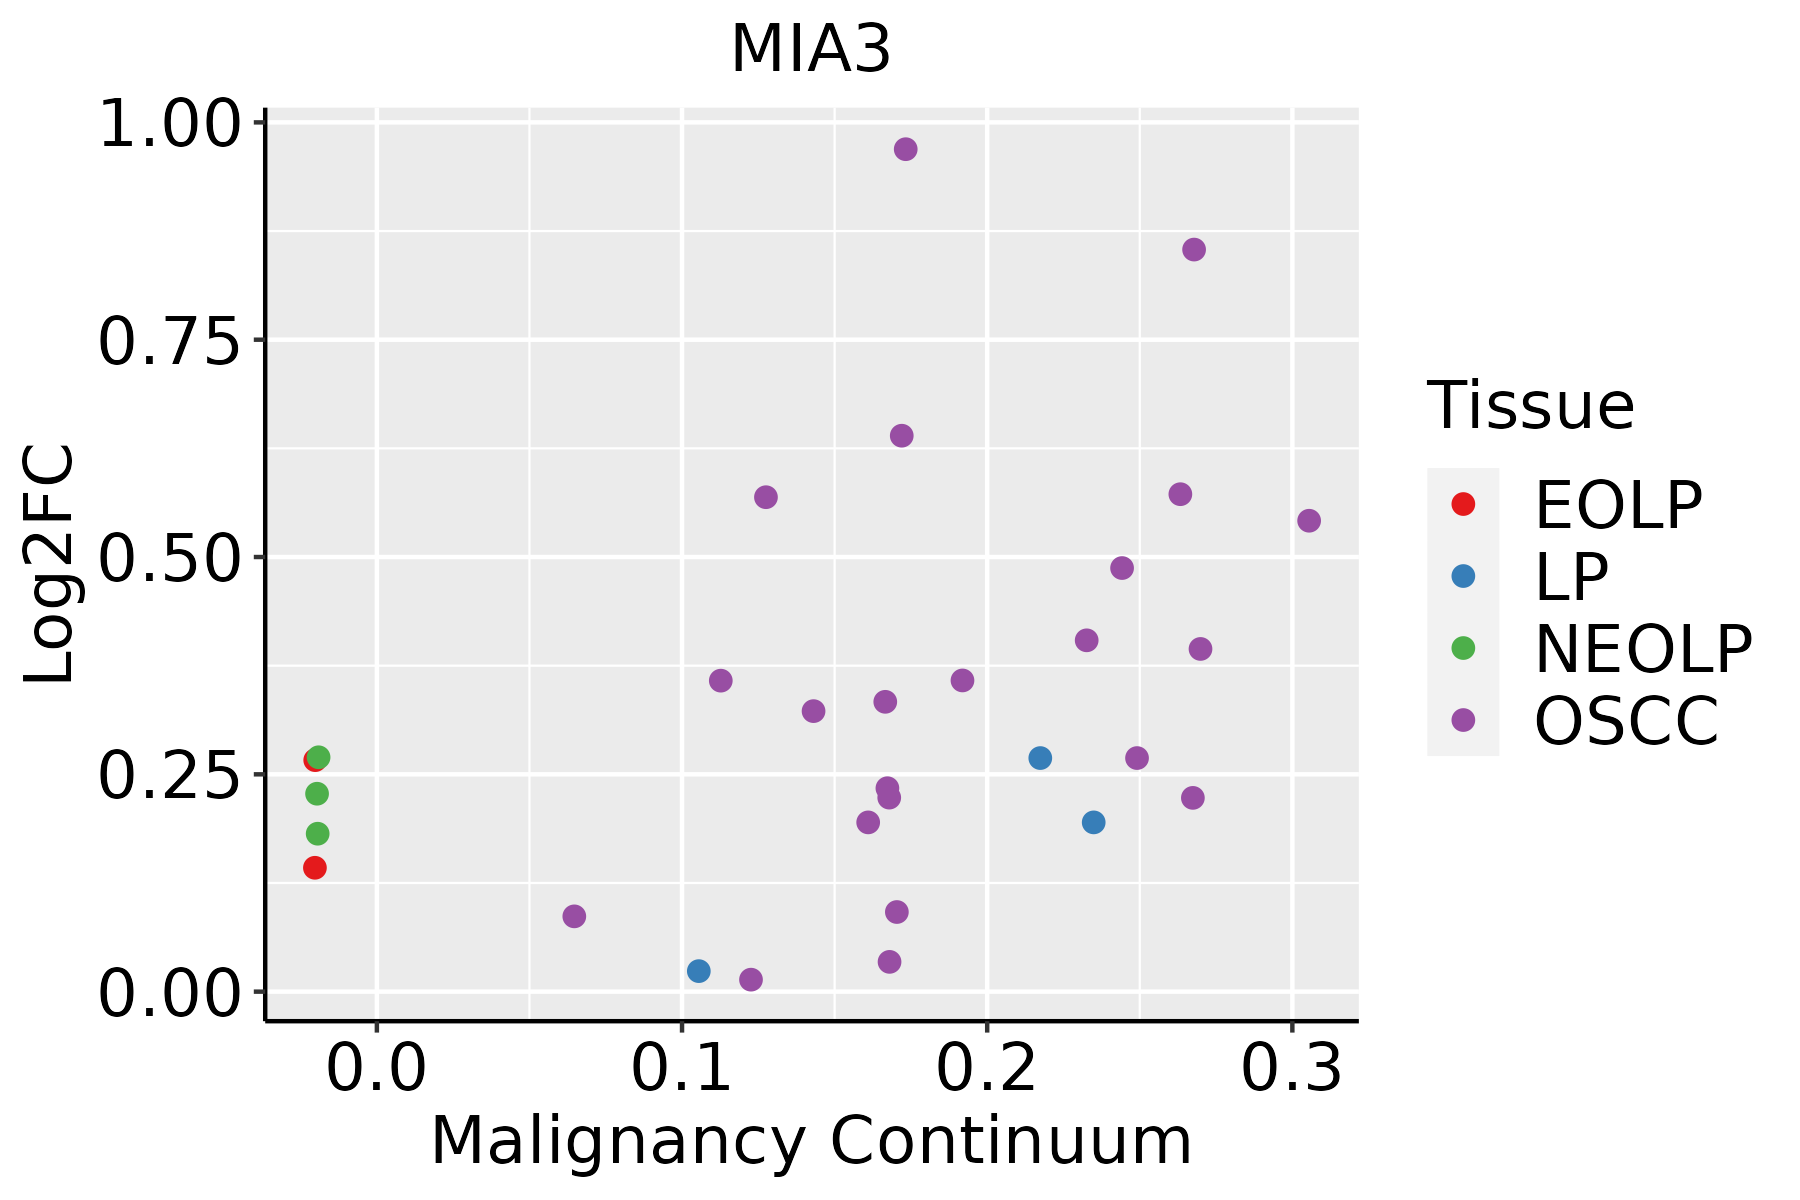 | EOLP: Erosive Oral lichen planus |
| LP: leukoplakia | ||
| NEOLP: Non-erosive oral lichen planus | ||
| OSCC: Oral squamous cell carcinoma | ||
| Prostate |  | BPH: Benign Prostatic Hyperplasia |
| Thyroid | 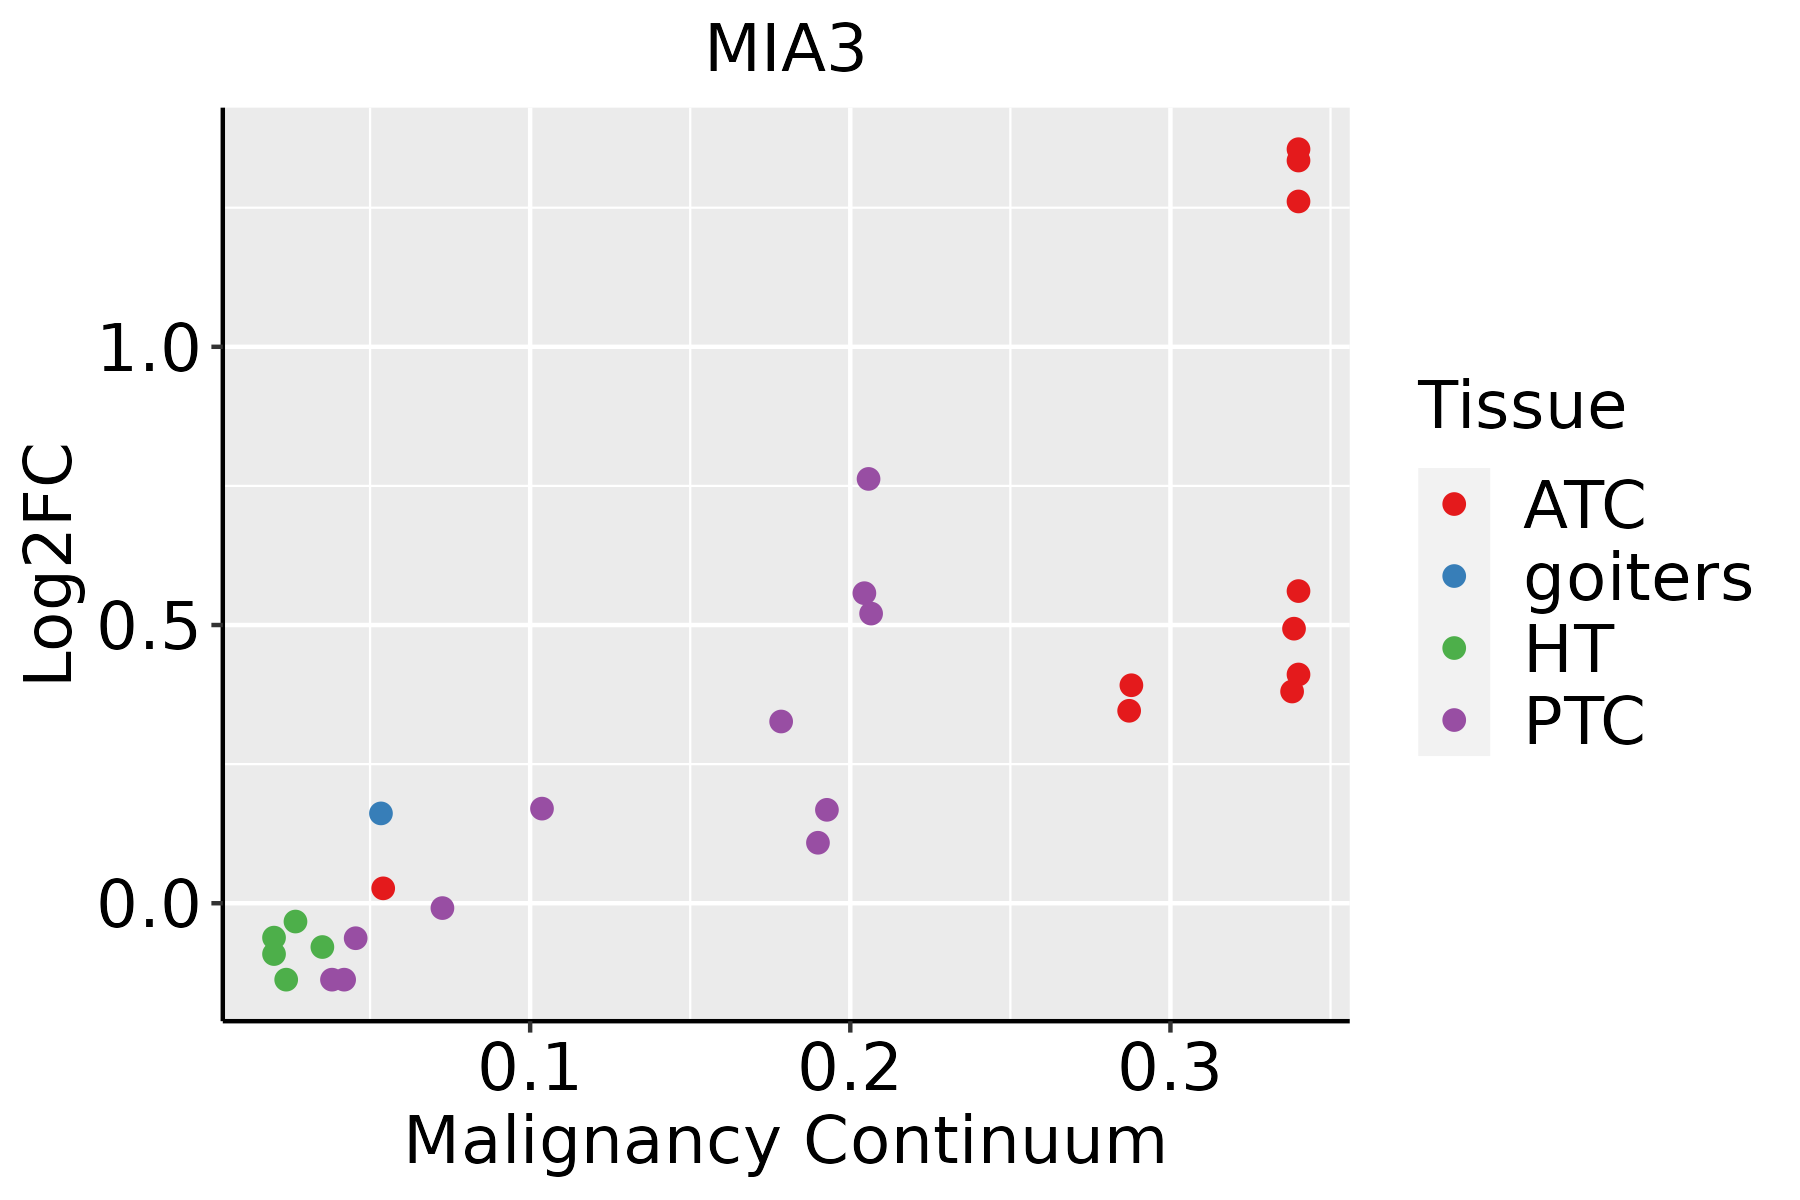 | ATC: Anaplastic thyroid cancer |
| HT: Hashimoto's thyroiditis | ||
| PTC: Papillary thyroid cancer |
| ∗log2FC in expression of this searched gene in stem-like cells from each diseased tissue sample relative to stem-like cells in normal samples in each tissue plotted against the malignancy continuum. Samples are colored based on if they are from different disease stage. |
Top |
Malignant transformation related pathway analysis |
| Find out the enriched GO biological processes and KEGG pathways involved in transition from healthy to precancer to cancer |
| Tissue | Disease Stage | Enriched GO biological Processes |
| Colorectum | AD |  |
| Colorectum | SER |  |
| Colorectum | MSS |  |
| Colorectum | MSI-H |  |
| Colorectum | FAP |  |
| ∗Top 15 enriched GO BP terms are showed in the bar plot of each disease state in each tissue. Each row represents a significant GO biological process which is colored according to the -log10(p.adjust). |
| Page: 1 2 3 4 5 6 7 8 9 |
| GO ID | Tissue | Disease Stage | Description | Gene Ratio | Bg Ratio | pvalue | p.adjust | Count |
| GO:000715923 | Oral cavity | NEOLP | leukocyte cell-cell adhesion | 70/2005 | 371/18723 | 1.65e-06 | 4.05e-05 | 70 |
| GO:200014615 | Oral cavity | NEOLP | negative regulation of cell motility | 68/2005 | 359/18723 | 2.01e-06 | 4.77e-05 | 68 |
| GO:003033614 | Oral cavity | NEOLP | negative regulation of cell migration | 65/2005 | 344/18723 | 3.65e-06 | 7.97e-05 | 65 |
| GO:004354215 | Oral cavity | NEOLP | endothelial cell migration | 55/2005 | 279/18723 | 5.51e-06 | 1.13e-04 | 55 |
| GO:005090023 | Oral cavity | NEOLP | leukocyte migration | 67/2005 | 369/18723 | 1.04e-05 | 1.96e-04 | 67 |
| GO:000690031 | Oral cavity | NEOLP | vesicle budding from membrane | 19/2005 | 61/18723 | 1.19e-05 | 2.17e-04 | 19 |
| GO:000716223 | Oral cavity | NEOLP | negative regulation of cell adhesion | 57/2005 | 303/18723 | 1.62e-05 | 2.79e-04 | 57 |
| GO:004001314 | Oral cavity | NEOLP | negative regulation of locomotion | 69/2005 | 391/18723 | 2.05e-05 | 3.41e-04 | 69 |
| GO:190303723 | Oral cavity | NEOLP | regulation of leukocyte cell-cell adhesion | 61/2005 | 336/18723 | 2.56e-05 | 4.01e-04 | 61 |
| GO:000268331 | Oral cavity | NEOLP | negative regulation of immune system process | 73/2005 | 434/18723 | 6.18e-05 | 8.22e-04 | 73 |
| GO:000268523 | Oral cavity | NEOLP | regulation of leukocyte migration | 40/2005 | 210/18723 | 2.14e-04 | 2.27e-03 | 40 |
| GO:001605031 | Oral cavity | NEOLP | vesicle organization | 52/2005 | 300/18723 | 3.20e-04 | 3.11e-03 | 52 |
| GO:000268723 | Oral cavity | NEOLP | positive regulation of leukocyte migration | 28/2005 | 135/18723 | 4.45e-04 | 4.01e-03 | 28 |
| GO:007167514 | Oral cavity | NEOLP | regulation of mononuclear cell migration | 24/2005 | 115/18723 | 1.00e-03 | 7.68e-03 | 24 |
| GO:003545912 | Oral cavity | NEOLP | vesicle cargo loading | 9/2005 | 27/18723 | 1.41e-03 | 1.01e-02 | 9 |
| GO:004353413 | Oral cavity | NEOLP | blood vessel endothelial cell migration | 32/2005 | 176/18723 | 1.93e-03 | 1.30e-02 | 32 |
| GO:009011431 | Oral cavity | NEOLP | COPII-coated vesicle budding | 9/2005 | 29/18723 | 2.48e-03 | 1.57e-02 | 9 |
| GO:00716747 | Oral cavity | NEOLP | mononuclear cell migration | 34/2005 | 196/18723 | 3.17e-03 | 1.91e-02 | 34 |
| GO:009011021 | Oral cavity | NEOLP | COPII-coated vesicle cargo loading | 6/2005 | 15/18723 | 3.18e-03 | 1.91e-02 | 6 |
| GO:0002040 | Oral cavity | NEOLP | sprouting angiogenesis | 32/2005 | 185/18723 | 4.29e-03 | 2.42e-02 | 32 |
| Page: 1 2 3 4 5 6 7 8 9 10 11 12 13 14 |
| Pathway ID | Tissue | Disease Stage | Description | Gene Ratio | Bg Ratio | pvalue | p.adjust | qvalue | Count |
| Page: 1 |
Top |
Cell-cell communication analysis |
| Identification of potential cell-cell interactions between two cell types and their ligand-receptor pairs for different disease states |
| Ligand | Receptor | LRpair | Pathway | Tissue | Disease Stage |
| Page: 1 |
Top |
Single-cell gene regulatory network inference analysis |
| Find out the significant the regulons (TFs) and the target genes of each regulon across cell types for different disease states |
| TF | Cell Type | Tissue | Disease Stage | Target Gene | RSS | Regulon Activity |
| ∗The dot plots of a searched regulon are shown for all cell subpopulations in each disease state of each tissue based on the regulon specific score inferred using pySCENIC and by calculating the average expression. |
| Page: 1 |
Top |
Somatic mutation of malignant transformation related genes |
| Annotation of somatic variants for genes involved in malignant transformation |
| Hugo Symbol | Variant Class | Variant Classification | dbSNP RS | HGVSc | HGVSp | HGVSp Short | SWISSPROT | BIOTYPE | SIFT | PolyPhen | Tumor Sample Barcode | Tissue | Histology | Sex | Age | Stage | Therapy Types | Drugs | Outcome |
| MIA3 | SNV | Missense_Mutation | c.1863N>T | p.Glu621Asp | p.E621D | Q5JRA6 | protein_coding | tolerated(0.12) | benign(0.007) | TCGA-A8-A06X-01 | Breast | breast invasive carcinoma | Female | >=65 | I/II | Unknown | Unknown | SD | |
| MIA3 | SNV | Missense_Mutation | c.3776C>G | p.Ser1259Cys | p.S1259C | Q5JRA6 | protein_coding | deleterious(0.03) | probably_damaging(0.94) | TCGA-AC-A23H-01 | Breast | breast invasive carcinoma | Female | >=65 | I/II | Unknown | Unknown | PD | |
| MIA3 | SNV | Missense_Mutation | novel | c.2476N>C | p.Glu826Gln | p.E826Q | Q5JRA6 | protein_coding | tolerated(0.13) | benign(0.131) | TCGA-AC-A5XS-01 | Breast | breast invasive carcinoma | Female | >=65 | I/II | Hormone Therapy | femara | SD |
| MIA3 | SNV | Missense_Mutation | novel | c.3970N>A | p.Glu1324Lys | p.E1324K | Q5JRA6 | protein_coding | deleterious(0) | probably_damaging(0.998) | TCGA-AC-A5XS-01 | Breast | breast invasive carcinoma | Female | >=65 | I/II | Hormone Therapy | femara | SD |
| MIA3 | SNV | Missense_Mutation | c.1836N>T | p.Glu612Asp | p.E612D | Q5JRA6 | protein_coding | tolerated(0.12) | possibly_damaging(0.681) | TCGA-AN-A0AK-01 | Breast | breast invasive carcinoma | Female | >=65 | I/II | Unknown | Unknown | SD | |
| MIA3 | SNV | Missense_Mutation | rs199732400 | c.1159A>G | p.Ile387Val | p.I387V | Q5JRA6 | protein_coding | tolerated(0.57) | benign(0) | TCGA-B6-A2IU-01 | Breast | breast invasive carcinoma | Female | <65 | I/II | Unknown | Unknown | PD |
| MIA3 | SNV | Missense_Mutation | c.4900G>A | p.Ala1634Thr | p.A1634T | Q5JRA6 | protein_coding | tolerated(0.05) | possibly_damaging(0.802) | TCGA-BH-A18G-01 | Breast | breast invasive carcinoma | Female | >=65 | I/II | Unknown | Unknown | SD | |
| MIA3 | SNV | Missense_Mutation | c.3496N>C | p.Asp1166His | p.D1166H | Q5JRA6 | protein_coding | deleterious(0) | possibly_damaging(0.907) | TCGA-BH-A18Q-01 | Breast | breast invasive carcinoma | Female | <65 | I/II | Unknown | Unknown | SD | |
| MIA3 | SNV | Missense_Mutation | c.815N>G | p.Thr272Ser | p.T272S | Q5JRA6 | protein_coding | tolerated(0.38) | benign(0.031) | TCGA-BH-A1FU-01 | Breast | breast invasive carcinoma | Female | <65 | I/II | Unknown | Unknown | PD | |
| MIA3 | SNV | Missense_Mutation | c.1276G>A | p.Gly426Arg | p.G426R | Q5JRA6 | protein_coding | tolerated(0.48) | benign(0.009) | TCGA-C8-A131-01 | Breast | breast invasive carcinoma | Female | >=65 | III/IV | Chemotherapy | 5-fluorouracil | CR |
| Page: 1 2 3 4 5 6 7 8 9 10 11 12 13 14 15 16 17 18 19 20 21 22 23 24 |
Top |
Related drugs of malignant transformation related genes |
| Identification of chemicals and drugs interact with genes involved in malignant transfromation |
| (DGIdb 4.0) |
| Entrez ID | Symbol | Category | Interaction Types | Drug Claim Name | Drug Name | PMIDs |
| Page: 1 |

Copyright 2023-Present -The University of Texas Health Science Center at Houston |