
|
|||||
|
 | |
| |
| |
| |
| |
| |
|
Gene: MBNL1 |
Gene summary for MBNL1 |
| Gene information | Species | Human | Gene symbol | MBNL1 | Gene ID | 4154 |
| Gene name | muscleblind like splicing regulator 1 | |
| Gene Alias | EXP | |
| Cytomap | 3q25.1-q25.2 | |
| Gene Type | protein-coding | GO ID | GO:0000375 | UniProtAcc | Q86VM6 |
Top |
Malignant transformation analysis |
| Identification of the aberrant gene expression in precancerous and cancerous lesions by comparing the gene expression of stem-like cells in diseased tissues with normal stem cells |
| Entrez ID | Symbol | Replicates | Species | Organ | Tissue | Adj P-value | Log2FC | Malignancy |
| 4154 | MBNL1 | CA_HPV_1 | Human | Cervix | CC | 5.12e-08 | 2.68e-01 | 0.0264 |
| 4154 | MBNL1 | HSIL_HPV_1 | Human | Cervix | HSIL_HPV | 1.70e-02 | 2.80e-01 | 0.0116 |
| 4154 | MBNL1 | CCI_1 | Human | Cervix | CC | 1.01e-10 | 1.24e+00 | 0.528 |
| 4154 | MBNL1 | CCI_2 | Human | Cervix | CC | 1.27e-16 | 2.80e+00 | 0.5249 |
| 4154 | MBNL1 | CCI_3 | Human | Cervix | CC | 5.63e-25 | 2.04e+00 | 0.516 |
| 4154 | MBNL1 | H2 | Human | Cervix | HSIL_HPV | 1.07e-05 | -3.25e-01 | 0.0632 |
| 4154 | MBNL1 | L1 | Human | Cervix | CC | 1.34e-03 | -3.59e-02 | 0.0802 |
| 4154 | MBNL1 | HTA11_3410_2000001011 | Human | Colorectum | AD | 8.67e-45 | -8.77e-01 | 0.0155 |
| 4154 | MBNL1 | HTA11_2487_2000001011 | Human | Colorectum | SER | 1.50e-02 | -4.26e-01 | -0.1808 |
| 4154 | MBNL1 | HTA11_2951_2000001011 | Human | Colorectum | AD | 2.86e-06 | -7.46e-01 | 0.0216 |
| 4154 | MBNL1 | HTA11_347_2000001011 | Human | Colorectum | AD | 1.12e-05 | 4.31e-01 | -0.1954 |
| 4154 | MBNL1 | HTA11_3361_2000001011 | Human | Colorectum | AD | 2.68e-16 | -6.65e-01 | -0.1207 |
| 4154 | MBNL1 | HTA11_7862_2000001011 | Human | Colorectum | AD | 9.80e-03 | -5.13e-01 | -0.0179 |
| 4154 | MBNL1 | HTA11_866_3004761011 | Human | Colorectum | AD | 5.73e-28 | -8.59e-01 | 0.096 |
| 4154 | MBNL1 | HTA11_4255_2000001011 | Human | Colorectum | SER | 1.62e-03 | -4.57e-01 | 0.0446 |
| 4154 | MBNL1 | HTA11_9408_2000001011 | Human | Colorectum | AD | 4.13e-07 | -9.67e-01 | 0.0451 |
| 4154 | MBNL1 | HTA11_8622_2000001021 | Human | Colorectum | SER | 3.57e-12 | -8.07e-01 | 0.0528 |
| 4154 | MBNL1 | HTA11_7663_2000001011 | Human | Colorectum | SER | 2.26e-03 | -4.18e-01 | 0.0131 |
| 4154 | MBNL1 | HTA11_10711_2000001011 | Human | Colorectum | AD | 1.11e-07 | -6.02e-01 | 0.0338 |
| 4154 | MBNL1 | HTA11_7696_3000711011 | Human | Colorectum | AD | 6.28e-36 | -7.67e-01 | 0.0674 |
| Page: 1 2 3 4 5 6 7 8 9 10 11 12 |
| Tissue | Expression Dynamics | Abbreviation |
| Cervix | 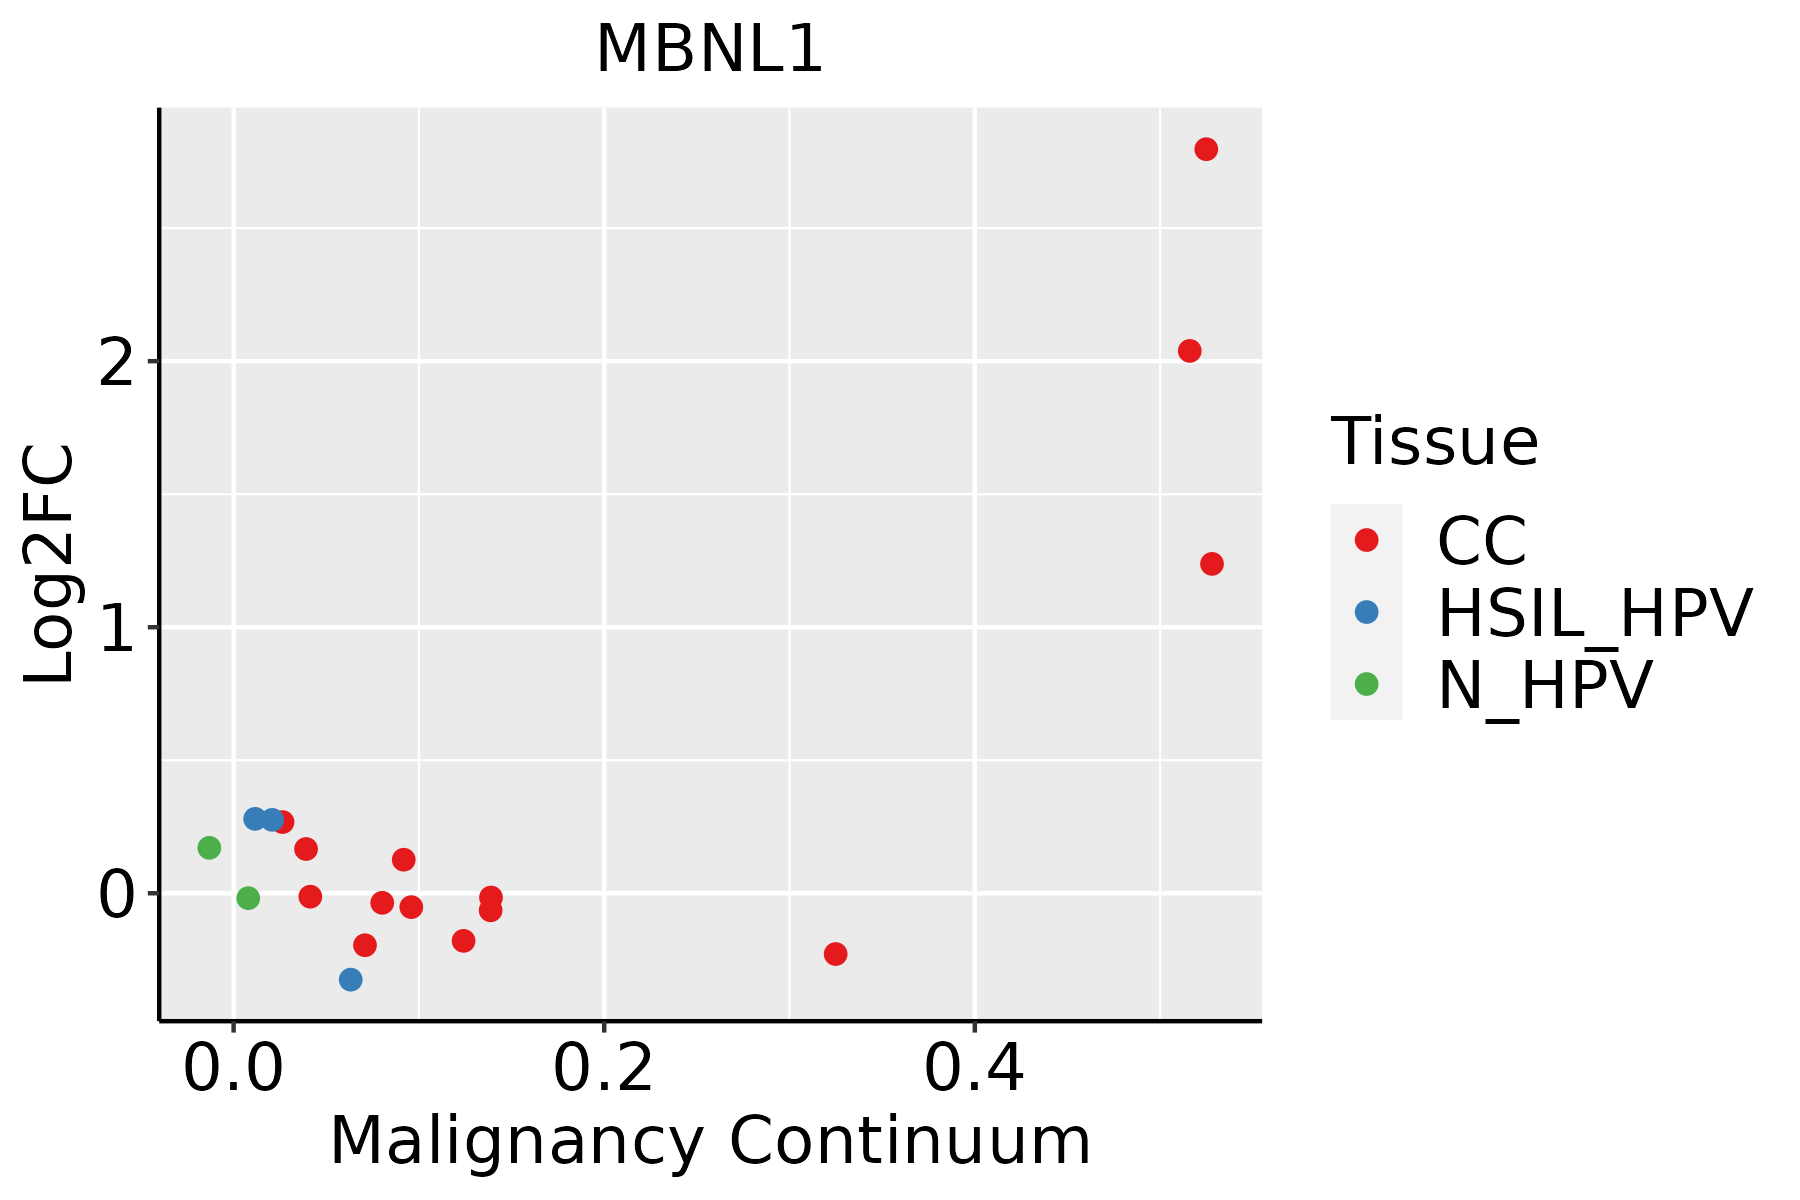 | CC: Cervix cancer |
| HSIL_HPV: HPV-infected high-grade squamous intraepithelial lesions | ||
| N_HPV: HPV-infected normal cervix | ||
| Colorectum (GSE201348) |  | FAP: Familial adenomatous polyposis |
| CRC: Colorectal cancer | ||
| Colorectum (HTA11) |  | AD: Adenomas |
| SER: Sessile serrated lesions | ||
| MSI-H: Microsatellite-high colorectal cancer | ||
| MSS: Microsatellite stable colorectal cancer | ||
| Esophagus | 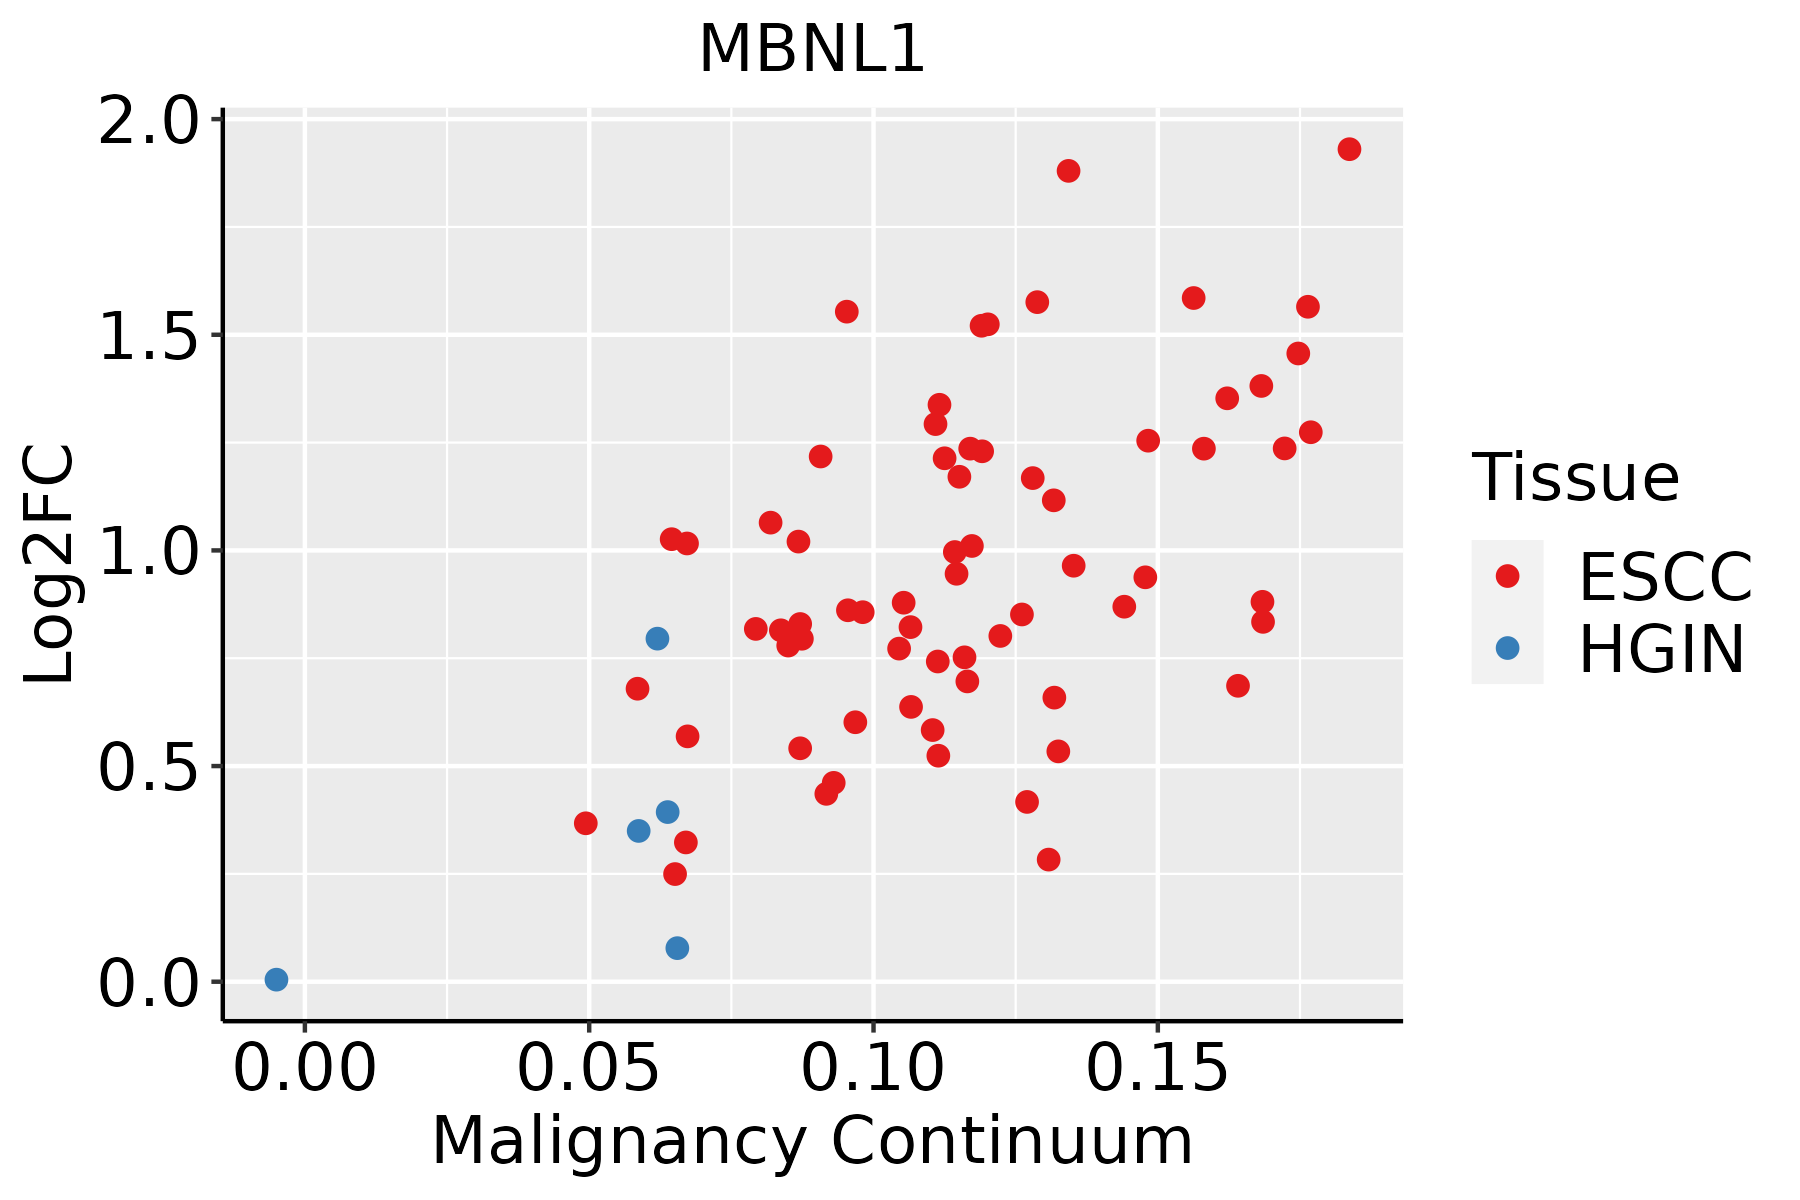 | ESCC: Esophageal squamous cell carcinoma |
| HGIN: High-grade intraepithelial neoplasias | ||
| LGIN: Low-grade intraepithelial neoplasias | ||
| Liver | 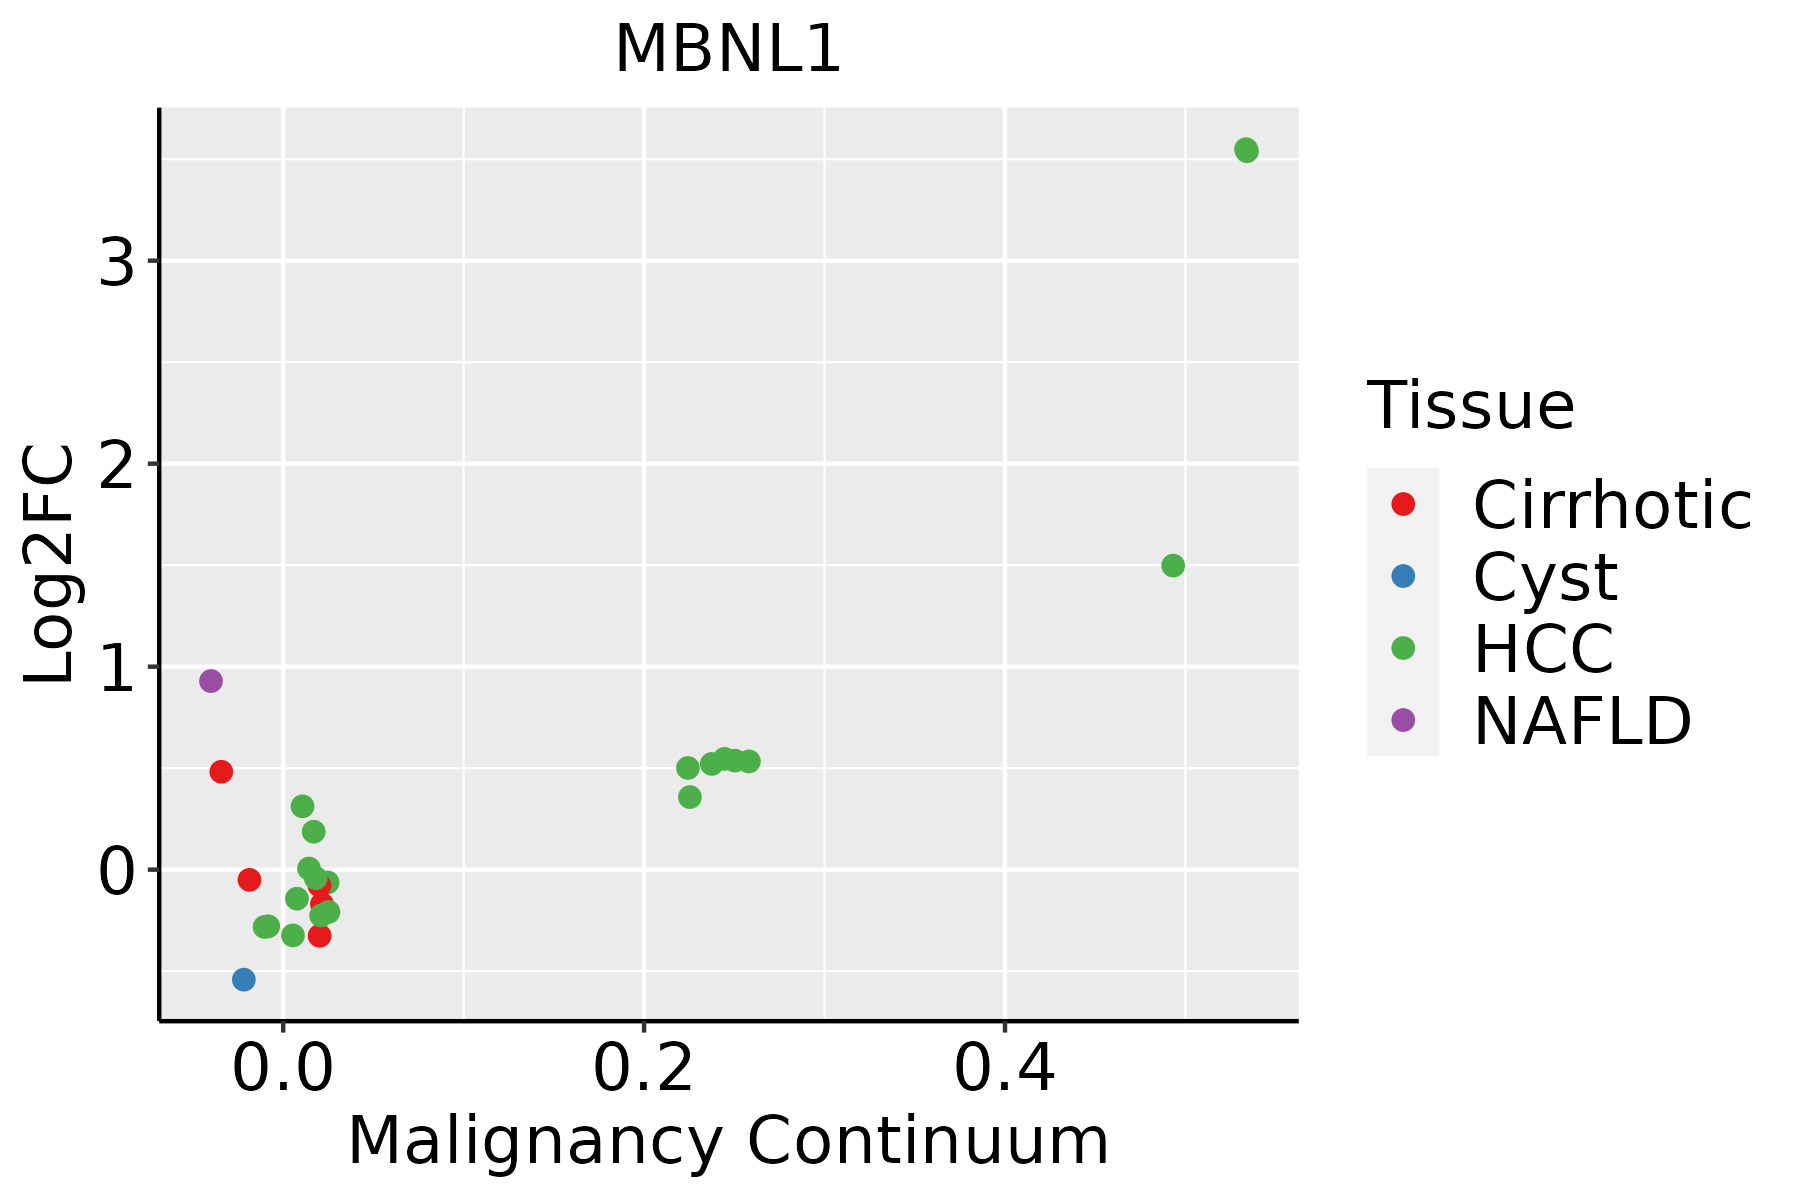 | HCC: Hepatocellular carcinoma |
| NAFLD: Non-alcoholic fatty liver disease | ||
| Lung | 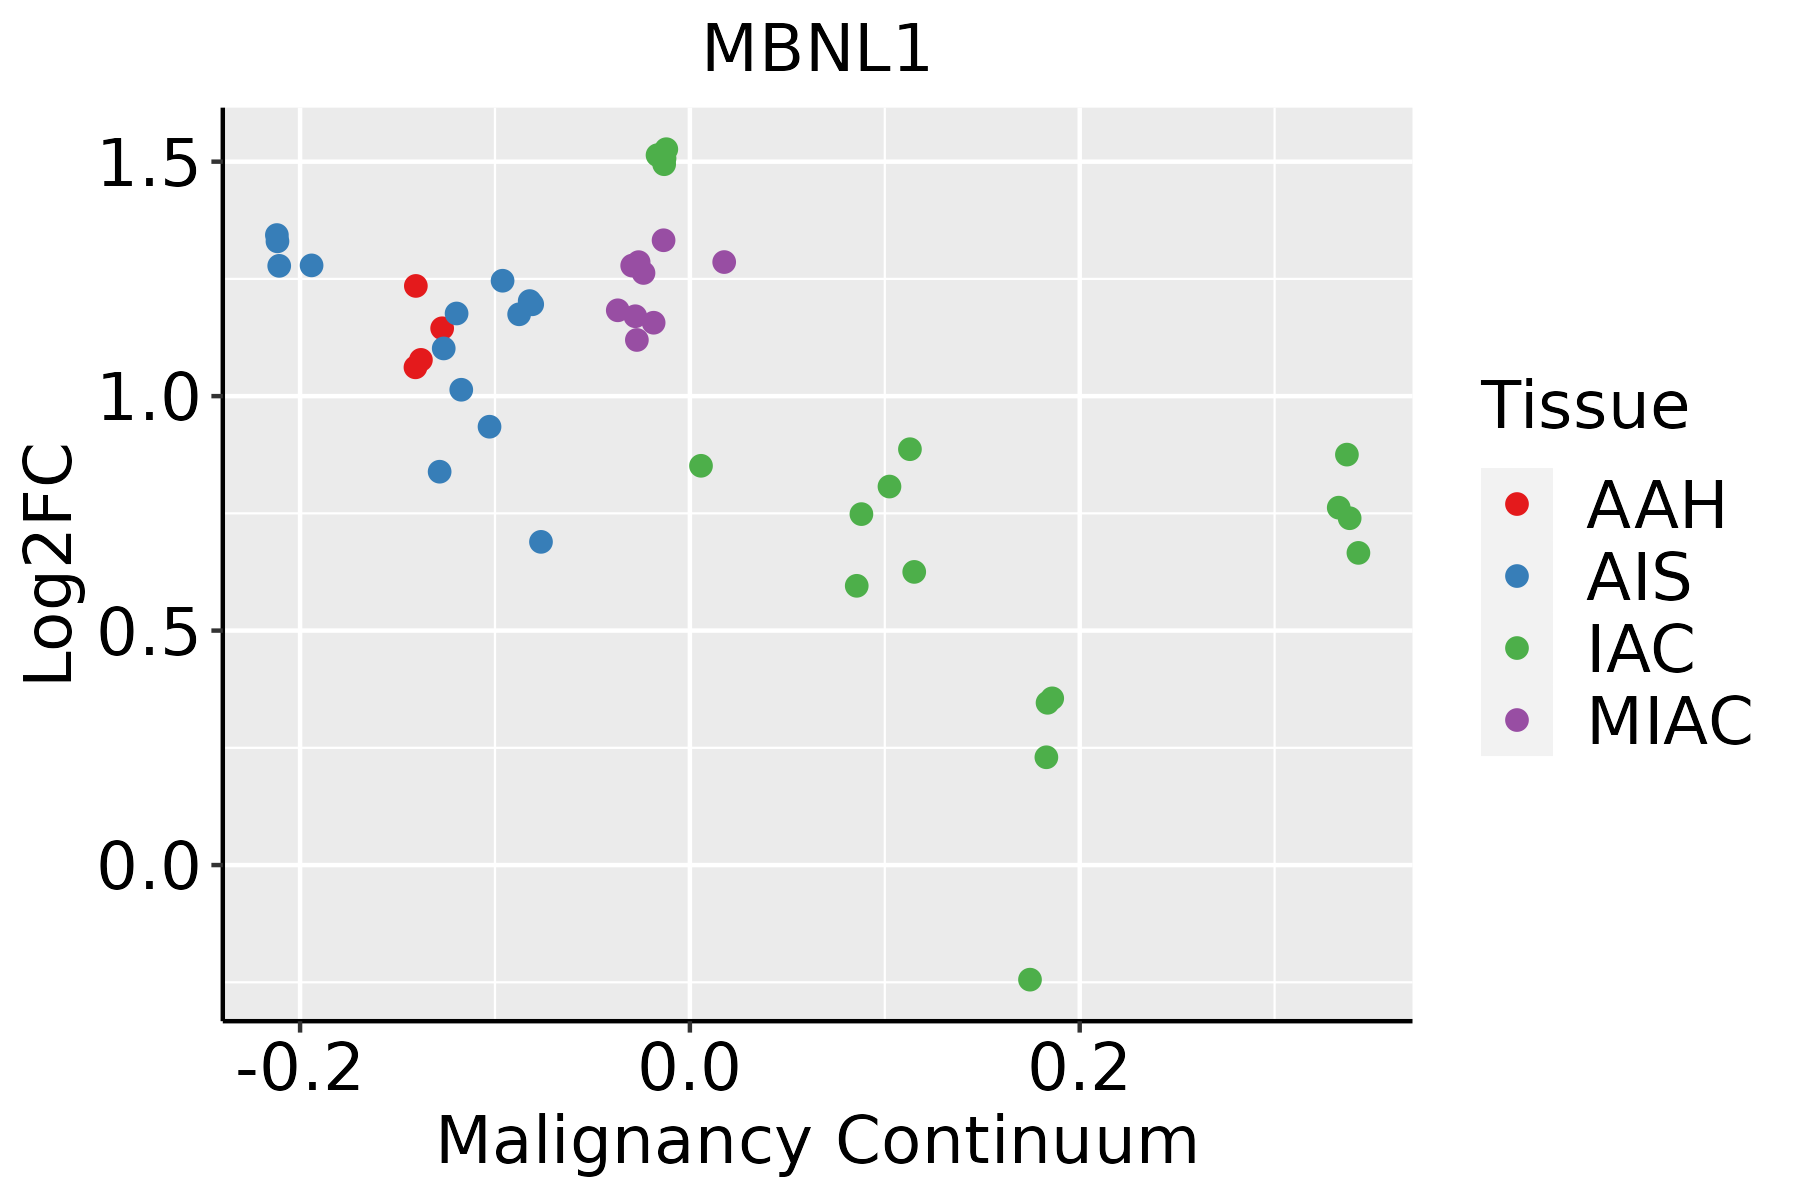 | AAH: Atypical adenomatous hyperplasia |
| AIS: Adenocarcinoma in situ | ||
| IAC: Invasive lung adenocarcinoma | ||
| MIA: Minimally invasive adenocarcinoma | ||
| Oral Cavity |  | EOLP: Erosive Oral lichen planus |
| LP: leukoplakia | ||
| NEOLP: Non-erosive oral lichen planus | ||
| OSCC: Oral squamous cell carcinoma | ||
| Prostate | 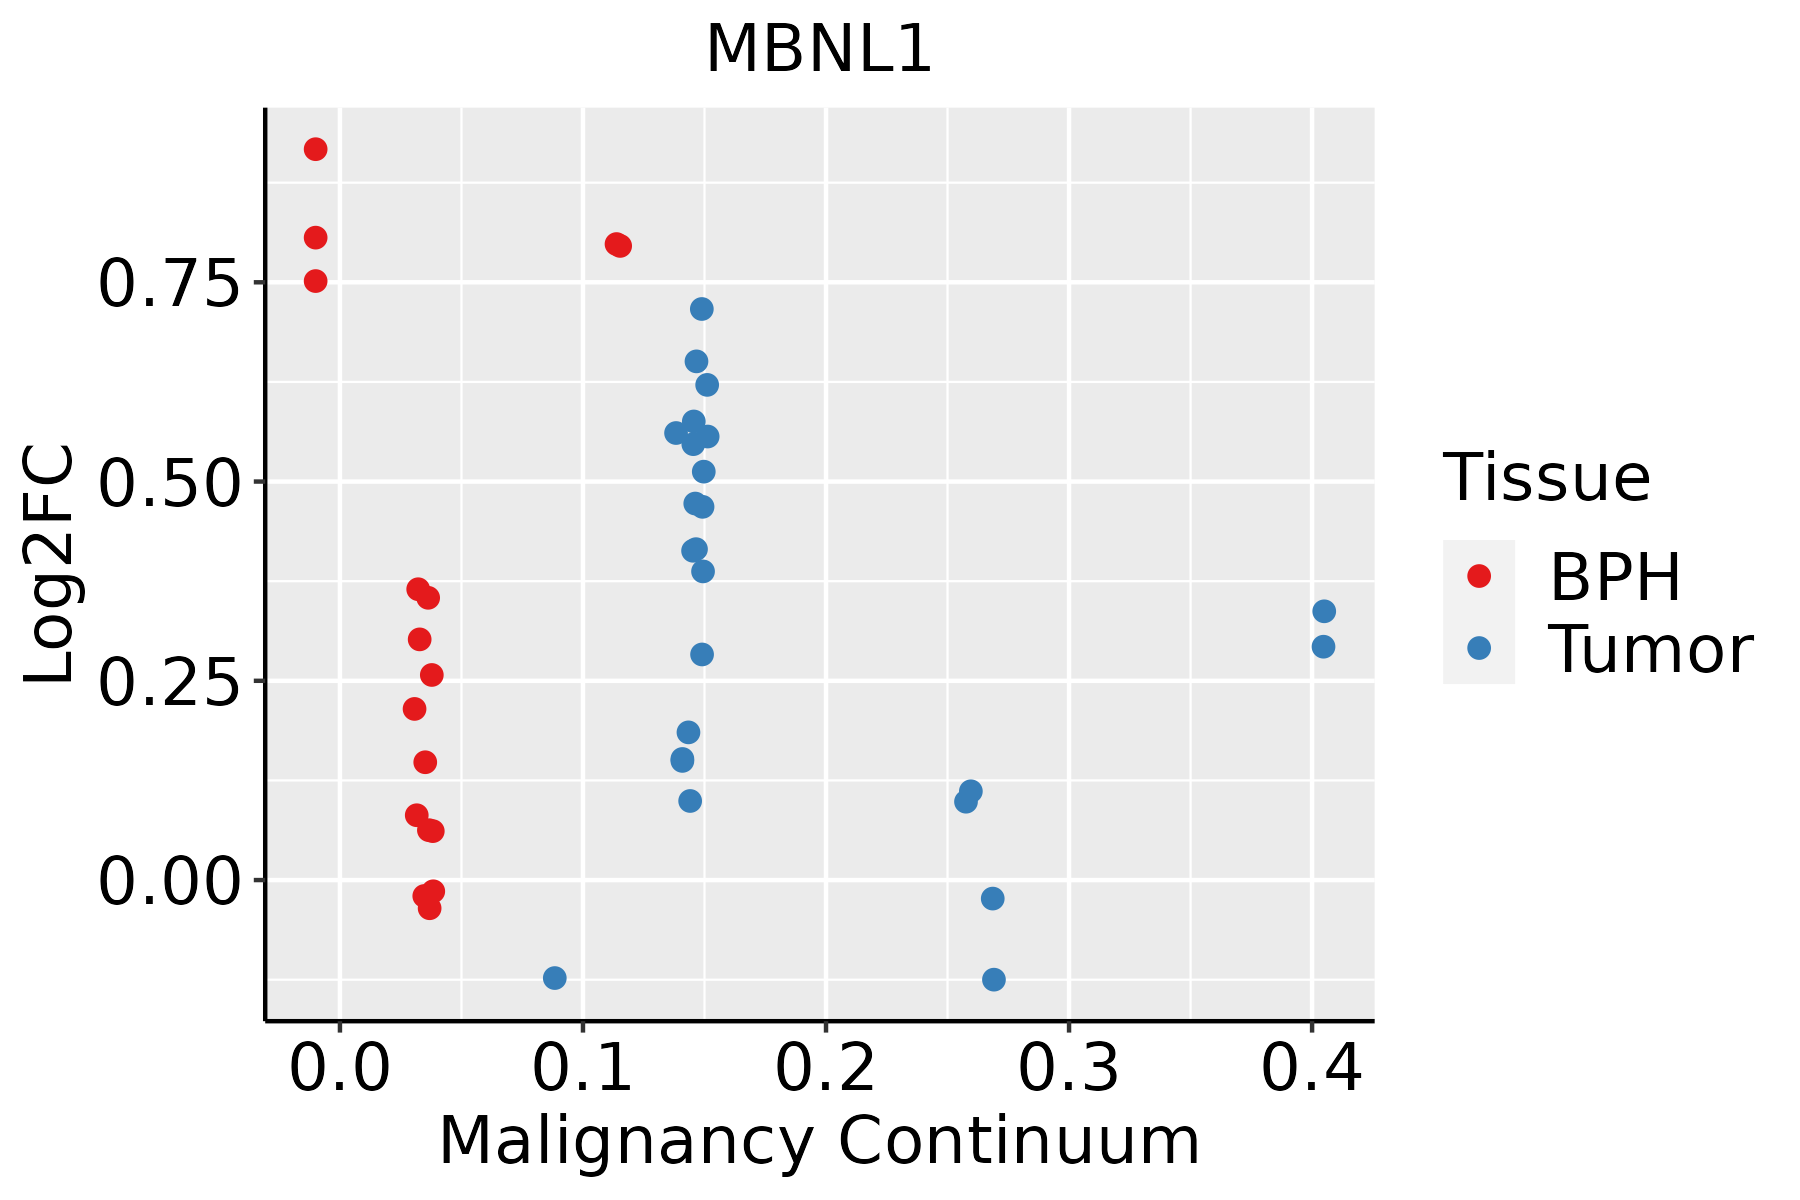 | BPH: Benign Prostatic Hyperplasia |
| Skin |  | AK: Actinic keratosis |
| cSCC: Cutaneous squamous cell carcinoma | ||
| SCCIS:squamous cell carcinoma in situ | ||
| Thyroid | 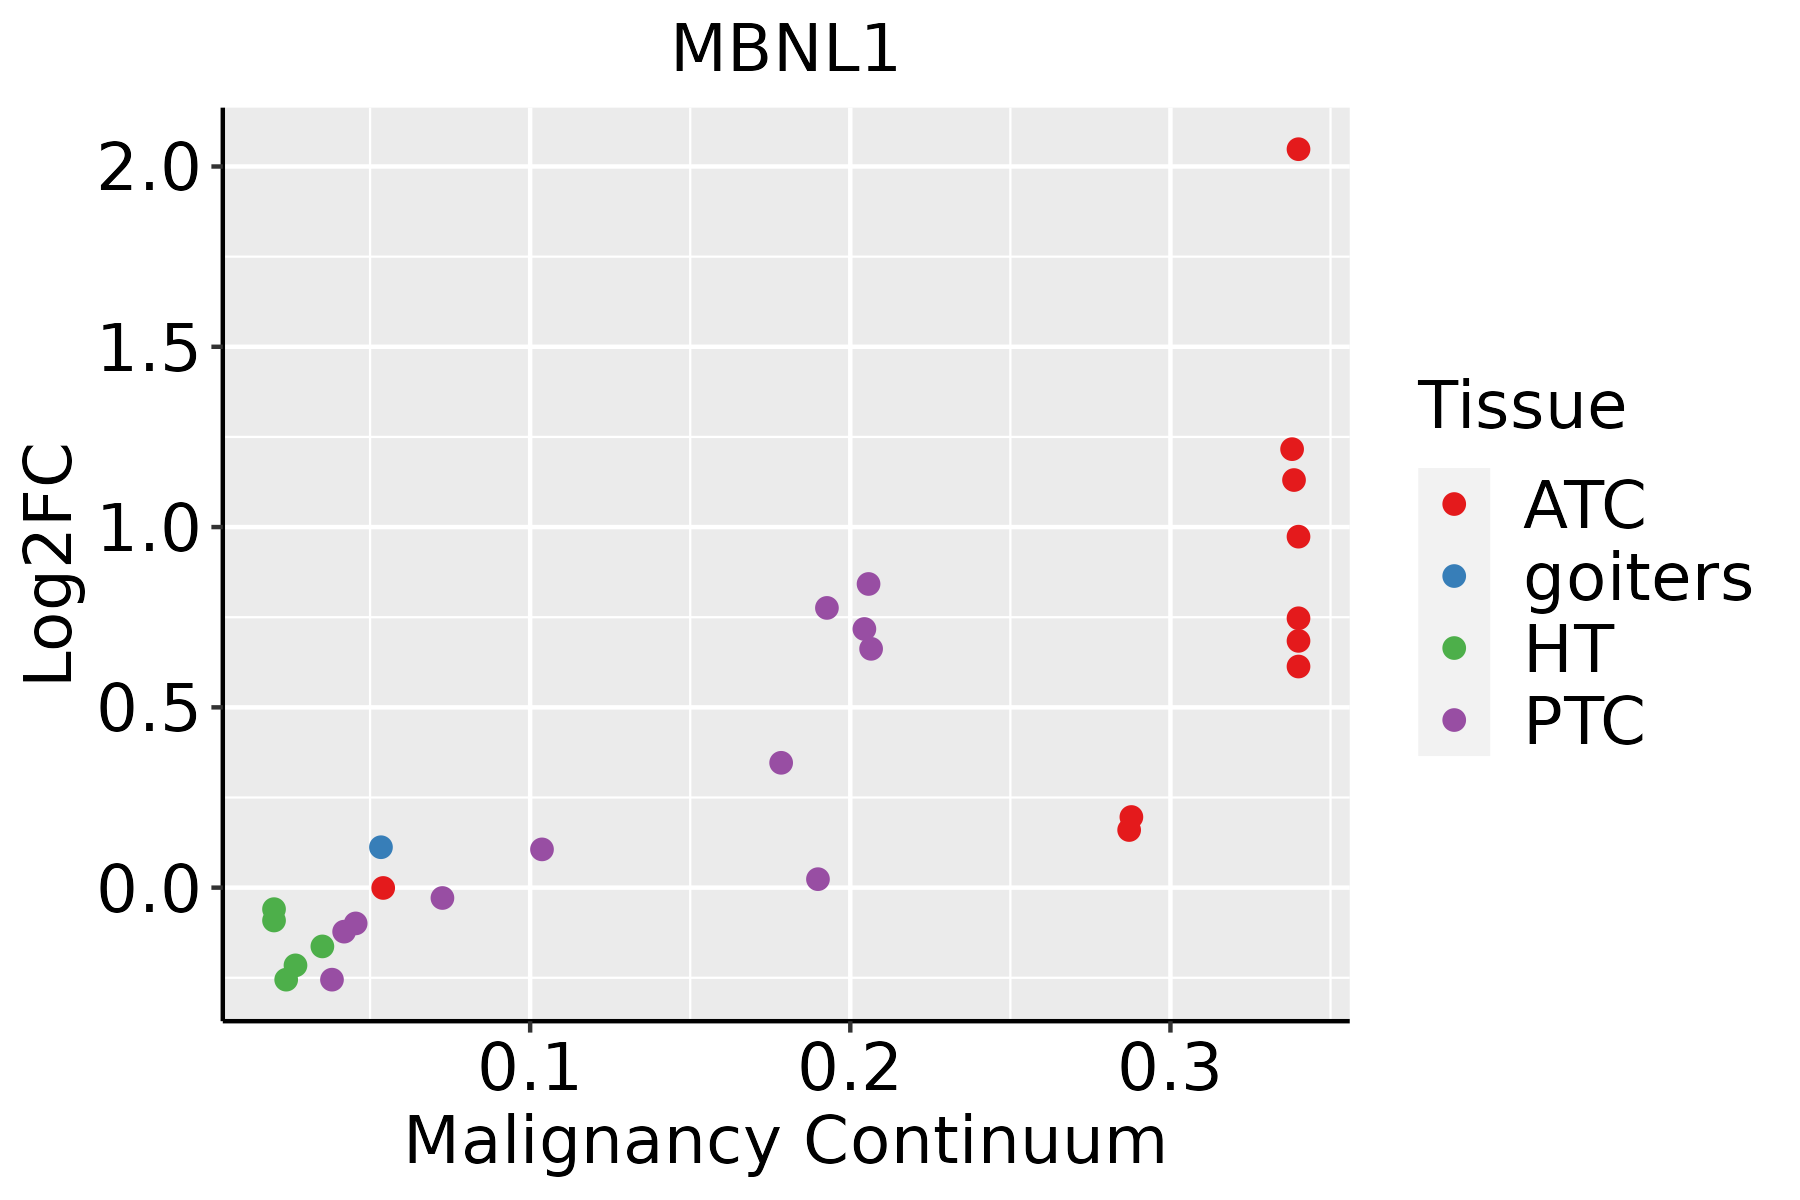 | ATC: Anaplastic thyroid cancer |
| HT: Hashimoto's thyroiditis | ||
| PTC: Papillary thyroid cancer |
| ∗log2FC in expression of this searched gene in stem-like cells from each diseased tissue sample relative to stem-like cells in normal samples in each tissue plotted against the malignancy continuum. Samples are colored based on if they are from different disease stage. |
Top |
Malignant transformation related pathway analysis |
| Find out the enriched GO biological processes and KEGG pathways involved in transition from healthy to precancer to cancer |
| Tissue | Disease Stage | Enriched GO biological Processes |
| Colorectum | AD |  |
| Colorectum | SER |  |
| Colorectum | MSS |  |
| Colorectum | MSI-H |  |
| Colorectum | FAP |  |
| ∗Top 15 enriched GO BP terms are showed in the bar plot of each disease state in each tissue. Each row represents a significant GO biological process which is colored according to the -log10(p.adjust). |
| Page: 1 2 3 4 5 6 7 8 9 |
| GO ID | Tissue | Disease Stage | Description | Gene Ratio | Bg Ratio | pvalue | p.adjust | Count |
| GO:000038021 | Liver | HCC | alternative mRNA splicing, via spliceosome | 52/7958 | 77/18723 | 7.87e-06 | 9.27e-05 | 52 |
| GO:000038121 | Liver | HCC | regulation of alternative mRNA splicing, via spliceosome | 37/7958 | 60/18723 | 2.13e-03 | 1.07e-02 | 37 |
| GO:00434848 | Lung | IAC | regulation of RNA splicing | 49/2061 | 148/18723 | 4.76e-13 | 7.06e-10 | 49 |
| GO:19033117 | Lung | IAC | regulation of mRNA metabolic process | 71/2061 | 288/18723 | 3.76e-11 | 1.24e-08 | 71 |
| GO:00480248 | Lung | IAC | regulation of mRNA splicing, via spliceosome | 34/2061 | 101/18723 | 1.05e-09 | 1.95e-07 | 34 |
| GO:00506847 | Lung | IAC | regulation of mRNA processing | 41/2061 | 137/18723 | 1.23e-09 | 2.15e-07 | 41 |
| GO:00017016 | Lung | IAC | in utero embryonic development | 68/2061 | 367/18723 | 1.12e-05 | 3.45e-04 | 68 |
| GO:00003817 | Lung | IAC | regulation of alternative mRNA splicing, via spliceosome | 19/2061 | 60/18723 | 1.36e-05 | 4.05e-04 | 19 |
| GO:00003807 | Lung | IAC | alternative mRNA splicing, via spliceosome | 22/2061 | 77/18723 | 1.85e-05 | 5.22e-04 | 22 |
| GO:00083808 | Lung | IAC | RNA splicing | 75/2061 | 434/18723 | 4.89e-05 | 1.12e-03 | 75 |
| GO:00003778 | Lung | IAC | RNA splicing, via transesterification reactions with bulged adenosine as nucleophile | 52/2061 | 320/18723 | 2.64e-03 | 2.44e-02 | 52 |
| GO:00003988 | Lung | IAC | mRNA splicing, via spliceosome | 52/2061 | 320/18723 | 2.64e-03 | 2.44e-02 | 52 |
| GO:00003758 | Lung | IAC | RNA splicing, via transesterification reactions | 52/2061 | 324/18723 | 3.43e-03 | 2.93e-02 | 52 |
| GO:004348413 | Lung | AIS | regulation of RNA splicing | 45/1849 | 148/18723 | 2.75e-12 | 2.67e-09 | 45 |
| GO:004802413 | Lung | AIS | regulation of mRNA splicing, via spliceosome | 32/1849 | 101/18723 | 1.20e-09 | 2.42e-07 | 32 |
| GO:190331112 | Lung | AIS | regulation of mRNA metabolic process | 60/1849 | 288/18723 | 1.74e-08 | 2.47e-06 | 60 |
| GO:005068412 | Lung | AIS | regulation of mRNA processing | 36/1849 | 137/18723 | 3.06e-08 | 3.79e-06 | 36 |
| GO:000038112 | Lung | AIS | regulation of alternative mRNA splicing, via spliceosome | 19/1849 | 60/18723 | 2.77e-06 | 1.52e-04 | 19 |
| GO:000038012 | Lung | AIS | alternative mRNA splicing, via spliceosome | 21/1849 | 77/18723 | 1.19e-05 | 4.71e-04 | 21 |
| GO:000838013 | Lung | AIS | RNA splicing | 68/1849 | 434/18723 | 8.50e-05 | 2.11e-03 | 68 |
| Page: 1 2 3 4 5 6 7 8 9 10 11 12 13 14 15 |
| Pathway ID | Tissue | Disease Stage | Description | Gene Ratio | Bg Ratio | pvalue | p.adjust | qvalue | Count |
| Page: 1 |
Top |
Cell-cell communication analysis |
| Identification of potential cell-cell interactions between two cell types and their ligand-receptor pairs for different disease states |
| Ligand | Receptor | LRpair | Pathway | Tissue | Disease Stage |
| Page: 1 |
Top |
Single-cell gene regulatory network inference analysis |
| Find out the significant the regulons (TFs) and the target genes of each regulon across cell types for different disease states |
| TF | Cell Type | Tissue | Disease Stage | Target Gene | RSS | Regulon Activity |
| ∗The dot plots of a searched regulon are shown for all cell subpopulations in each disease state of each tissue based on the regulon specific score inferred using pySCENIC and by calculating the average expression. |
| Page: 1 |
Top |
Somatic mutation of malignant transformation related genes |
| Annotation of somatic variants for genes involved in malignant transformation |
| Hugo Symbol | Variant Class | Variant Classification | dbSNP RS | HGVSc | HGVSp | HGVSp Short | SWISSPROT | BIOTYPE | SIFT | PolyPhen | Tumor Sample Barcode | Tissue | Histology | Sex | Age | Stage | Therapy Types | Drugs | Outcome |
| MBNL1 | SNV | Missense_Mutation | c.347N>T | p.Pro116Leu | p.P116L | Q9NR56 | protein_coding | deleterious(0.02) | benign(0.036) | TCGA-A8-A09X-01 | Breast | breast invasive carcinoma | Female | <65 | III/IV | Unknown | Unknown | SD | |
| MBNL1 | SNV | Missense_Mutation | c.895A>G | p.Lys299Glu | p.K299E | Q9NR56 | protein_coding | deleterious(0) | probably_damaging(0.999) | TCGA-D8-A27I-01 | Breast | breast invasive carcinoma | Female | <65 | III/IV | Chemotherapy | adrimycin+cyclophosphamide | SD | |
| MBNL1 | SNV | Missense_Mutation | c.163G>A | p.Asp55Asn | p.D55N | Q9NR56 | protein_coding | deleterious(0.02) | possibly_damaging(0.899) | TCGA-D8-A27W-01 | Breast | breast invasive carcinoma | Female | <65 | III/IV | Chemotherapy | doxorubicine+cyclophosphamide | SD | |
| MBNL1 | SNV | Missense_Mutation | c.154G>A | p.Ala52Thr | p.A52T | Q9NR56 | protein_coding | deleterious(0) | probably_damaging(0.962) | TCGA-2W-A8YY-01 | Cervix | cervical & endocervical cancer | Female | <65 | I/II | Chemotherapy | cisplatin | CR | |
| MBNL1 | SNV | Missense_Mutation | novel | c.488T>C | p.Val163Ala | p.V163A | Q9NR56 | protein_coding | tolerated(0.08) | benign(0.061) | TCGA-2W-A8YY-01 | Cervix | cervical & endocervical cancer | Female | <65 | I/II | Chemotherapy | cisplatin | CR |
| MBNL1 | SNV | Missense_Mutation | c.251N>A | p.Arg84His | p.R84H | Q9NR56 | protein_coding | deleterious(0.02) | probably_damaging(0.998) | TCGA-AA-3715-01 | Colorectum | colon adenocarcinoma | Male | >=65 | I/II | Unknown | Unknown | PD | |
| MBNL1 | SNV | Missense_Mutation | c.41N>C | p.Leu14Pro | p.L14P | Q9NR56 | protein_coding | deleterious(0.01) | benign(0.315) | TCGA-AA-3864-01 | Colorectum | colon adenocarcinoma | Male | >=65 | I/II | Unknown | Unknown | SD | |
| MBNL1 | SNV | Missense_Mutation | rs753484865 | c.614C>A | p.Pro205His | p.P205H | Q9NR56 | protein_coding | deleterious(0) | probably_damaging(0.983) | TCGA-AA-3950-01 | Colorectum | colon adenocarcinoma | Female | >=65 | I/II | Unknown | Unknown | SD |
| MBNL1 | SNV | Missense_Mutation | c.185N>T | p.Ser62Phe | p.S62F | Q9NR56 | protein_coding | deleterious(0) | possibly_damaging(0.847) | TCGA-F4-6459-01 | Colorectum | colon adenocarcinoma | Female | <65 | III/IV | Unknown | Unknown | SD | |
| MBNL1 | SNV | Missense_Mutation | c.749N>T | p.Ala250Val | p.A250V | Q9NR56 | protein_coding | deleterious(0.01) | possibly_damaging(0.46) | TCGA-QG-A5Z2-01 | Colorectum | colon adenocarcinoma | Male | <65 | I/II | Unknown | Unknown | SD |
| Page: 1 2 3 4 5 6 |
Top |
Related drugs of malignant transformation related genes |
| Identification of chemicals and drugs interact with genes involved in malignant transfromation |
| (DGIdb 4.0) |
| Entrez ID | Symbol | Category | Interaction Types | Drug Claim Name | Drug Name | PMIDs |
| 4154 | MBNL1 | DRUGGABLE GENOME | MITOXANTRONE | MITOXANTRONE | ||
| 4154 | MBNL1 | DRUGGABLE GENOME | GNF-PF-5149 | CHEMBL600309 | ||
| 4154 | MBNL1 | DRUGGABLE GENOME | LOMOFUNGIN | LOMOFUNGIN | ||
| 4154 | MBNL1 | DRUGGABLE GENOME | NOR-BINALTORPHIMINE DIHYDROCHLORIDE | CHEMBL2374078 | ||
| 4154 | MBNL1 | DRUGGABLE GENOME | AZELAIC ACID | AZELAIC ACID | ||
| 4154 | MBNL1 | DRUGGABLE GENOME | NSC-95397 | CHEMBL429095 | ||
| 4154 | MBNL1 | DRUGGABLE GENOME | EPINEPHRINE BITARTRATE | EPINEPHRINE BITARTRATE | ||
| 4154 | MBNL1 | DRUGGABLE GENOME | MITOXANTRONE DIHYDROCHLORIDE | MITOXANTRONE HYDROCHLORIDE | ||
| 4154 | MBNL1 | DRUGGABLE GENOME | NOREPINEPHRINE | NOREPINEPHRINE | ||
| 4154 | MBNL1 | DRUGGABLE GENOME | RAMATROBAN | RAMATROBAN |
| Page: 1 2 |

Copyright 2023-Present -The University of Texas Health Science Center at Houston |