
|
|||||
|
 | |
| |
| |
| |
| |
| |
|
Gene: MAP3K4 |
Gene summary for MAP3K4 |
| Gene information | Species | Human | Gene symbol | MAP3K4 | Gene ID | 4216 |
| Gene name | mitogen-activated protein kinase kinase kinase 4 | |
| Gene Alias | MAPKKK4 | |
| Cytomap | 6q26 | |
| Gene Type | protein-coding | GO ID | GO:0000003 | UniProtAcc | Q9Y6R4 |
Top |
Malignant transformation analysis |
| Identification of the aberrant gene expression in precancerous and cancerous lesions by comparing the gene expression of stem-like cells in diseased tissues with normal stem cells |
| Entrez ID | Symbol | Replicates | Species | Organ | Tissue | Adj P-value | Log2FC | Malignancy |
| 4216 | MAP3K4 | CCI_1 | Human | Cervix | CC | 2.43e-09 | 9.63e-01 | 0.528 |
| 4216 | MAP3K4 | CCI_3 | Human | Cervix | CC | 6.83e-04 | 5.37e-01 | 0.516 |
| 4216 | MAP3K4 | LZE4T | Human | Esophagus | ESCC | 2.69e-14 | 3.73e-01 | 0.0811 |
| 4216 | MAP3K4 | LZE7T | Human | Esophagus | ESCC | 6.51e-09 | 3.09e-01 | 0.0667 |
| 4216 | MAP3K4 | LZE8T | Human | Esophagus | ESCC | 1.80e-02 | 9.09e-02 | 0.067 |
| 4216 | MAP3K4 | LZE20T | Human | Esophagus | ESCC | 3.49e-04 | 1.33e-01 | 0.0662 |
| 4216 | MAP3K4 | LZE22D1 | Human | Esophagus | HGIN | 1.32e-03 | 1.40e-01 | 0.0595 |
| 4216 | MAP3K4 | LZE24T | Human | Esophagus | ESCC | 1.91e-07 | 2.37e-01 | 0.0596 |
| 4216 | MAP3K4 | LZE21T | Human | Esophagus | ESCC | 2.62e-05 | 2.35e-01 | 0.0655 |
| 4216 | MAP3K4 | P1T-E | Human | Esophagus | ESCC | 7.91e-13 | 4.05e-01 | 0.0875 |
| 4216 | MAP3K4 | P2T-E | Human | Esophagus | ESCC | 1.07e-16 | 4.23e-01 | 0.1177 |
| 4216 | MAP3K4 | P4T-E | Human | Esophagus | ESCC | 1.53e-27 | 4.17e-01 | 0.1323 |
| 4216 | MAP3K4 | P5T-E | Human | Esophagus | ESCC | 1.51e-25 | 4.66e-01 | 0.1327 |
| 4216 | MAP3K4 | P8T-E | Human | Esophagus | ESCC | 8.48e-25 | 3.64e-01 | 0.0889 |
| 4216 | MAP3K4 | P9T-E | Human | Esophagus | ESCC | 2.48e-06 | 1.34e-01 | 0.1131 |
| 4216 | MAP3K4 | P10T-E | Human | Esophagus | ESCC | 1.73e-27 | 3.25e-01 | 0.116 |
| 4216 | MAP3K4 | P11T-E | Human | Esophagus | ESCC | 5.16e-14 | 4.85e-01 | 0.1426 |
| 4216 | MAP3K4 | P12T-E | Human | Esophagus | ESCC | 5.67e-18 | 3.62e-01 | 0.1122 |
| 4216 | MAP3K4 | P15T-E | Human | Esophagus | ESCC | 9.37e-27 | 4.84e-01 | 0.1149 |
| 4216 | MAP3K4 | P16T-E | Human | Esophagus | ESCC | 2.19e-23 | 3.68e-01 | 0.1153 |
| Page: 1 2 3 4 5 |
| Tissue | Expression Dynamics | Abbreviation |
| Cervix | 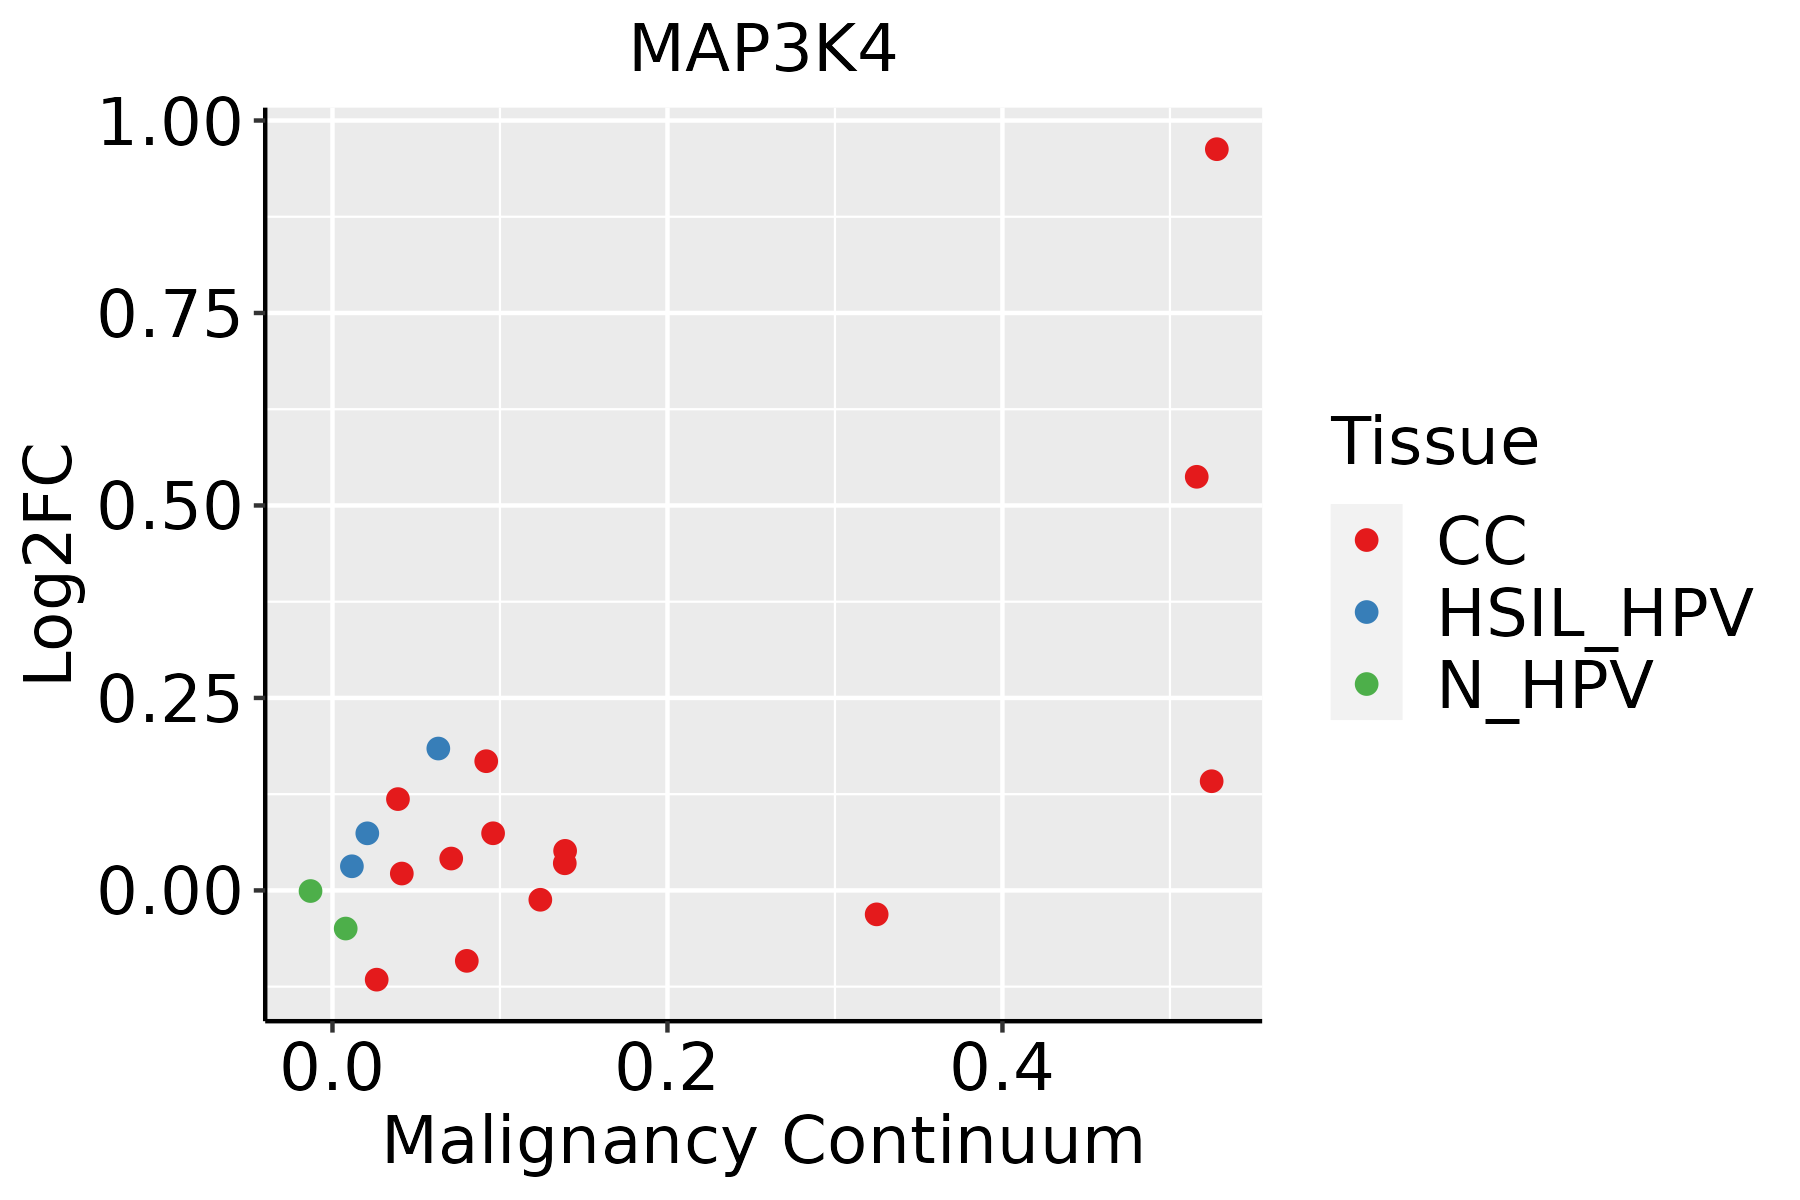 | CC: Cervix cancer |
| HSIL_HPV: HPV-infected high-grade squamous intraepithelial lesions | ||
| N_HPV: HPV-infected normal cervix | ||
| Esophagus |  | ESCC: Esophageal squamous cell carcinoma |
| HGIN: High-grade intraepithelial neoplasias | ||
| LGIN: Low-grade intraepithelial neoplasias | ||
| Thyroid | 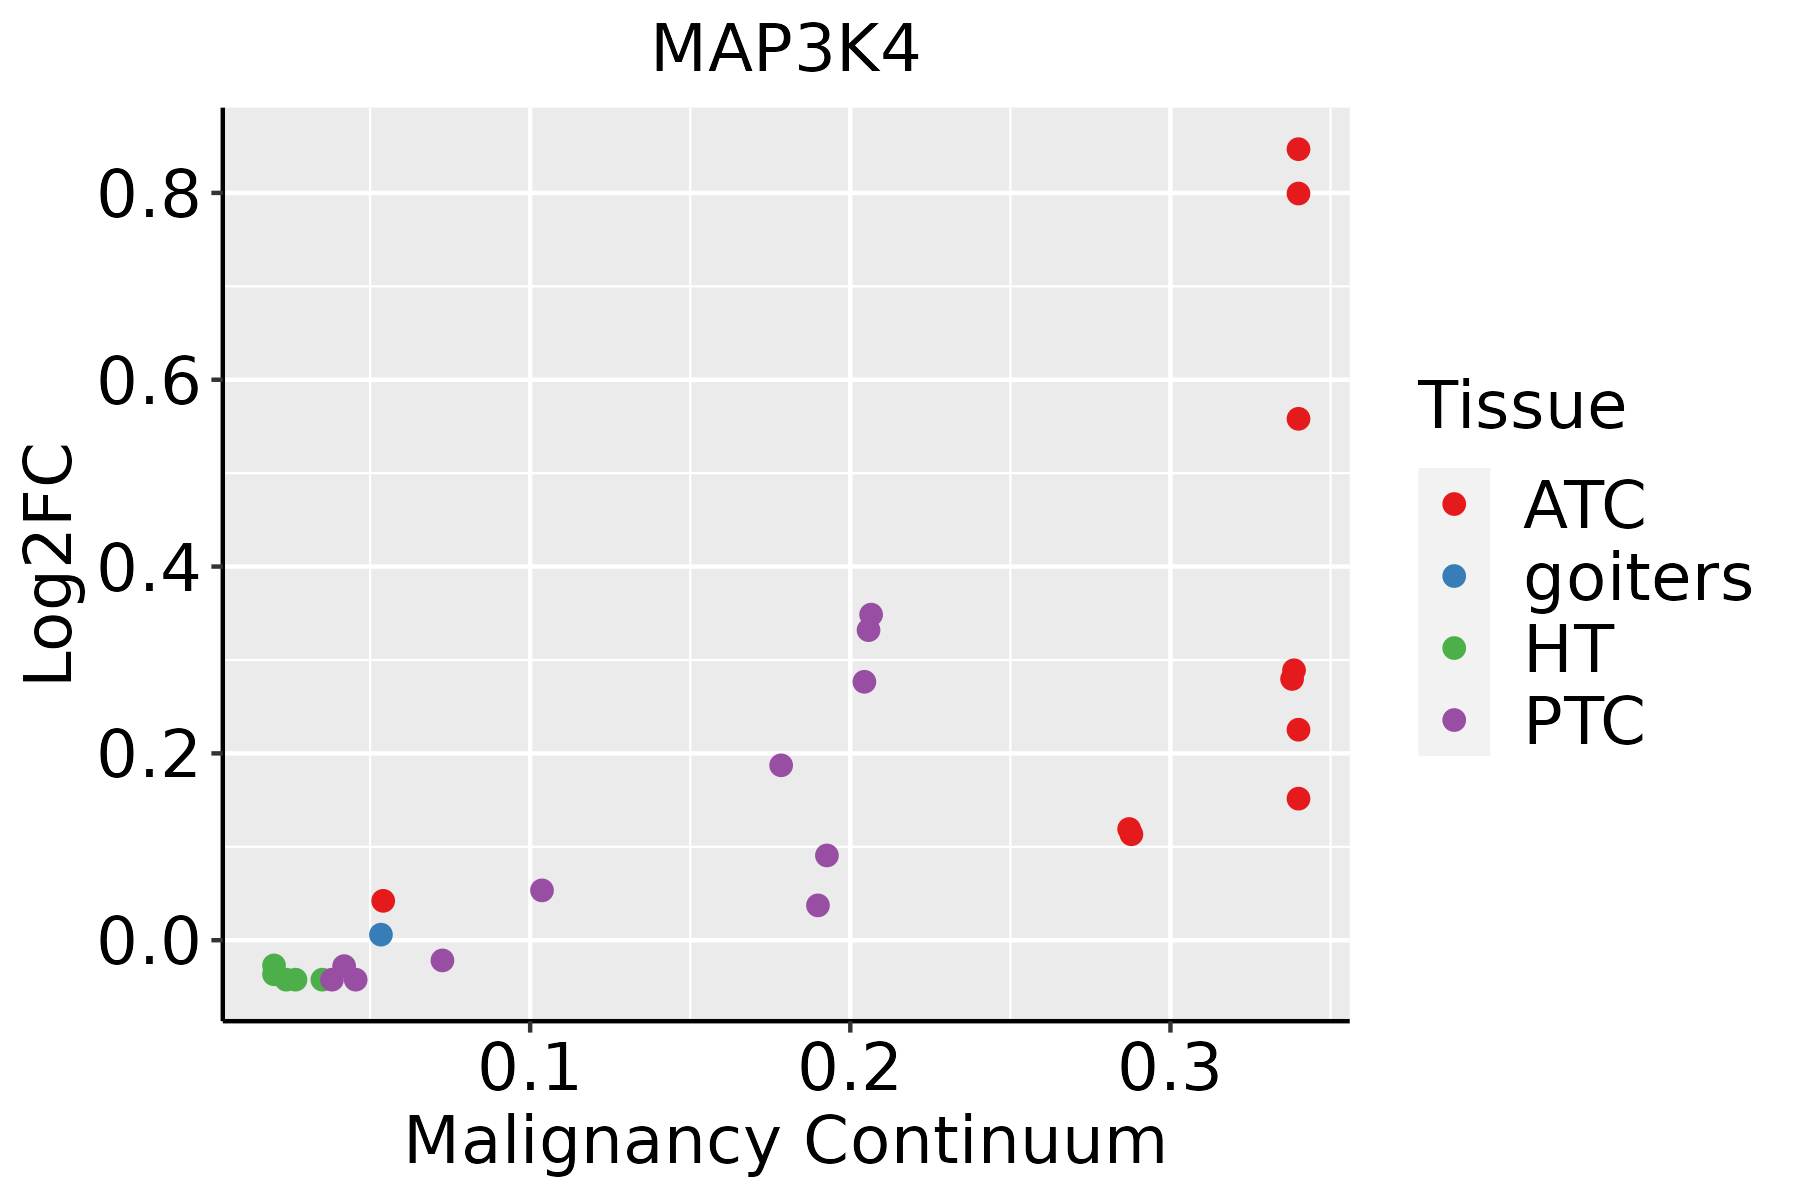 | ATC: Anaplastic thyroid cancer |
| HT: Hashimoto's thyroiditis | ||
| PTC: Papillary thyroid cancer |
| ∗log2FC in expression of this searched gene in stem-like cells from each diseased tissue sample relative to stem-like cells in normal samples in each tissue plotted against the malignancy continuum. Samples are colored based on if they are from different disease stage. |
Top |
Malignant transformation related pathway analysis |
| Find out the enriched GO biological processes and KEGG pathways involved in transition from healthy to precancer to cancer |
| Tissue | Disease Stage | Enriched GO biological Processes |
| Colorectum | AD |  |
| Colorectum | SER |  |
| Colorectum | MSS |  |
| Colorectum | MSI-H |  |
| Colorectum | FAP |  |
| ∗Top 15 enriched GO BP terms are showed in the bar plot of each disease state in each tissue. Each row represents a significant GO biological process which is colored according to the -log10(p.adjust). |
| Page: 1 2 3 4 5 6 7 8 9 |
| GO ID | Tissue | Disease Stage | Description | Gene Ratio | Bg Ratio | pvalue | p.adjust | Count |
| GO:003221017 | Thyroid | ATC | regulation of telomere maintenance via telomerase | 34/6293 | 53/18723 | 5.22e-06 | 5.61e-05 | 34 |
| GO:001083326 | Thyroid | ATC | telomere maintenance via telomere lengthening | 47/6293 | 81/18723 | 5.53e-06 | 5.93e-05 | 47 |
| GO:000627823 | Thyroid | ATC | RNA-dependent DNA biosynthetic process | 44/6293 | 75/18723 | 7.37e-06 | 7.56e-05 | 44 |
| GO:1904356110 | Thyroid | ATC | regulation of telomere maintenance via telomere lengthening | 37/6293 | 61/18723 | 1.35e-05 | 1.29e-04 | 37 |
| GO:007190215 | Thyroid | ATC | positive regulation of protein serine/threonine kinase activity | 96/6293 | 200/18723 | 1.63e-05 | 1.51e-04 | 96 |
| GO:200057325 | Thyroid | ATC | positive regulation of DNA biosynthetic process | 39/6293 | 66/18723 | 1.90e-05 | 1.73e-04 | 39 |
| GO:1904358111 | Thyroid | ATC | positive regulation of telomere maintenance via telomere lengthening | 25/6293 | 37/18723 | 2.50e-05 | 2.16e-04 | 25 |
| GO:003221219 | Thyroid | ATC | positive regulation of telomere maintenance via telomerase | 23/6293 | 34/18723 | 5.15e-05 | 3.99e-04 | 23 |
| GO:000189026 | Thyroid | ATC | placenta development | 70/6293 | 144/18723 | 1.33e-04 | 9.33e-04 | 70 |
| GO:003220016 | Thyroid | ATC | telomere organization | 76/6293 | 159/18723 | 1.40e-04 | 9.75e-04 | 76 |
| GO:000941613 | Thyroid | ATC | response to light stimulus | 139/6293 | 320/18723 | 1.42e-04 | 9.88e-04 | 139 |
| GO:005197323 | Thyroid | ATC | positive regulation of telomerase activity | 22/6293 | 34/18723 | 2.03e-04 | 1.35e-03 | 22 |
| GO:190435311 | Thyroid | ATC | regulation of telomere capping | 18/6293 | 26/18723 | 2.20e-04 | 1.44e-03 | 18 |
| GO:005197224 | Thyroid | ATC | regulation of telomerase activity | 28/6293 | 47/18723 | 2.31e-04 | 1.49e-03 | 28 |
| GO:004340513 | Thyroid | ATC | regulation of MAP kinase activity | 82/6293 | 177/18723 | 2.87e-04 | 1.83e-03 | 82 |
| GO:007030226 | Thyroid | ATC | regulation of stress-activated protein kinase signaling cascade | 89/6293 | 195/18723 | 3.05e-04 | 1.93e-03 | 89 |
| GO:003287226 | Thyroid | ATC | regulation of stress-activated MAPK cascade | 87/6293 | 192/18723 | 4.72e-04 | 2.77e-03 | 87 |
| GO:004340611 | Thyroid | ATC | positive regulation of MAP kinase activity | 51/6293 | 112/18723 | 5.68e-03 | 2.30e-02 | 51 |
| GO:001623311 | Thyroid | ATC | telomere capping | 21/6293 | 39/18723 | 7.26e-03 | 2.86e-02 | 21 |
| GO:19043551 | Thyroid | ATC | positive regulation of telomere capping | 11/6293 | 17/18723 | 8.56e-03 | 3.26e-02 | 11 |
| Page: 1 2 3 4 5 6 7 8 |
| Pathway ID | Tissue | Disease Stage | Description | Gene Ratio | Bg Ratio | pvalue | p.adjust | qvalue | Count |
| hsa0491212 | Cervix | CC | GnRH signaling pathway | 26/1267 | 93/8465 | 8.72e-04 | 3.87e-03 | 2.29e-03 | 26 |
| hsa040109 | Cervix | CC | MAPK signaling pathway | 62/1267 | 302/8465 | 4.89e-03 | 1.67e-02 | 9.86e-03 | 62 |
| hsa0491213 | Cervix | CC | GnRH signaling pathway | 26/1267 | 93/8465 | 8.72e-04 | 3.87e-03 | 2.29e-03 | 26 |
| hsa0401012 | Cervix | CC | MAPK signaling pathway | 62/1267 | 302/8465 | 4.89e-03 | 1.67e-02 | 9.86e-03 | 62 |
| Page: 1 |
Top |
Cell-cell communication analysis |
| Identification of potential cell-cell interactions between two cell types and their ligand-receptor pairs for different disease states |
| Ligand | Receptor | LRpair | Pathway | Tissue | Disease Stage |
| Page: 1 |
Top |
Single-cell gene regulatory network inference analysis |
| Find out the significant the regulons (TFs) and the target genes of each regulon across cell types for different disease states |
| TF | Cell Type | Tissue | Disease Stage | Target Gene | RSS | Regulon Activity |
| ∗The dot plots of a searched regulon are shown for all cell subpopulations in each disease state of each tissue based on the regulon specific score inferred using pySCENIC and by calculating the average expression. |
| Page: 1 |
Top |
Somatic mutation of malignant transformation related genes |
| Annotation of somatic variants for genes involved in malignant transformation |
| Hugo Symbol | Variant Class | Variant Classification | dbSNP RS | HGVSc | HGVSp | HGVSp Short | SWISSPROT | BIOTYPE | SIFT | PolyPhen | Tumor Sample Barcode | Tissue | Histology | Sex | Age | Stage | Therapy Types | Drugs | Outcome |
| MAP3K4 | SNV | Missense_Mutation | c.602N>T | p.Ser201Phe | p.S201F | Q9Y6R4 | protein_coding | deleterious(0) | probably_damaging(0.994) | TCGA-5L-AAT0-01 | Breast | breast invasive carcinoma | Female | <65 | I/II | Hormone Therapy | tamoxiphen | SD | |
| MAP3K4 | SNV | Missense_Mutation | c.4109N>G | p.Ala1370Gly | p.A1370G | Q9Y6R4 | protein_coding | deleterious(0) | probably_damaging(0.999) | TCGA-AC-A4ZE-01 | Breast | breast invasive carcinoma | Female | <65 | I/II | Unknown | Unknown | SD | |
| MAP3K4 | SNV | Missense_Mutation | c.4076N>G | p.Thr1359Ser | p.T1359S | Q9Y6R4 | protein_coding | tolerated(0.13) | probably_damaging(0.981) | TCGA-AN-A0AK-01 | Breast | breast invasive carcinoma | Female | >=65 | I/II | Unknown | Unknown | SD | |
| MAP3K4 | SNV | Missense_Mutation | novel | c.3309N>C | p.Glu1103Asp | p.E1103D | Q9Y6R4 | protein_coding | tolerated(0.41) | probably_damaging(0.99) | TCGA-AQ-A04H-01 | Breast | breast invasive carcinoma | Female | <65 | III/IV | Chemotherapy | taxotere | SD |
| MAP3K4 | SNV | Missense_Mutation | c.1340C>T | p.Thr447Ile | p.T447I | Q9Y6R4 | protein_coding | tolerated(0.18) | benign(0.189) | TCGA-B6-A0IC-01 | Breast | breast invasive carcinoma | Female | >=65 | I/II | Unknown | Unknown | SD | |
| MAP3K4 | SNV | Missense_Mutation | novel | c.3635N>G | p.Ser1212Cys | p.S1212C | Q9Y6R4 | protein_coding | tolerated(0.19) | benign(0.001) | TCGA-LD-A74U-01 | Breast | breast invasive carcinoma | Female | >=65 | III/IV | Chemotherapy | taxotere | SD |
| MAP3K4 | SNV | Missense_Mutation | novel | c.4030N>G | p.Gln1344Glu | p.Q1344E | Q9Y6R4 | protein_coding | deleterious(0) | probably_damaging(0.994) | TCGA-OL-A97C-01 | Breast | breast invasive carcinoma | Female | >=65 | I/II | Unknown | Unknown | PD |
| MAP3K4 | insertion | Nonsense_Mutation | novel | c.1267_1268insCTCATTCATGTTAGACTCA | p.Gly423AlafsTer5 | p.G423Afs*5 | Q9Y6R4 | protein_coding | TCGA-A8-A09D-01 | Breast | breast invasive carcinoma | Female | <65 | I/II | Chemotherapy | doxorubicin | CR | ||
| MAP3K4 | insertion | Frame_Shift_Ins | novel | c.664_665insA | p.Arg222GlnfsTer6 | p.R222Qfs*6 | Q9Y6R4 | protein_coding | TCGA-AO-A0JI-01 | Breast | breast invasive carcinoma | Female | <65 | I/II | Chemotherapy | cyclophosphamide | SD | ||
| MAP3K4 | insertion | Frame_Shift_Ins | novel | c.665_666insCTTCATAT | p.Leu223PhefsTer4 | p.L223Ffs*4 | Q9Y6R4 | protein_coding | TCGA-AO-A0JI-01 | Breast | breast invasive carcinoma | Female | <65 | I/II | Chemotherapy | cyclophosphamide | SD |
| Page: 1 2 3 4 5 6 7 8 9 10 11 12 13 14 15 16 17 18 19 20 21 22 |
Top |
Related drugs of malignant transformation related genes |
| Identification of chemicals and drugs interact with genes involved in malignant transfromation |
| (DGIdb 4.0) |
| Entrez ID | Symbol | Category | Interaction Types | Drug Claim Name | Drug Name | PMIDs |
| Page: 1 |

Copyright 2023-Present -The University of Texas Health Science Center at Houston |