
|
|||||
|
 | |
| |
| |
| |
| |
| |
|
Gene: MAGEA3 |
Gene summary for MAGEA3 |
| Gene information | Species | Human | Gene symbol | MAGEA3 | Gene ID | 4102 |
| Gene name | MAGE family member A3 | |
| Gene Alias | CT1.3 | |
| Cytomap | Xq28 | |
| Gene Type | protein-coding | GO ID | GO:0000122 | UniProtAcc | P43357 |
Top |
Malignant transformation analysis |
| Identification of the aberrant gene expression in precancerous and cancerous lesions by comparing the gene expression of stem-like cells in diseased tissues with normal stem cells |
| Entrez ID | Symbol | Replicates | Species | Organ | Tissue | Adj P-value | Log2FC | Malignancy |
| 4102 | MAGEA3 | LZE2T | Human | Esophagus | ESCC | 7.52e-18 | 1.19e+00 | 0.082 |
| 4102 | MAGEA3 | LZE4T | Human | Esophagus | ESCC | 2.06e-46 | 1.15e+00 | 0.0811 |
| 4102 | MAGEA3 | LZE5T | Human | Esophagus | ESCC | 1.57e-03 | 3.08e-01 | 0.0514 |
| 4102 | MAGEA3 | LZE8T | Human | Esophagus | ESCC | 6.02e-35 | 1.06e+00 | 0.067 |
| 4102 | MAGEA3 | LZE22D1 | Human | Esophagus | HGIN | 4.30e-07 | 4.26e-01 | 0.0595 |
| 4102 | MAGEA3 | LZE22T | Human | Esophagus | ESCC | 1.02e-18 | 1.36e+00 | 0.068 |
| 4102 | MAGEA3 | LZE24T | Human | Esophagus | ESCC | 5.14e-70 | 1.79e+00 | 0.0596 |
| 4102 | MAGEA3 | LZE22D3 | Human | Esophagus | HGIN | 4.92e-04 | 7.78e-01 | 0.0653 |
| 4102 | MAGEA3 | P1T-E | Human | Esophagus | ESCC | 1.83e-27 | 1.95e+00 | 0.0875 |
| 4102 | MAGEA3 | P2T-E | Human | Esophagus | ESCC | 6.31e-48 | 8.37e-01 | 0.1177 |
| 4102 | MAGEA3 | P4T-E | Human | Esophagus | ESCC | 1.23e-56 | 1.14e+00 | 0.1323 |
| 4102 | MAGEA3 | P5T-E | Human | Esophagus | ESCC | 5.53e-63 | 1.28e+00 | 0.1327 |
| 4102 | MAGEA3 | P9T-E | Human | Esophagus | ESCC | 5.27e-53 | 1.16e+00 | 0.1131 |
| 4102 | MAGEA3 | P11T-E | Human | Esophagus | ESCC | 6.73e-20 | 8.07e-01 | 0.1426 |
| 4102 | MAGEA3 | P15T-E | Human | Esophagus | ESCC | 2.56e-55 | 1.12e+00 | 0.1149 |
| 4102 | MAGEA3 | P17T-E | Human | Esophagus | ESCC | 1.36e-23 | 1.21e+00 | 0.1278 |
| 4102 | MAGEA3 | P19T-E | Human | Esophagus | ESCC | 1.65e-10 | 1.49e+00 | 0.1662 |
| 4102 | MAGEA3 | P20T-E | Human | Esophagus | ESCC | 3.59e-80 | 1.69e+00 | 0.1124 |
| 4102 | MAGEA3 | P21T-E | Human | Esophagus | ESCC | 3.75e-03 | 1.76e-01 | 0.1617 |
| 4102 | MAGEA3 | P23T-E | Human | Esophagus | ESCC | 1.60e-80 | 2.32e+00 | 0.108 |
| Page: 1 2 3 4 |
| Tissue | Expression Dynamics | Abbreviation |
| Esophagus | 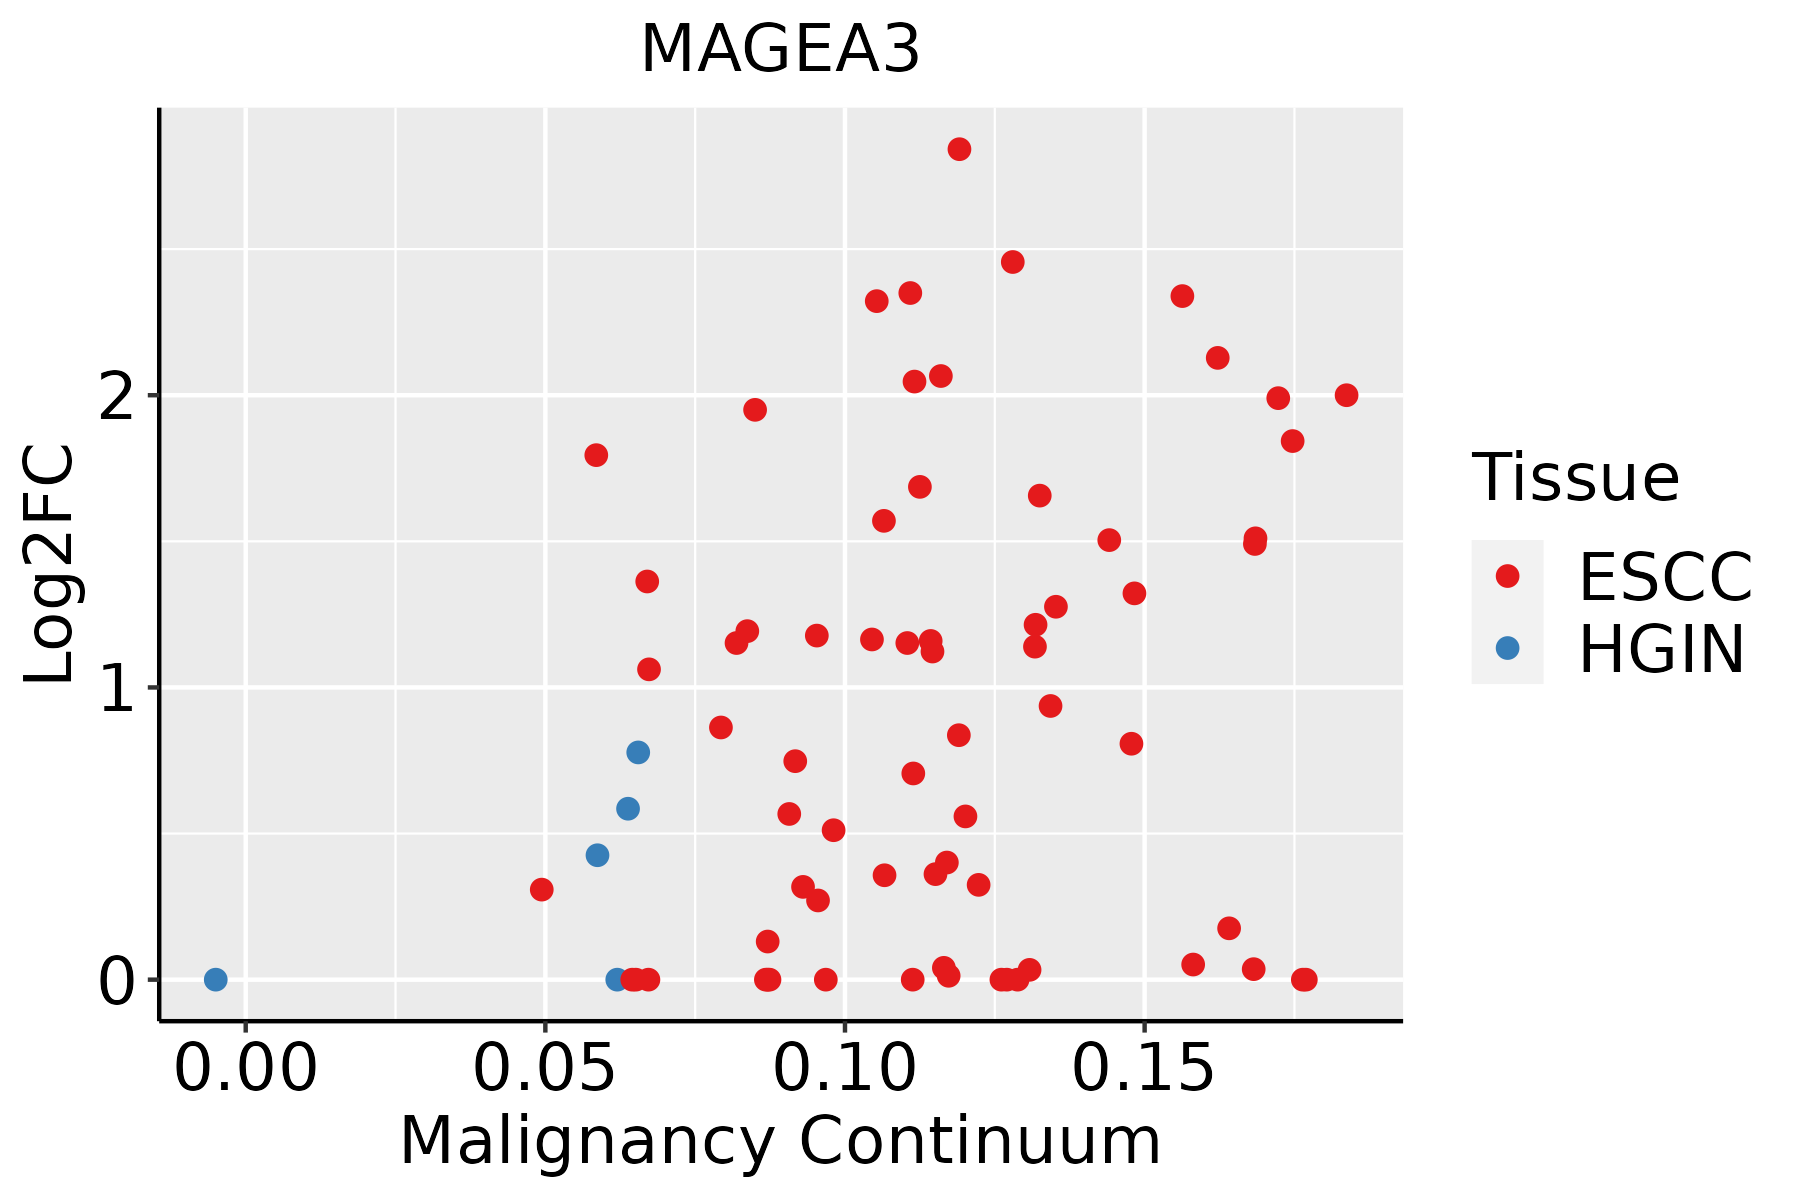 | ESCC: Esophageal squamous cell carcinoma |
| HGIN: High-grade intraepithelial neoplasias | ||
| LGIN: Low-grade intraepithelial neoplasias | ||
| Liver | 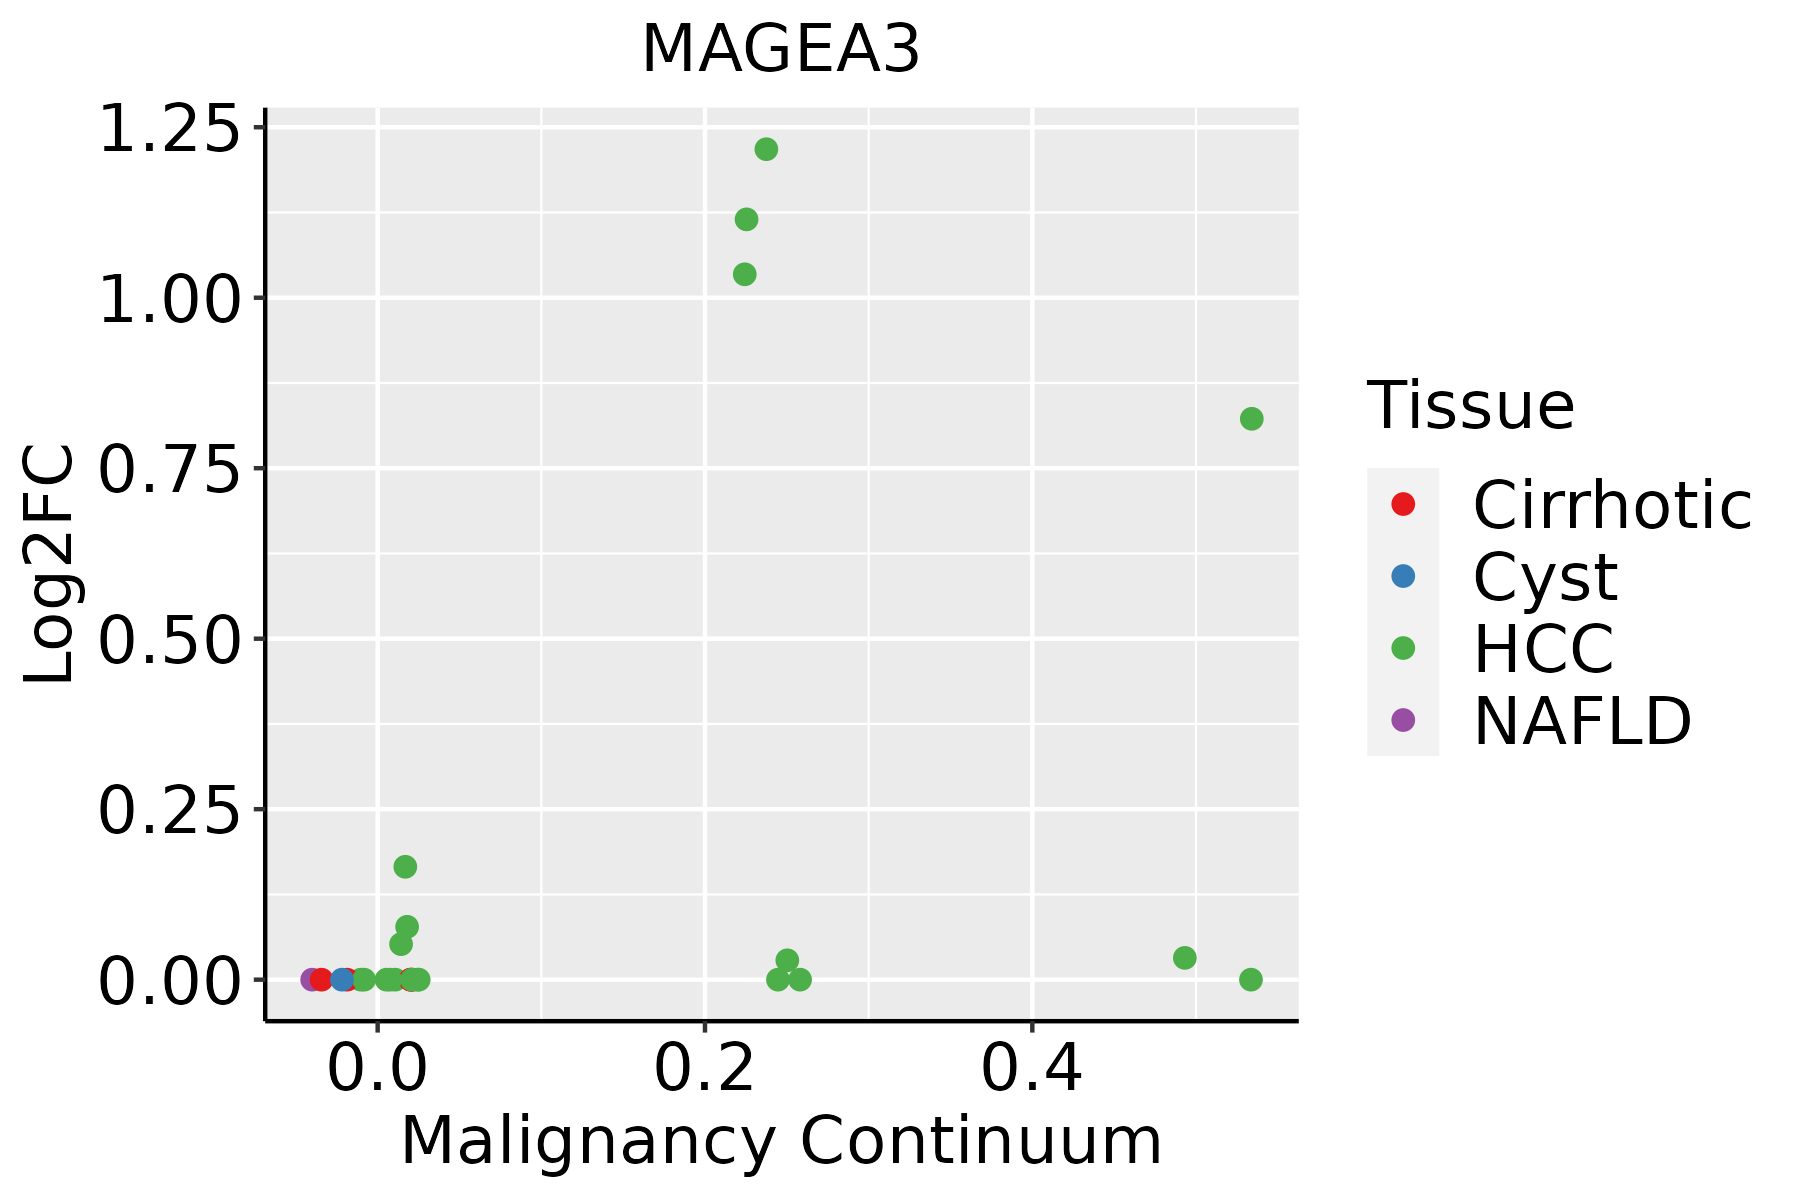 | HCC: Hepatocellular carcinoma |
| NAFLD: Non-alcoholic fatty liver disease | ||
| Oral Cavity | 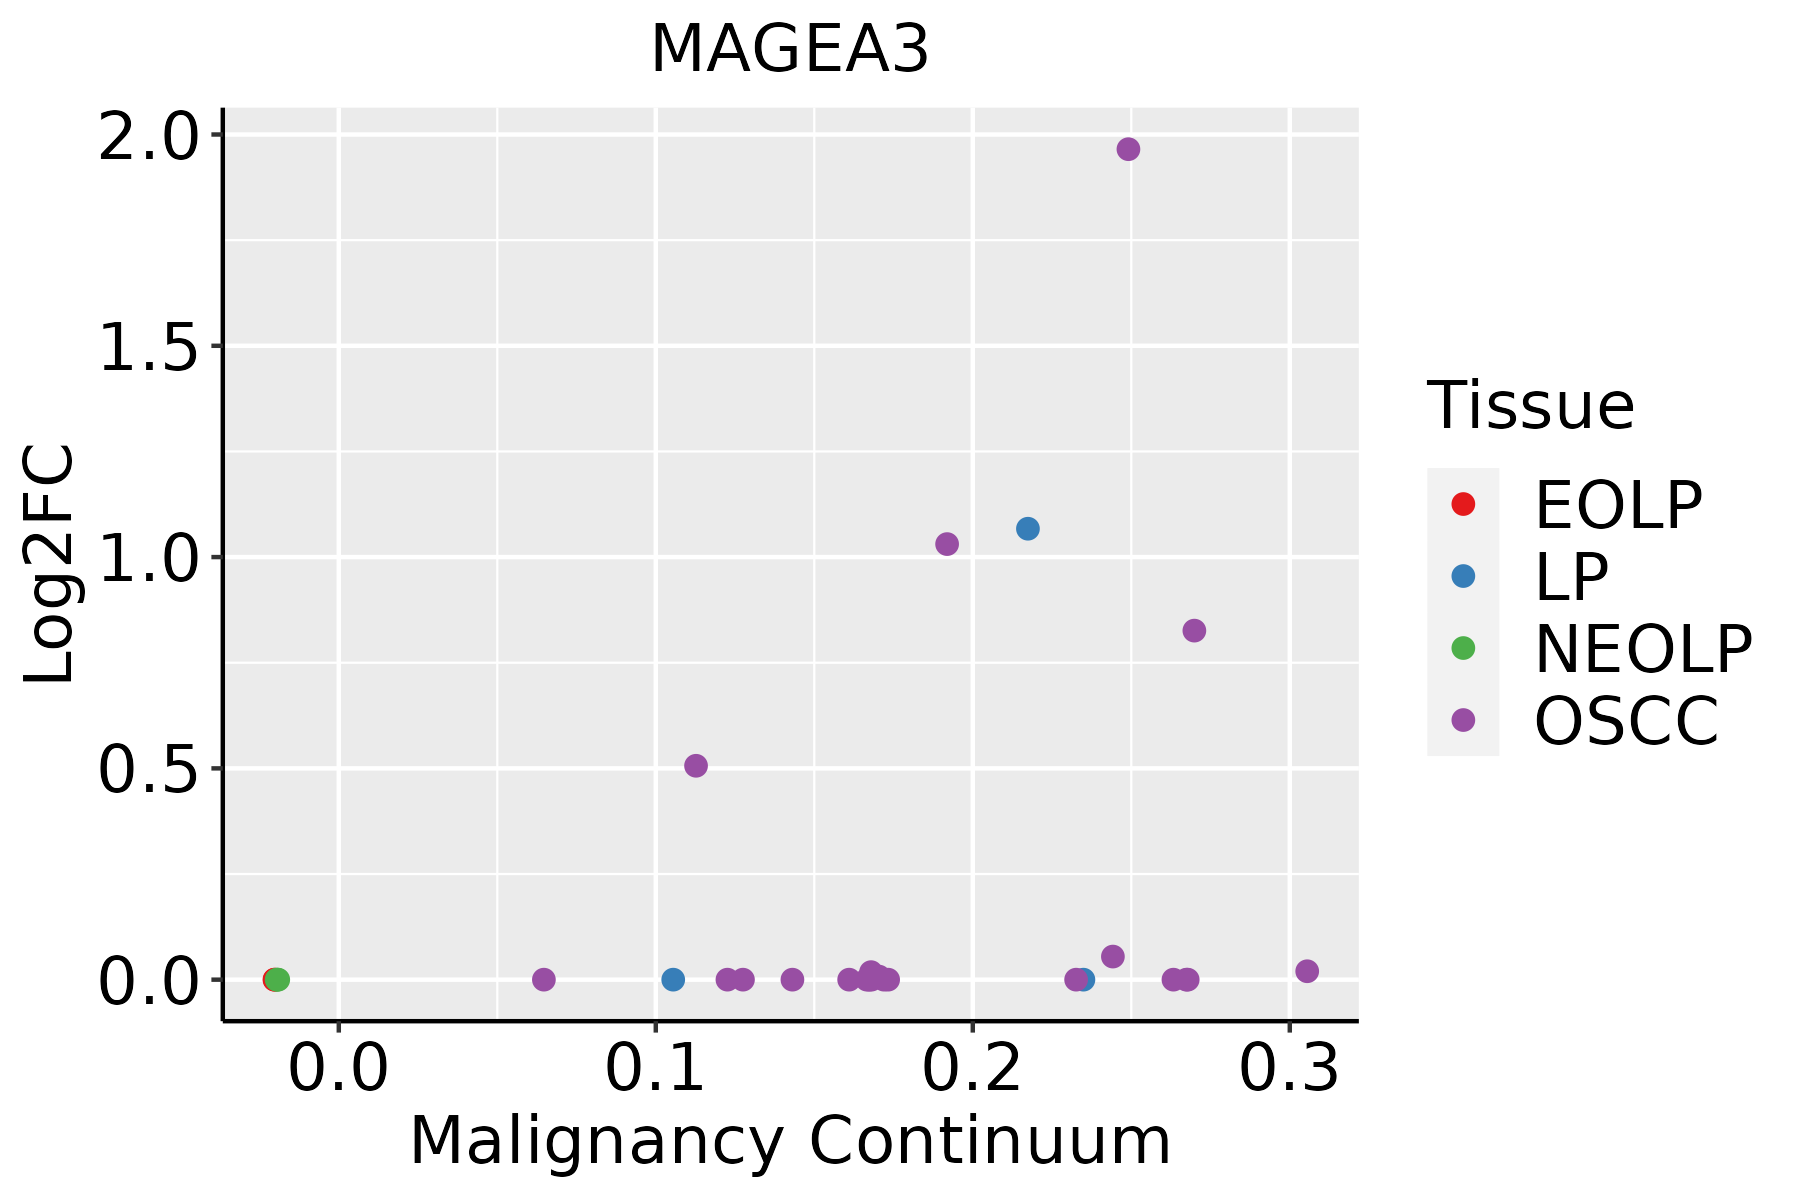 | EOLP: Erosive Oral lichen planus |
| LP: leukoplakia | ||
| NEOLP: Non-erosive oral lichen planus | ||
| OSCC: Oral squamous cell carcinoma | ||
| Thyroid | 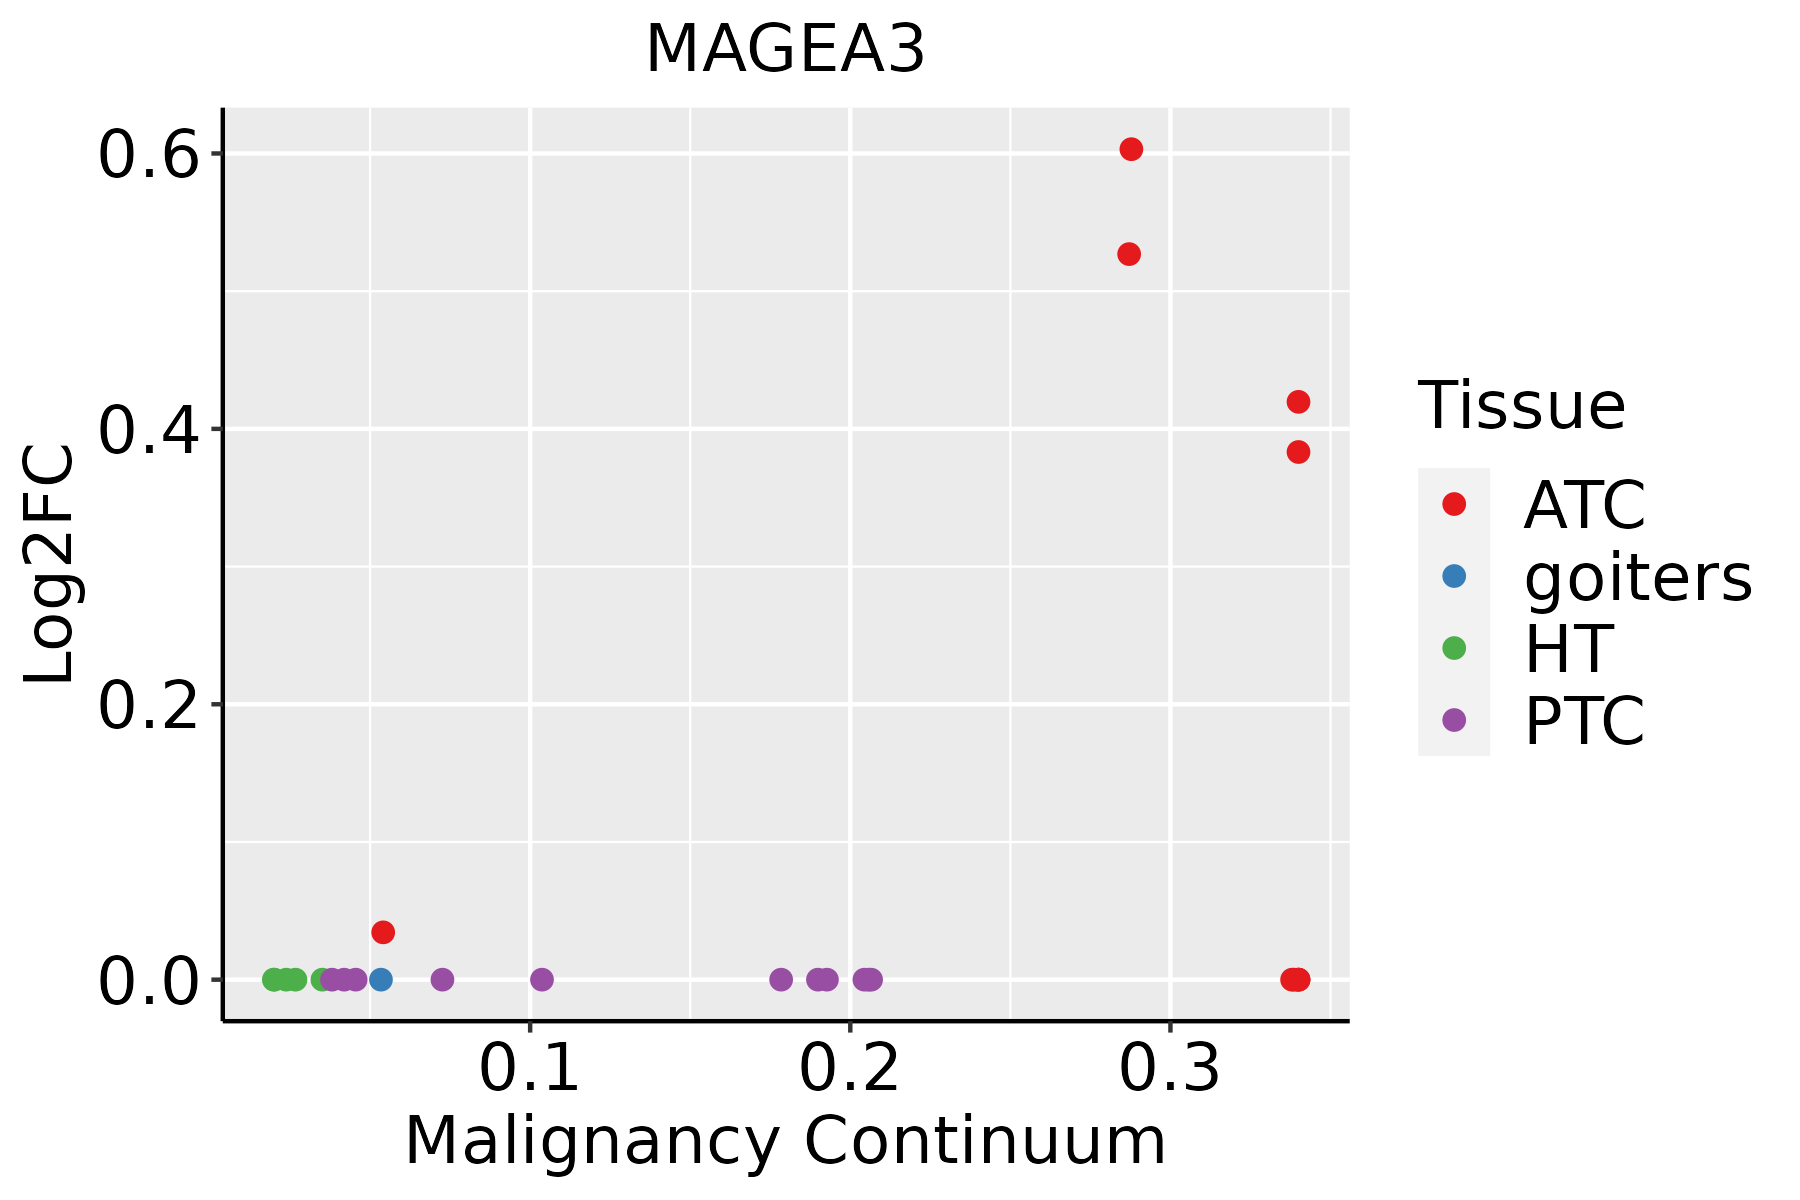 | ATC: Anaplastic thyroid cancer |
| HT: Hashimoto's thyroiditis | ||
| PTC: Papillary thyroid cancer |
| ∗log2FC in expression of this searched gene in stem-like cells from each diseased tissue sample relative to stem-like cells in normal samples in each tissue plotted against the malignancy continuum. Samples are colored based on if they are from different disease stage. |
Top |
Malignant transformation related pathway analysis |
| Find out the enriched GO biological processes and KEGG pathways involved in transition from healthy to precancer to cancer |
| Tissue | Disease Stage | Enriched GO biological Processes |
| Colorectum | AD |  |
| Colorectum | SER |  |
| Colorectum | MSS |  |
| Colorectum | MSI-H |  |
| Colorectum | FAP |  |
| ∗Top 15 enriched GO BP terms are showed in the bar plot of each disease state in each tissue. Each row represents a significant GO biological process which is colored according to the -log10(p.adjust). |
| Page: 1 2 3 4 5 6 7 8 9 |
| GO ID | Tissue | Disease Stage | Description | Gene Ratio | Bg Ratio | pvalue | p.adjust | Count |
| GO:001050711 | Oral cavity | LP | negative regulation of autophagy | 38/4623 | 85/18723 | 4.36e-05 | 6.24e-04 | 38 |
| GO:1902236110 | Oral cavity | LP | negative regulation of endoplasmic reticulum stress-induced intrinsic apoptotic signaling pathway | 13/4623 | 20/18723 | 1.59e-04 | 1.79e-03 | 13 |
| GO:190331711 | Oral cavity | LP | regulation of protein maturation | 29/4623 | 67/18723 | 6.51e-04 | 5.90e-03 | 29 |
| GO:007061311 | Oral cavity | LP | regulation of protein processing | 28/4623 | 65/18723 | 8.77e-04 | 7.59e-03 | 28 |
| GO:001046619 | Oral cavity | LP | negative regulation of peptidase activity | 87/4623 | 262/18723 | 1.12e-03 | 9.19e-03 | 87 |
| GO:005134619 | Oral cavity | LP | negative regulation of hydrolase activity | 120/4623 | 379/18723 | 1.16e-03 | 9.48e-03 | 120 |
| GO:00109551 | Oral cavity | LP | negative regulation of protein processing | 15/4623 | 29/18723 | 1.55e-03 | 1.20e-02 | 15 |
| GO:19033181 | Oral cavity | LP | negative regulation of protein maturation | 15/4623 | 29/18723 | 1.55e-03 | 1.20e-02 | 15 |
| GO:001095118 | Oral cavity | LP | negative regulation of endopeptidase activity | 83/4623 | 252/18723 | 1.86e-03 | 1.39e-02 | 83 |
| GO:003497633 | Thyroid | ATC | response to endoplasmic reticulum stress | 167/6293 | 256/18723 | 2.62e-25 | 1.03e-22 | 167 |
| GO:200123335 | Thyroid | ATC | regulation of apoptotic signaling pathway | 206/6293 | 356/18723 | 2.81e-21 | 5.92e-19 | 206 |
| GO:009719335 | Thyroid | ATC | intrinsic apoptotic signaling pathway | 171/6293 | 288/18723 | 1.86e-19 | 2.67e-17 | 171 |
| GO:001050632 | Thyroid | ATC | regulation of autophagy | 180/6293 | 317/18723 | 1.34e-17 | 1.46e-15 | 180 |
| GO:200124233 | Thyroid | ATC | regulation of intrinsic apoptotic signaling pathway | 103/6293 | 164/18723 | 1.67e-14 | 9.77e-13 | 103 |
| GO:2001234210 | Thyroid | ATC | negative regulation of apoptotic signaling pathway | 129/6293 | 224/18723 | 1.26e-13 | 6.46e-12 | 129 |
| GO:200124333 | Thyroid | ATC | negative regulation of intrinsic apoptotic signaling pathway | 63/6293 | 98/18723 | 4.97e-10 | 1.33e-08 | 63 |
| GO:003133035 | Thyroid | ATC | negative regulation of cellular catabolic process | 136/6293 | 262/18723 | 6.47e-10 | 1.71e-08 | 136 |
| GO:000989529 | Thyroid | ATC | negative regulation of catabolic process | 159/6293 | 320/18723 | 1.61e-09 | 3.99e-08 | 159 |
| GO:190589728 | Thyroid | ATC | regulation of response to endoplasmic reticulum stress | 54/6293 | 82/18723 | 2.34e-09 | 5.58e-08 | 54 |
| GO:0070059113 | Thyroid | ATC | intrinsic apoptotic signaling pathway in response to endoplasmic reticulum stress | 43/6293 | 63/18723 | 1.98e-08 | 3.90e-07 | 43 |
| Page: 1 2 3 4 5 6 7 8 9 |
| Pathway ID | Tissue | Disease Stage | Description | Gene Ratio | Bg Ratio | pvalue | p.adjust | qvalue | Count |
| Page: 1 |
Top |
Cell-cell communication analysis |
| Identification of potential cell-cell interactions between two cell types and their ligand-receptor pairs for different disease states |
| Ligand | Receptor | LRpair | Pathway | Tissue | Disease Stage |
| Page: 1 |
Top |
Single-cell gene regulatory network inference analysis |
| Find out the significant the regulons (TFs) and the target genes of each regulon across cell types for different disease states |
| TF | Cell Type | Tissue | Disease Stage | Target Gene | RSS | Regulon Activity |
| ∗The dot plots of a searched regulon are shown for all cell subpopulations in each disease state of each tissue based on the regulon specific score inferred using pySCENIC and by calculating the average expression. |
| Page: 1 |
Top |
Somatic mutation of malignant transformation related genes |
| Annotation of somatic variants for genes involved in malignant transformation |
| Hugo Symbol | Variant Class | Variant Classification | dbSNP RS | HGVSc | HGVSp | HGVSp Short | SWISSPROT | BIOTYPE | SIFT | PolyPhen | Tumor Sample Barcode | Tissue | Histology | Sex | Age | Stage | Therapy Types | Drugs | Outcome |
| MAGEA3 | SNV | Missense_Mutation | c.418N>A | p.Val140Ile | p.V140I | P43357 | protein_coding | tolerated(1) | benign(0) | TCGA-AN-A0XU-01 | Breast | breast invasive carcinoma | Female | <65 | I/II | Unknown | Unknown | SD | |
| MAGEA3 | SNV | Missense_Mutation | novel | c.711N>G | p.Ser237Arg | p.S237R | P43357 | protein_coding | deleterious(0.02) | possibly_damaging(0.582) | TCGA-B6-A0IA-01 | Breast | breast invasive carcinoma | Female | <65 | I/II | Unknown | Unknown | SD |
| MAGEA3 | SNV | Missense_Mutation | c.940N>A | p.Glu314Lys | p.E314K | P43357 | protein_coding | deleterious(0.02) | probably_damaging(0.994) | TCGA-D8-A1J9-01 | Breast | breast invasive carcinoma | Female | <65 | I/II | Unknown | Unknown | SD | |
| MAGEA3 | insertion | Frame_Shift_Ins | novel | c.763_764insCTCCTACGATGGCCTGCTGGGTG | p.Tyr255SerfsTer38 | p.Y255Sfs*38 | P43357 | protein_coding | TCGA-A8-A09M-01 | Breast | breast invasive carcinoma | Female | >=65 | III/IV | Chemotherapy | paclitaxel | CR | ||
| MAGEA3 | SNV | Missense_Mutation | c.326N>A | p.Leu109His | p.L109H | P43357 | protein_coding | deleterious(0) | possibly_damaging(0.886) | TCGA-C5-A1MH-01 | Cervix | cervical & endocervical cancer | Female | >=65 | III/IV | Chemotherapy | cisplatin | PD | |
| MAGEA3 | SNV | Missense_Mutation | c.892C>T | p.His298Tyr | p.H298Y | P43357 | protein_coding | deleterious(0.01) | benign(0.05) | TCGA-EK-A2PG-01 | Cervix | cervical & endocervical cancer | Female | >=65 | I/II | Unknown | Unknown | SD | |
| MAGEA3 | SNV | Missense_Mutation | novel | c.295N>A | p.Pro99Thr | p.P99T | P43357 | protein_coding | tolerated(0.1) | benign(0.231) | TCGA-VS-A8EC-01 | Cervix | cervical & endocervical cancer | Female | <65 | III/IV | Chemotherapy | carboplatin | CR |
| MAGEA3 | SNV | Missense_Mutation | novel | c.296N>T | p.Pro99Leu | p.P99L | P43357 | protein_coding | deleterious(0.01) | benign(0.231) | TCGA-VS-A8EC-01 | Cervix | cervical & endocervical cancer | Female | <65 | III/IV | Chemotherapy | carboplatin | CR |
| MAGEA3 | SNV | Missense_Mutation | novel | c.228N>G | p.Asn76Lys | p.N76K | P43357 | protein_coding | tolerated(0.98) | benign(0.076) | TCGA-VS-A8EI-01 | Cervix | cervical & endocervical cancer | Female | <65 | I/II | Chemotherapy | cisplatin | CR |
| MAGEA3 | SNV | Missense_Mutation | novel | c.151G>T | p.Gly51Trp | p.G51W | P43357 | protein_coding | deleterious(0.02) | probably_damaging(0.955) | TCGA-ZJ-AB0I-01 | Cervix | cervical & endocervical cancer | Female | <65 | I/II | Unknown | Unknown | SD |
| Page: 1 2 3 4 5 |
Top |
Related drugs of malignant transformation related genes |
| Identification of chemicals and drugs interact with genes involved in malignant transfromation |
| (DGIdb 4.0) |
| Entrez ID | Symbol | Category | Interaction Types | Drug Claim Name | Drug Name | PMIDs |
| 4102 | MAGEA3 | ENZYME, DRUGGABLE GENOME | Astuprotimut-R | ASTUPROTIMUT-R | ||
| 4102 | MAGEA3 | ENZYME, DRUGGABLE GENOME | KITE-718 | |||
| 4102 | MAGEA3 | ENZYME, DRUGGABLE GENOME | vaccine | EP-2101 | ||
| 4102 | MAGEA3 | ENZYME, DRUGGABLE GENOME | GL-0817 | BIROPEPIMUT-S | ||
| 4102 | MAGEA3 | ENZYME, DRUGGABLE GENOME | MAGE-A3 | ASTUPROTIMUT-R | ||
| 4102 | MAGEA3 | ENZYME, DRUGGABLE GENOME | vaccine | GSK1572932A | ASTUPROTIMUT-R | |
| 4102 | MAGEA3 | ENZYME, DRUGGABLE GENOME | INCOMPLETE FREUND&APOS;S ADJUVANT | 10546159 | ||
| 4102 | MAGEA3 | ENZYME, DRUGGABLE GENOME | DNA VACCINE | 15750833 | ||
| 4102 | MAGEA3 | ENZYME, DRUGGABLE GENOME | Polynoma-1 | |||
| 4102 | MAGEA3 | ENZYME, DRUGGABLE GENOME | IDM-2101 |
| Page: 1 |

Copyright 2023-Present -The University of Texas Health Science Center at Houston |