Schematic overview of the cellular and molecular mechanisms involved in the cancer progression, including the proposed cellular and molecular mechanisms in cancer cells trajectory. AT1: alveolar type 1 cells; AT2: alveolar type 2 cells; AAH: atypical adenomatous hyperplasia; AIS: adenocarcinoma in situ; MIA: minimally invasive adenocarcinoma; IA: invasive adenocarcinoma; EMT: epithelial-mesenchymal transition

Home

Download

Statistics

Help

Contact

Center for Computational Systems Medicine
leaf

Gene summary

leaf

Malignant transformation analysis

leaf

Malignant transformation related pathway analysis

leaf

Cell-cell communication analysis

leaf

Single-cell gene regulatory network inference analysis

leaf

Somatic mutation of malignant transformation related genes

leaf

Related drugs of malignant transformation related genes

Gene: LUC7L

Gene summary for LUC7L

check button Gene summary.

Gene informationSpeciesHuman
Gene symbol

LUC7L

Gene ID

55692

Gene nameLUC7 like
Gene AliasLUC7B1
Cytomap16p13.3
Gene Typeprotein-coding
GO ID

GO:0000245

UniProtAcc

Q1W6G4


Top

Malignant transformation analysis

check button Identification of the aberrant gene expression in precancerous and cancerous lesions by comparing the gene expression of stem-like cells in diseased tissues with normal stem cells
check button Malignant transformation involving gene list.
Entrez IDSymbolReplicatesSpeciesOrganTissueAdj P-valueLog2FCMalignancy
55692LUC7LHTA11_3410_2000001011HumanColorectumAD1.00e-02-3.25e-010.0155
55692LUC7LA015-C-203HumanColorectumFAP1.87e-221.94e-01-0.1294
55692LUC7LA015-C-204HumanColorectumFAP3.02e-022.22e-01-0.0228
55692LUC7LA002-C-201HumanColorectumFAP1.85e-071.51e-010.0324
55692LUC7LA001-C-119HumanColorectumFAP1.20e-166.63e-01-0.1557
55692LUC7LA001-C-108HumanColorectumFAP5.02e-152.76e-01-0.0272
55692LUC7LA002-C-205HumanColorectumFAP2.14e-193.08e-01-0.1236
55692LUC7LA001-C-104HumanColorectumFAP2.57e-073.21e-010.0184
55692LUC7LA015-C-006HumanColorectumFAP2.78e-122.99e-01-0.0994
55692LUC7LA015-C-106HumanColorectumFAP1.03e-081.06e-01-0.0511
55692LUC7LA002-C-114HumanColorectumFAP1.64e-111.77e-01-0.1561
55692LUC7LA015-C-104HumanColorectumFAP3.89e-262.74e-01-0.1899
55692LUC7LA001-C-014HumanColorectumFAP3.66e-091.59e-010.0135
55692LUC7LA002-C-016HumanColorectumFAP1.70e-138.73e-020.0521
55692LUC7LA015-C-002HumanColorectumFAP2.37e-055.51e-02-0.0763
55692LUC7LA001-C-203HumanColorectumFAP2.75e-071.50e-01-0.0481
55692LUC7LA002-C-116HumanColorectumFAP9.86e-248.67e-02-0.0452
55692LUC7LA014-C-008HumanColorectumFAP5.08e-091.46e-01-0.191
55692LUC7LA018-E-020HumanColorectumFAP7.04e-142.26e-01-0.2034
55692LUC7LF034HumanColorectumFAP1.36e-172.54e-01-0.0665
Page: 1 2 3 4 5 6 7 

check button Transcriptomic changes along malignancy continuum.
TissueExpression DynamicsAbbreviation
Colorectum (GSE201348)The image shows the transcriptomic changes along malignancy continuum.log2FC in expression of this searched gene in stem-like cells from each diseased tissue sample relative to stem-like cells in normal samples in each tissue plotted against the malignancy continuum. Samples are colored based on if they are from different disease stage.FAP: Familial adenomatous polyposis
CRC: Colorectal cancer
Colorectum (HTA11)The image shows the transcriptomic changes along malignancy continuum.log2FC in expression of this searched gene in stem-like cells from each diseased tissue sample relative to stem-like cells in normal samples in each tissue plotted against the malignancy continuum. Samples are colored based on if they are from different disease stage.AD: Adenomas
SER: Sessile serrated lesions
MSI-H: Microsatellite-high colorectal cancer
MSS: Microsatellite stable colorectal cancer
EsophagusThe image shows the transcriptomic changes along malignancy continuum.log2FC in expression of this searched gene in stem-like cells from each diseased tissue sample relative to stem-like cells in normal samples in each tissue plotted against the malignancy continuum. Samples are colored based on if they are from different disease stage.
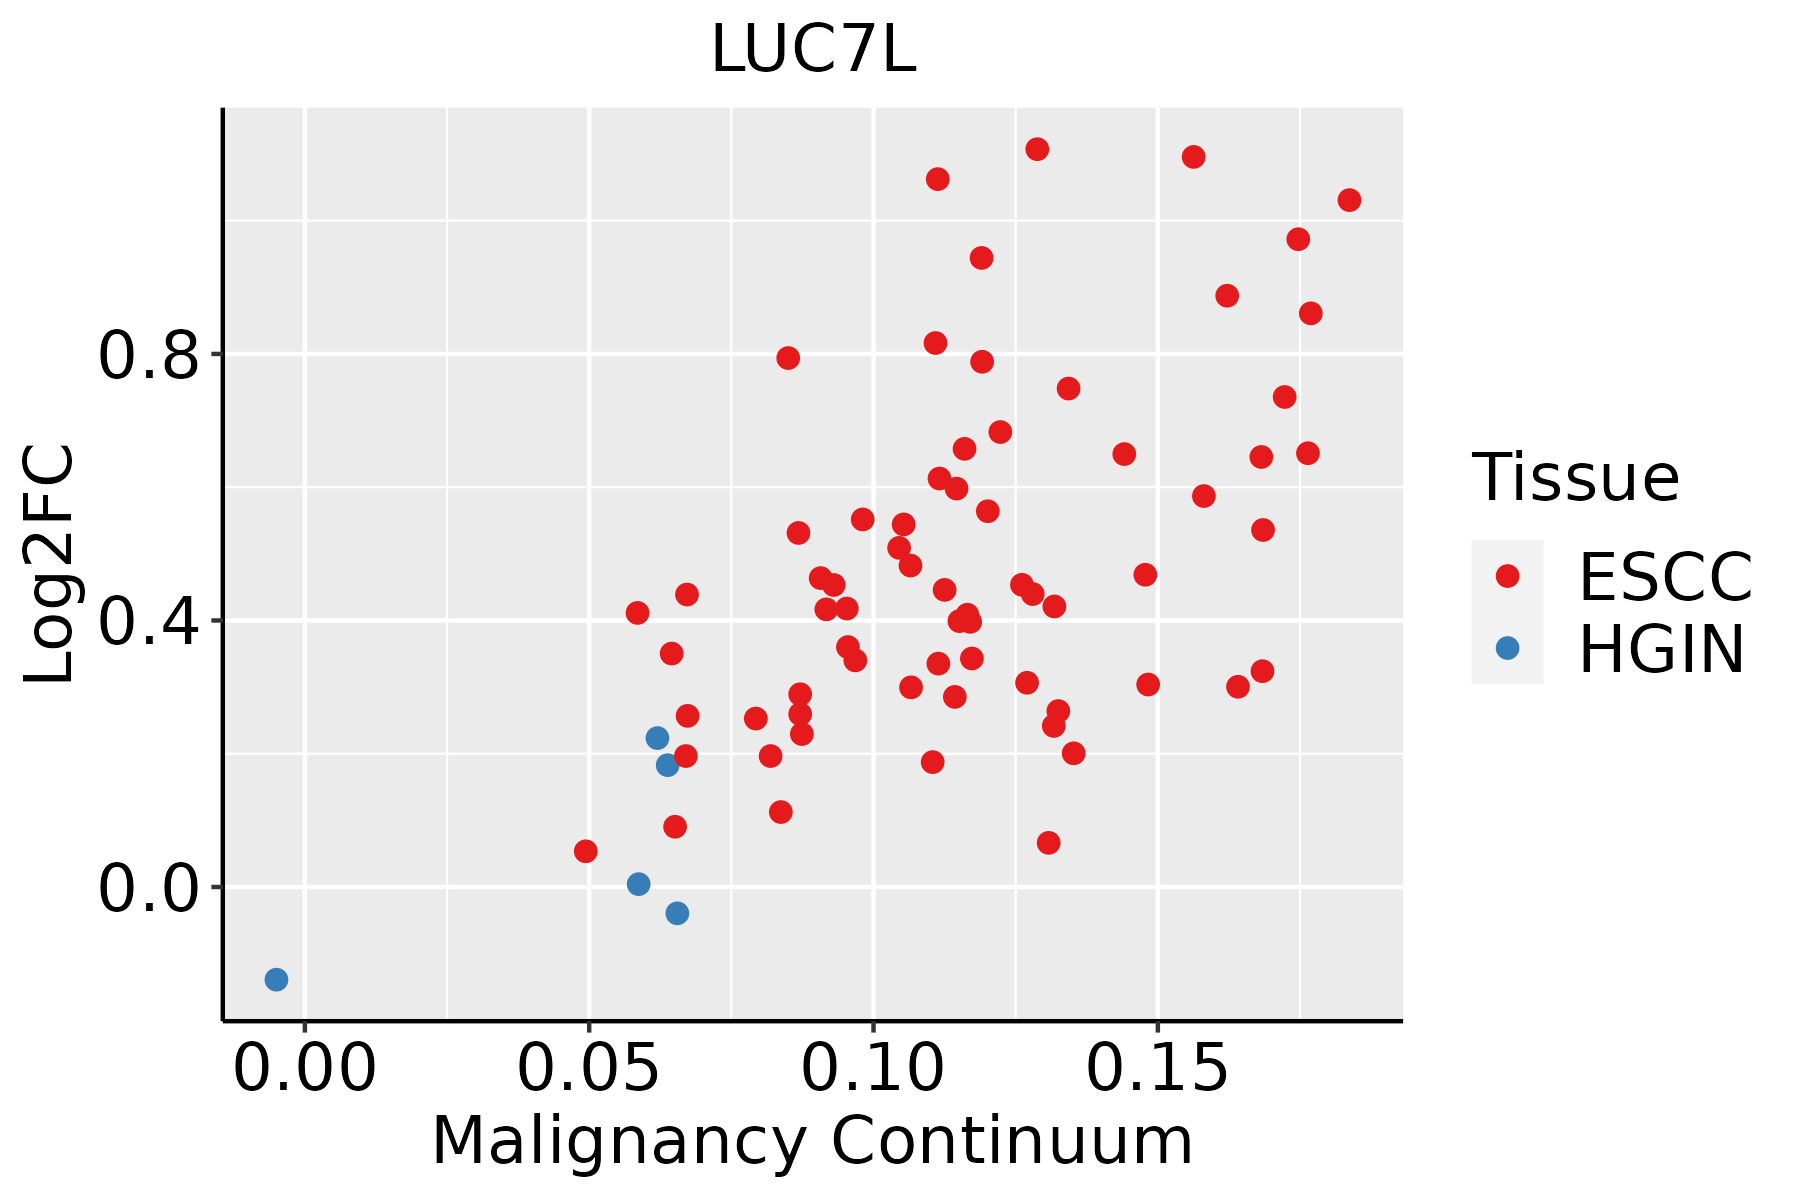
ESCC: Esophageal squamous cell carcinoma
HGIN: High-grade intraepithelial neoplasias
LGIN: Low-grade intraepithelial neoplasias
LiverThe image shows the transcriptomic changes along malignancy continuum.log2FC in expression of this searched gene in stem-like cells from each diseased tissue sample relative to stem-like cells in normal samples in each tissue plotted against the malignancy continuum. Samples are colored based on if they are from different disease stage.HCC: Hepatocellular carcinoma
NAFLD: Non-alcoholic fatty liver disease
Oral CavityThe image shows the transcriptomic changes along malignancy continuum.log2FC in expression of this searched gene in stem-like cells from each diseased tissue sample relative to stem-like cells in normal samples in each tissue plotted against the malignancy continuum. Samples are colored based on if they are from different disease stage.EOLP: Erosive Oral lichen planus
LP: leukoplakia
NEOLP: Non-erosive oral lichen planus
OSCC: Oral squamous cell carcinoma
SkinThe image shows the transcriptomic changes along malignancy continuum.log2FC in expression of this searched gene in stem-like cells from each diseased tissue sample relative to stem-like cells in normal samples in each tissue plotted against the malignancy continuum. Samples are colored based on if they are from different disease stage.
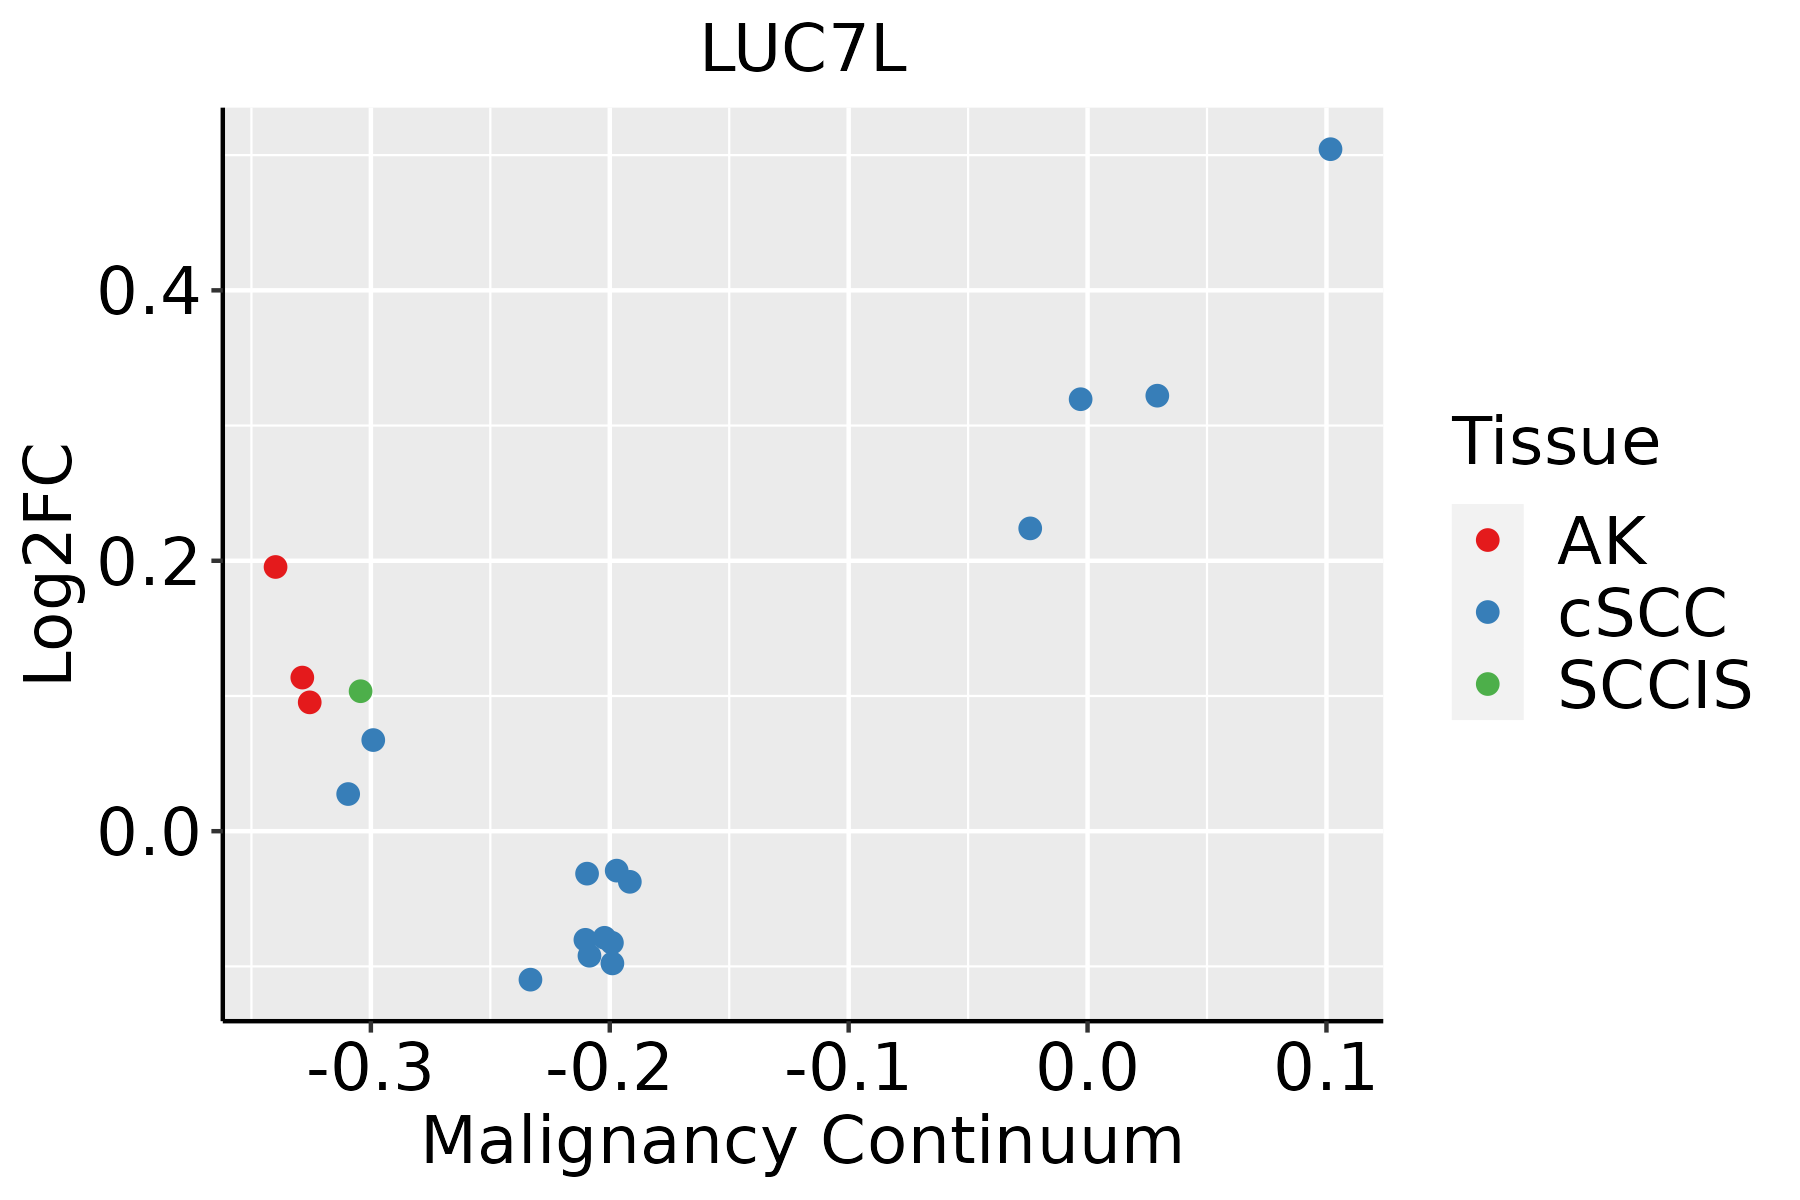
AK: Actinic keratosis
cSCC: Cutaneous squamous cell carcinoma
SCCIS:squamous cell carcinoma in situ
ThyroidThe image shows the transcriptomic changes along malignancy continuum.log2FC in expression of this searched gene in stem-like cells from each diseased tissue sample relative to stem-like cells in normal samples in each tissue plotted against the malignancy continuum. Samples are colored based on if they are from different disease stage.
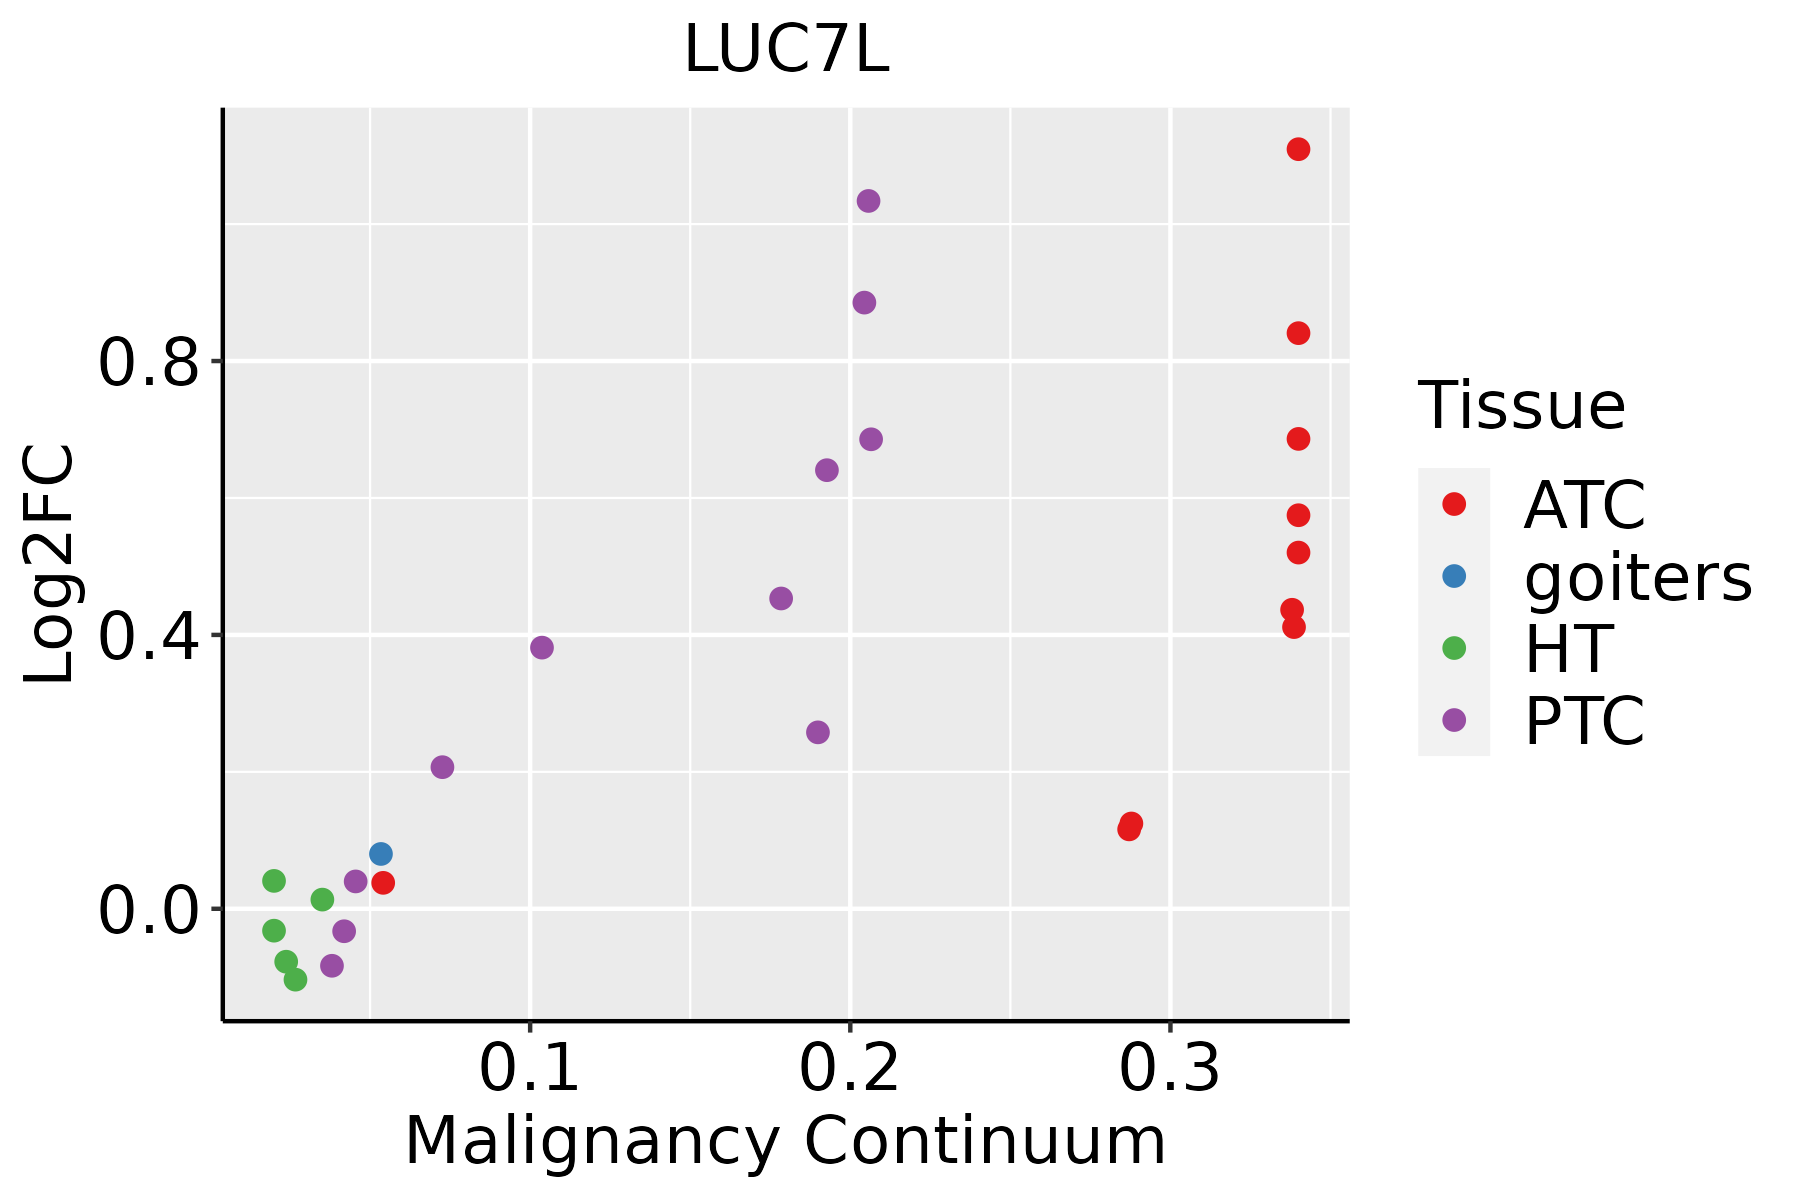
ATC: Anaplastic thyroid cancer
HT: Hashimoto's thyroiditis
PTC: Papillary thyroid cancer
∗log2FC in expression of this searched gene in stem-like cells from each diseased tissue sample relative to stem-like cells in normal samples in each tissue plotted against the malignancy continuum. Samples are colored based on if they are from different disease stage.

Top

Malignant transformation related pathway analysis

check buttonFind out the enriched GO biological processes and KEGG pathways involved in transition from healthy to precancer to cancer
check button Figure of enriched GO biological processes.
TissueDisease StageEnriched GO biological Processes
ColorectumADGO analysis - Figure of enriched GO biological processes: Top 15 enriched GO BP terms are showed in the bar plot of each disease state in each tissue. Each row represents a significant GO biological process which is colored according to the -log10(p.adjust).
ColorectumSERGO analysis - Figure of enriched GO biological processes: Top 15 enriched GO BP terms are showed in the bar plot of each disease state in each tissue. Each row represents a significant GO biological process which is colored according to the -log10(p.adjust).
ColorectumMSSGO analysis - Figure of enriched GO biological processes: Top 15 enriched GO BP terms are showed in the bar plot of each disease state in each tissue. Each row represents a significant GO biological process which is colored according to the -log10(p.adjust).
ColorectumMSI-HGO analysis - Figure of enriched GO biological processes: Top 15 enriched GO BP terms are showed in the bar plot of each disease state in each tissue. Each row represents a significant GO biological process which is colored according to the -log10(p.adjust).
ColorectumFAPGO analysis - Figure of enriched GO biological processes: Top 15 enriched GO BP terms are showed in the bar plot of each disease state in each tissue. Each row represents a significant GO biological process which is colored according to the -log10(p.adjust).
∗Top 15 enriched GO BP terms are showed in the bar plot of each disease state in each tissue. Each row represents a significant GO biological process which is colored according to the -log10(p.adjust).
Page: 1 2 3 4 5 6 7 8 9 

check button Enriched GO biological processes.
GO IDTissueDisease StageDescriptionGene RatioBg Ratiopvaluep.adjustCount
GO:002261323LungMIACribonucleoprotein complex biogenesis44/967463/187237.38e-053.47e-0344
GO:000037723LungMIACRNA splicing, via transesterification reactions with bulged adenosine as nucleophile33/967320/187231.27e-045.13e-0333
GO:000039823LungMIACmRNA splicing, via spliceosome33/967320/187231.27e-045.13e-0333
GO:000037523LungMIACRNA splicing, via transesterification reactions33/967324/187231.61e-046.19e-0333
GO:002261320Oral cavityOSCCribonucleoprotein complex biogenesis333/7305463/187238.28e-485.24e-44333
GO:000838020Oral cavityOSCCRNA splicing308/7305434/187232.43e-427.70e-39308
GO:000037519Oral cavityOSCCRNA splicing, via transesterification reactions225/7305324/187235.20e-292.99e-26225
GO:000037719Oral cavityOSCCRNA splicing, via transesterification reactions with bulged adenosine as nucleophile221/7305320/187235.50e-282.18e-25221
GO:000039819Oral cavityOSCCmRNA splicing, via spliceosome221/7305320/187235.50e-282.18e-25221
GO:007182620Oral cavityOSCCribonucleoprotein complex subunit organization152/7305227/187231.05e-171.01e-15152
GO:002261820Oral cavityOSCCribonucleoprotein complex assembly146/7305220/187231.53e-161.23e-14146
GO:00002456Oral cavityOSCCspliceosomal complex assembly45/730579/187239.13e-044.81e-0345
GO:0022613110Oral cavityLPribonucleoprotein complex biogenesis259/4623463/187237.20e-482.25e-44259
GO:0008380110Oral cavityLPRNA splicing237/4623434/187231.82e-413.79e-38237
GO:0000375110Oral cavityLPRNA splicing, via transesterification reactions181/4623324/187231.36e-331.70e-30181
GO:0000377110Oral cavityLPRNA splicing, via transesterification reactions with bulged adenosine as nucleophile179/4623320/187232.48e-332.22e-30179
GO:0000398110Oral cavityLPmRNA splicing, via spliceosome179/4623320/187232.48e-332.22e-30179
GO:0071826110Oral cavityLPribonucleoprotein complex subunit organization130/4623227/187237.54e-263.63e-23130
GO:0022618110Oral cavityLPribonucleoprotein complex assembly125/4623220/187231.76e-246.91e-22125
GO:000024513Oral cavityLPspliceosomal complex assembly34/462379/187232.65e-042.75e-0334
Page: 1 2 3 4 5 6 7 8 9 10 11 12 

check button Enriched KEGG pathways.
Pathway IDTissueDisease StageDescriptionGene RatioBg Ratiopvaluep.adjustqvalueCount
Page: 1 

Top

Cell-cell communication analysis

check buttonIdentification of potential cell-cell interactions between two cell types and their ligand-receptor pairs for different disease states
LigandReceptorLRpairPathwayTissueDisease Stage
Page: 1 

Top

Single-cell gene regulatory network inference analysis

check buttonFind out the significant the regulons (TFs) and the target genes of each regulon across cell types for different disease states
TFCell TypeTissueDisease StageTarget GeneRSSRegulon Activity
∗The dot plots of a searched regulon are shown for all cell subpopulations in each disease state of each tissue based on the regulon specific score inferred using pySCENIC and by calculating the average expression.
Page: 1 

Top

Somatic mutation of malignant transformation related genes

check buttonAnnotation of somatic variants for genes involved in malignant transformation
Hugo SymbolVariant ClassVariant ClassificationdbSNP RSHGVScHGVSpHGVSp ShortSWISSPROTBIOTYPESIFTPolyPhenTumor Sample BarcodeTissueHistologySexAgeStageTherapy TypesDrugsOutcome
LUC7LinsertionIn_Frame_Insnovelc.414_415insGGCCAGCTATGGTGGCTCTTGGCTTTAGTCTCAGCTGTTCGGGAGp.Ala138_Lys139insGlyGlnLeuTrpTrpLeuLeuAlaLeuValSerAlaValArgGlup.A138_K139insGQLWWLLALVSAVREQ9NQ29protein_codingTCGA-A2-A0CP-01Breastbreast invasive carcinomaFemale<65I/IIChemotherapycytoxanSD
LUC7LSNVMissense_Mutationrs770266344c.965C>Tp.Ala322Valp.A322VQ9NQ29protein_codingdeleterious_low_confidence(0.01)benign(0.022)TCGA-2W-A8YY-01Cervixcervical & endocervical cancerFemale<65I/IIChemotherapycisplatinCR
LUC7LSNVMissense_Mutationnovelc.454T>Cp.Ser152Prop.S152PQ9NQ29protein_codingdeleterious(0)probably_damaging(0.996)TCGA-2W-A8YY-01Cervixcervical & endocervical cancerFemale<65I/IIChemotherapycisplatinCR
LUC7LSNVMissense_Mutationc.740N>Cp.Arg247Thrp.R247TQ9NQ29protein_codingdeleterious(0.03)benign(0.432)TCGA-JX-A3Q0-01Cervixcervical & endocervical cancerFemale<65III/IVUnknownUnknownSD
LUC7LSNVMissense_Mutationc.740N>Cp.Arg247Thrp.R247TQ9NQ29protein_codingdeleterious(0.03)benign(0.432)TCGA-UC-A7PG-06Cervixcervical & endocervical cancerFemale<65III/IVChemotherapycisplatinPD
LUC7LSNVMissense_Mutationc.71N>Ap.Thr24Asnp.T24NQ9NQ29protein_codingtolerated(0.31)benign(0.03)TCGA-AA-3815-01Colorectumcolon adenocarcinomaFemale>=65I/IIUnknownUnknownSD
LUC7LSNVMissense_Mutationrs764753668c.1021N>Tp.Arg341Trpp.R341WQ9NQ29protein_codingdeleterious_low_confidence(0)possibly_damaging(0.451)TCGA-CK-5913-01Colorectumcolon adenocarcinomaFemale<65I/IIUnknownUnknownSD
LUC7LSNVMissense_Mutationnovelc.260N>Ap.Met87Lysp.M87KQ9NQ29protein_codingdeleterious(0)possibly_damaging(0.484)TCGA-AG-A01N-01Colorectumrectum adenocarcinomaFemale>=65III/IVChemotherapycapecitabineSD
LUC7LSNVMissense_Mutationrs772200033c.811N>Tp.Arg271Cysp.R271CQ9NQ29protein_codingdeleterious(0.03)probably_damaging(0.982)TCGA-A5-A0G2-01Endometriumuterine corpus endometrioid carcinomaFemale<65III/IVUnknownUnknownSD
LUC7LSNVMissense_Mutationnovelc.611N>Ap.Arg204Hisp.R204HQ9NQ29protein_codingdeleterious(0)possibly_damaging(0.581)TCGA-A5-A1OF-01Endometriumuterine corpus endometrioid carcinomaFemale<65I/IIUnknownUnknownSD
Page: 1 2 3 4 5 

Top

Related drugs of malignant transformation related genes

check buttonIdentification of chemicals and drugs interact with genes involved in malignant transfromation
(DGIdb 4.0)
Entrez IDSymbolCategoryInteraction TypesDrug Claim NameDrug NamePMIDs
Page: 1