
|
|||||
|
 | |
| |
| |
| |
| |
| |
|
Gene: LPAR1 |
Gene summary for LPAR1 |
| Gene information | Species | Human | Gene symbol | LPAR1 | Gene ID | 1902 |
| Gene name | lysophosphatidic acid receptor 1 | |
| Gene Alias | EDG2 | |
| Cytomap | 9q31.3 | |
| Gene Type | protein-coding | GO ID | GO:0000165 | UniProtAcc | Q5VZX0 |
Top |
Malignant transformation analysis |
| Identification of the aberrant gene expression in precancerous and cancerous lesions by comparing the gene expression of stem-like cells in diseased tissues with normal stem cells |
| Entrez ID | Symbol | Replicates | Species | Organ | Tissue | Adj P-value | Log2FC | Malignancy |
| 1902 | LPAR1 | CCI_3 | Human | Cervix | CC | 1.34e-04 | 4.06e-01 | 0.516 |
| 1902 | LPAR1 | HTA11_3410_2000001011 | Human | Colorectum | AD | 7.84e-13 | -5.16e-01 | 0.0155 |
| 1902 | LPAR1 | HTA11_3361_2000001011 | Human | Colorectum | AD | 2.75e-04 | -4.95e-01 | -0.1207 |
| 1902 | LPAR1 | HTA11_866_2000001011 | Human | Colorectum | AD | 1.57e-04 | -3.61e-01 | -0.1001 |
| 1902 | LPAR1 | HTA11_866_3004761011 | Human | Colorectum | AD | 9.18e-08 | -4.69e-01 | 0.096 |
| 1902 | LPAR1 | HTA11_10711_2000001011 | Human | Colorectum | AD | 2.22e-07 | -5.39e-01 | 0.0338 |
| 1902 | LPAR1 | HTA11_7696_3000711011 | Human | Colorectum | AD | 9.76e-12 | -4.90e-01 | 0.0674 |
| 1902 | LPAR1 | HTA11_6818_2000001021 | Human | Colorectum | AD | 5.52e-03 | -4.62e-01 | 0.0588 |
| 1902 | LPAR1 | HTA11_99999970781_79442 | Human | Colorectum | MSS | 7.05e-18 | -5.24e-01 | 0.294 |
| 1902 | LPAR1 | HTA11_99999971662_82457 | Human | Colorectum | MSS | 1.74e-10 | -4.36e-01 | 0.3859 |
| 1902 | LPAR1 | HTA11_99999973899_84307 | Human | Colorectum | MSS | 1.88e-05 | -5.65e-01 | 0.2585 |
| 1902 | LPAR1 | HTA11_99999974143_84620 | Human | Colorectum | MSS | 1.03e-21 | -5.68e-01 | 0.3005 |
| 1902 | LPAR1 | F007 | Human | Colorectum | FAP | 3.13e-09 | -5.44e-01 | 0.1176 |
| 1902 | LPAR1 | A002-C-010 | Human | Colorectum | FAP | 1.48e-06 | -3.87e-01 | 0.242 |
| 1902 | LPAR1 | A001-C-207 | Human | Colorectum | FAP | 4.00e-07 | -4.08e-01 | 0.1278 |
| 1902 | LPAR1 | A015-C-203 | Human | Colorectum | FAP | 2.72e-20 | -4.98e-01 | -0.1294 |
| 1902 | LPAR1 | A015-C-204 | Human | Colorectum | FAP | 1.65e-05 | -3.61e-01 | -0.0228 |
| 1902 | LPAR1 | A014-C-040 | Human | Colorectum | FAP | 1.10e-02 | -4.34e-01 | -0.1184 |
| 1902 | LPAR1 | A002-C-201 | Human | Colorectum | FAP | 4.96e-13 | -4.52e-01 | 0.0324 |
| 1902 | LPAR1 | A002-C-203 | Human | Colorectum | FAP | 5.14e-07 | -3.68e-01 | 0.2786 |
| Page: 1 2 3 4 |
| Tissue | Expression Dynamics | Abbreviation |
| Cervix |  | CC: Cervix cancer |
| HSIL_HPV: HPV-infected high-grade squamous intraepithelial lesions | ||
| N_HPV: HPV-infected normal cervix | ||
| Colorectum (GSE201348) | 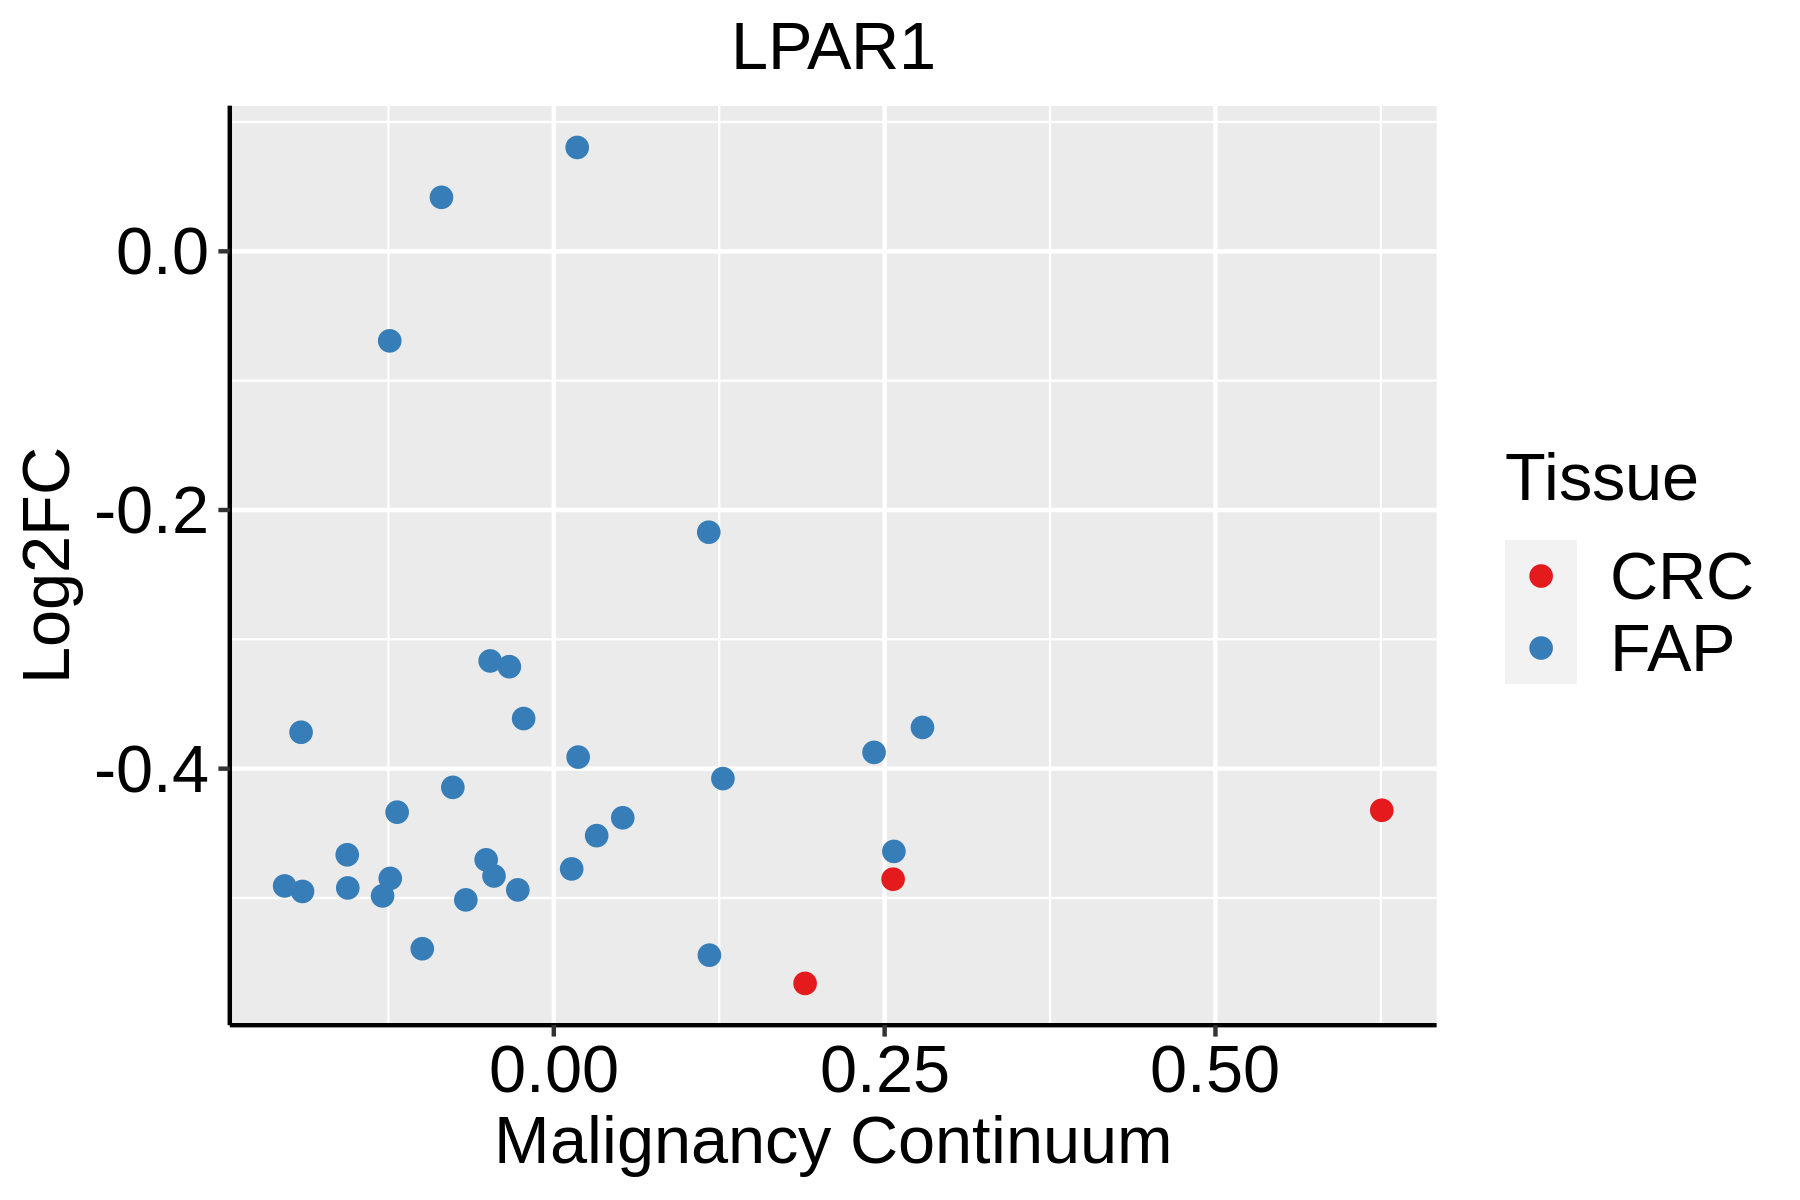 | FAP: Familial adenomatous polyposis |
| CRC: Colorectal cancer | ||
| Colorectum (HTA11) |  | AD: Adenomas |
| SER: Sessile serrated lesions | ||
| MSI-H: Microsatellite-high colorectal cancer | ||
| MSS: Microsatellite stable colorectal cancer | ||
| Esophagus |  | ESCC: Esophageal squamous cell carcinoma |
| HGIN: High-grade intraepithelial neoplasias | ||
| LGIN: Low-grade intraepithelial neoplasias | ||
| Oral Cavity | 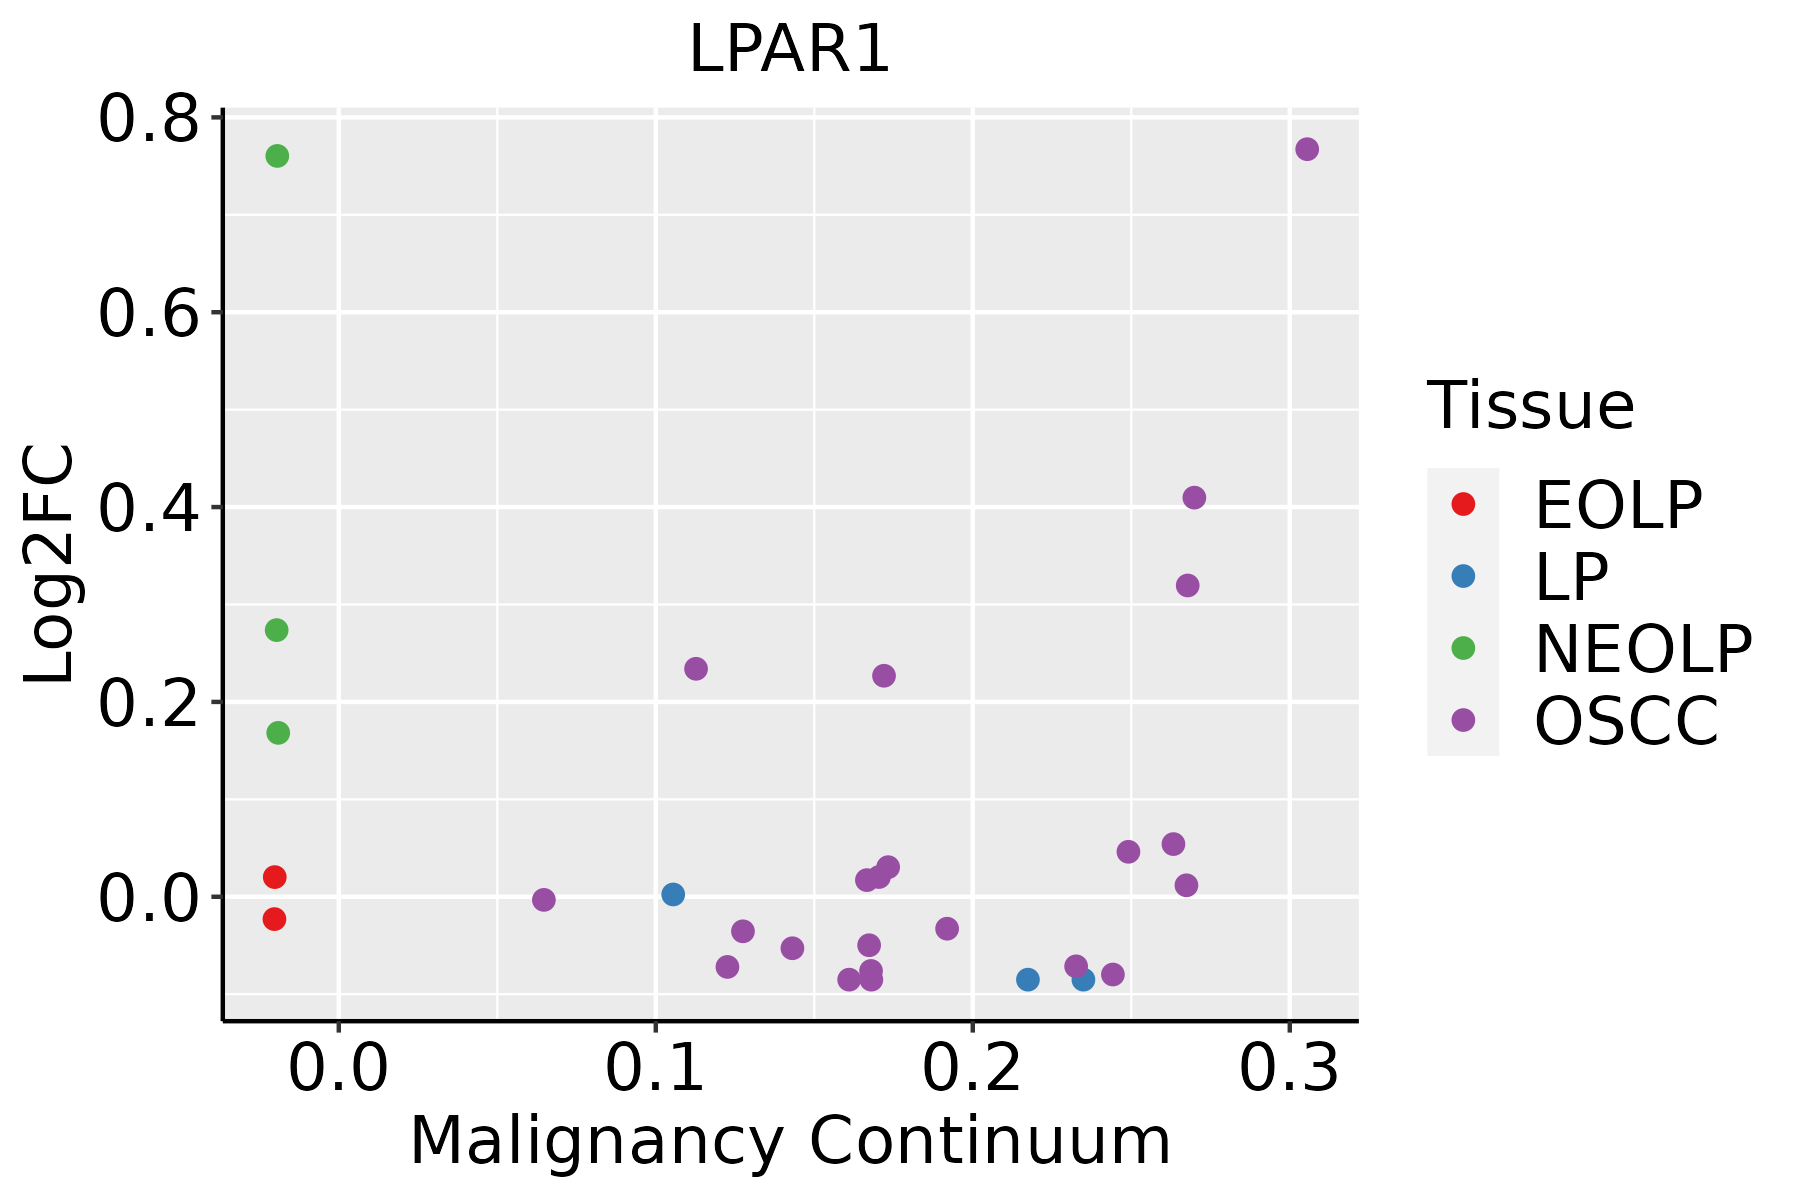 | EOLP: Erosive Oral lichen planus |
| LP: leukoplakia | ||
| NEOLP: Non-erosive oral lichen planus | ||
| OSCC: Oral squamous cell carcinoma | ||
| Prostate | 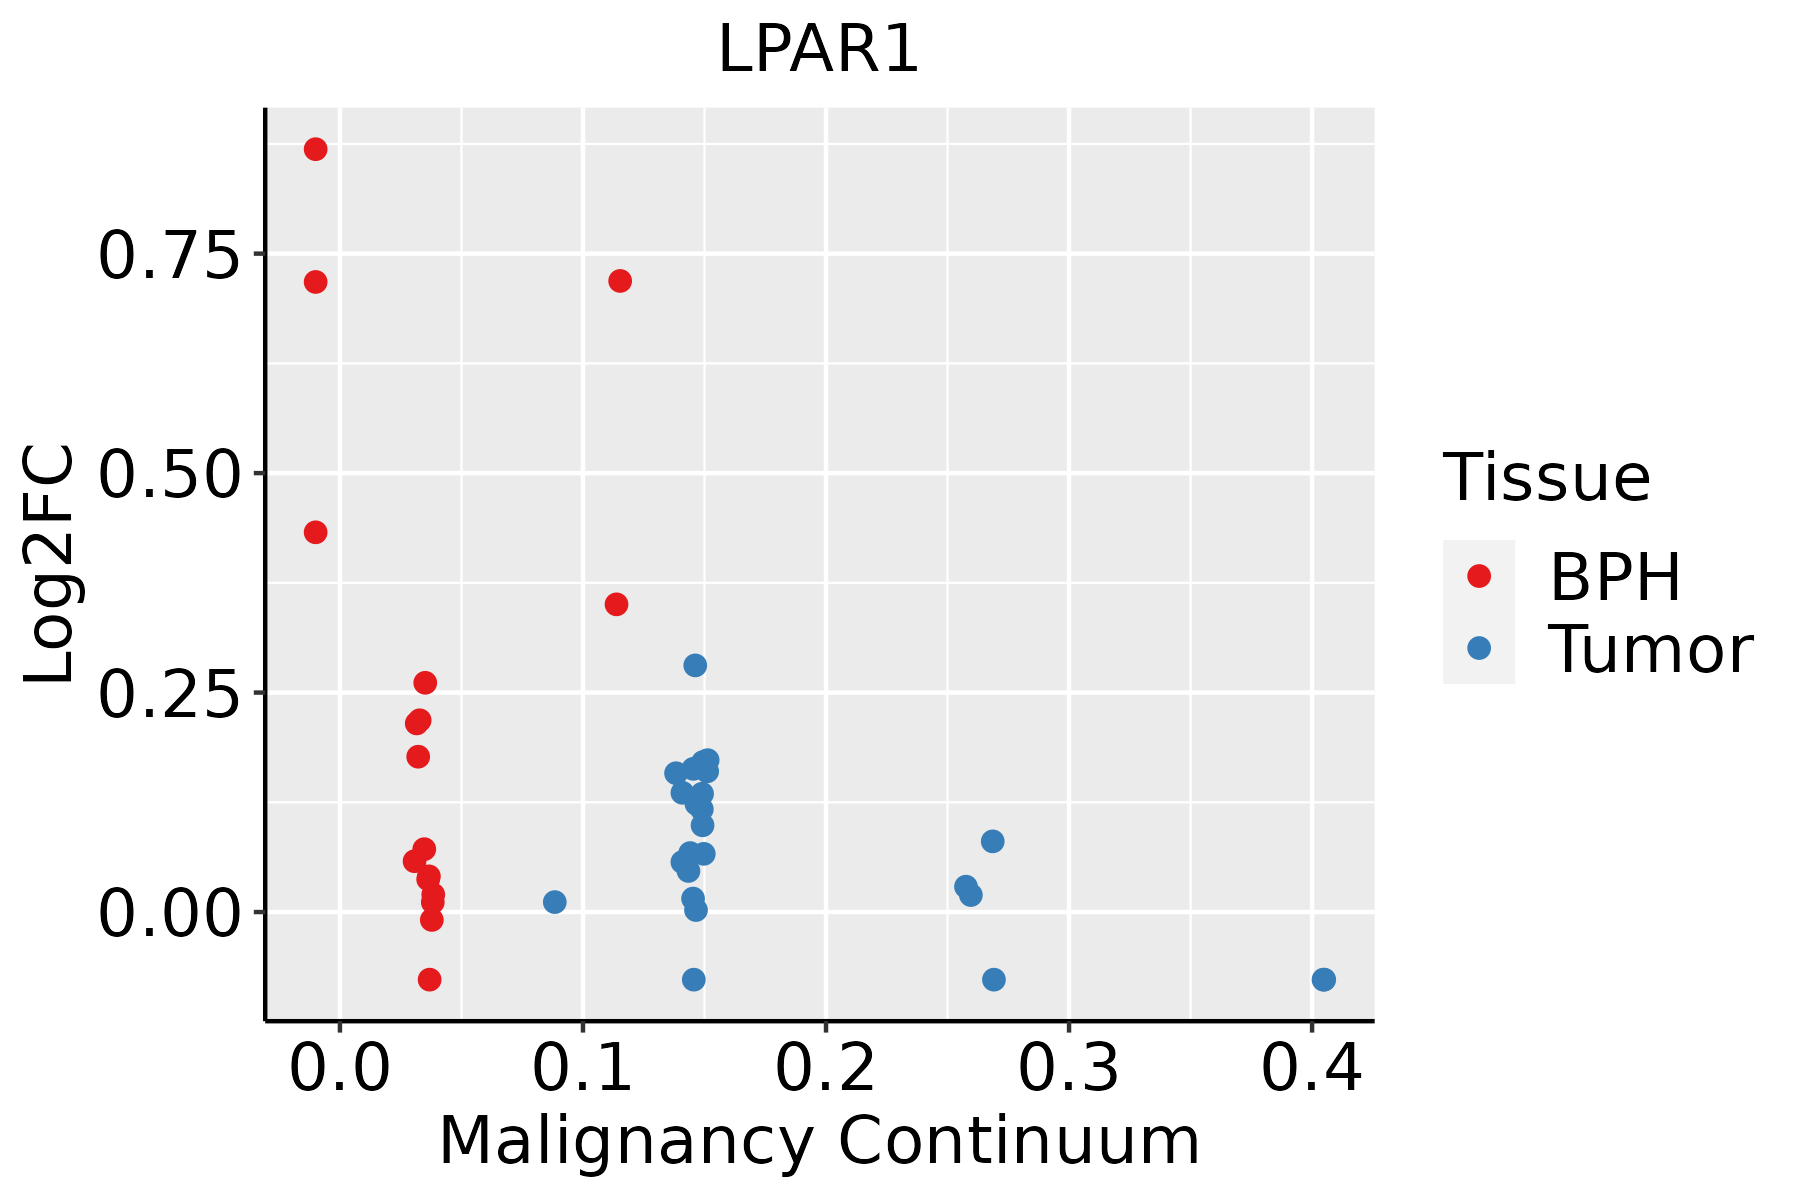 | BPH: Benign Prostatic Hyperplasia |
| ∗log2FC in expression of this searched gene in stem-like cells from each diseased tissue sample relative to stem-like cells in normal samples in each tissue plotted against the malignancy continuum. Samples are colored based on if they are from different disease stage. |
Top |
Malignant transformation related pathway analysis |
| Find out the enriched GO biological processes and KEGG pathways involved in transition from healthy to precancer to cancer |
| Tissue | Disease Stage | Enriched GO biological Processes |
| Colorectum | AD |  |
| Colorectum | SER |  |
| Colorectum | MSS |  |
| Colorectum | MSI-H |  |
| Colorectum | FAP |  |
| ∗Top 15 enriched GO BP terms are showed in the bar plot of each disease state in each tissue. Each row represents a significant GO biological process which is colored according to the -log10(p.adjust). |
| Page: 1 2 3 4 5 6 7 8 9 |
| GO ID | Tissue | Disease Stage | Description | Gene Ratio | Bg Ratio | pvalue | p.adjust | Count |
| GO:0043410 | Colorectum | CRC | positive regulation of MAPK cascade | 72/2078 | 480/18723 | 4.85e-03 | 3.74e-02 | 72 |
| GO:00431223 | Colorectum | CRC | regulation of I-kappaB kinase/NF-kappaB signaling | 41/2078 | 249/18723 | 6.39e-03 | 4.64e-02 | 41 |
| GO:004312318 | Esophagus | ESCC | positive regulation of I-kappaB kinase/NF-kappaB signaling | 132/8552 | 186/18723 | 2.07e-12 | 8.58e-11 | 132 |
| GO:0043122110 | Esophagus | ESCC | regulation of I-kappaB kinase/NF-kappaB signaling | 167/8552 | 249/18723 | 6.11e-12 | 2.32e-10 | 167 |
| GO:000724919 | Esophagus | ESCC | I-kappaB kinase/NF-kappaB signaling | 183/8552 | 281/18723 | 3.02e-11 | 1.01e-09 | 183 |
| GO:1902905111 | Esophagus | ESCC | positive regulation of supramolecular fiber organization | 142/8552 | 209/18723 | 5.51e-11 | 1.76e-09 | 142 |
| GO:1902903111 | Esophagus | ESCC | regulation of supramolecular fiber organization | 237/8552 | 383/18723 | 9.06e-11 | 2.75e-09 | 237 |
| GO:005149520 | Esophagus | ESCC | positive regulation of cytoskeleton organization | 147/8552 | 226/18723 | 2.93e-09 | 6.38e-08 | 147 |
| GO:000701527 | Esophagus | ESCC | actin filament organization | 259/8552 | 442/18723 | 2.37e-08 | 4.50e-07 | 259 |
| GO:000726510 | Esophagus | ESCC | Ras protein signal transduction | 201/8552 | 337/18723 | 1.44e-07 | 2.30e-06 | 201 |
| GO:0032970111 | Esophagus | ESCC | regulation of actin filament-based process | 231/8552 | 397/18723 | 2.91e-07 | 4.20e-06 | 231 |
| GO:0032956111 | Esophagus | ESCC | regulation of actin cytoskeleton organization | 210/8552 | 358/18723 | 4.40e-07 | 6.00e-06 | 210 |
| GO:011005327 | Esophagus | ESCC | regulation of actin filament organization | 166/8552 | 278/18723 | 1.54e-06 | 1.85e-05 | 166 |
| GO:005101727 | Esophagus | ESCC | actin filament bundle assembly | 100/8552 | 157/18723 | 3.87e-06 | 4.17e-05 | 100 |
| GO:002260420 | Esophagus | ESCC | regulation of cell morphogenesis | 180/8552 | 309/18723 | 5.19e-06 | 5.45e-05 | 180 |
| GO:006157227 | Esophagus | ESCC | actin filament bundle organization | 101/8552 | 161/18723 | 9.22e-06 | 8.82e-05 | 101 |
| GO:003003820 | Esophagus | ESCC | contractile actin filament bundle assembly | 67/8552 | 106/18723 | 2.03e-04 | 1.28e-03 | 67 |
| GO:004314920 | Esophagus | ESCC | stress fiber assembly | 67/8552 | 106/18723 | 2.03e-04 | 1.28e-03 | 67 |
| GO:001097516 | Esophagus | ESCC | regulation of neuron projection development | 240/8552 | 445/18723 | 2.48e-04 | 1.53e-03 | 240 |
| GO:000836018 | Esophagus | ESCC | regulation of cell shape | 92/8552 | 154/18723 | 3.00e-04 | 1.81e-03 | 92 |
| Page: 1 2 3 4 5 6 7 8 9 10 11 12 13 14 15 |
| Pathway ID | Tissue | Disease Stage | Description | Gene Ratio | Bg Ratio | pvalue | p.adjust | qvalue | Count |
| hsa0481016 | Cervix | CC | Regulation of actin cytoskeleton | 64/1267 | 229/8465 | 2.24e-07 | 2.59e-06 | 1.53e-06 | 64 |
| hsa0401512 | Cervix | CC | Rap1 signaling pathway | 56/1267 | 210/8465 | 6.23e-06 | 5.61e-05 | 3.32e-05 | 56 |
| hsa04540 | Cervix | CC | Gap junction | 22/1267 | 88/8465 | 9.07e-03 | 2.85e-02 | 1.69e-02 | 22 |
| hsa0481017 | Cervix | CC | Regulation of actin cytoskeleton | 64/1267 | 229/8465 | 2.24e-07 | 2.59e-06 | 1.53e-06 | 64 |
| hsa0401513 | Cervix | CC | Rap1 signaling pathway | 56/1267 | 210/8465 | 6.23e-06 | 5.61e-05 | 3.32e-05 | 56 |
| hsa045401 | Cervix | CC | Gap junction | 22/1267 | 88/8465 | 9.07e-03 | 2.85e-02 | 1.69e-02 | 22 |
| hsa05130 | Colorectum | AD | Pathogenic Escherichia coli infection | 79/2092 | 197/8465 | 1.05e-06 | 1.36e-05 | 8.65e-06 | 79 |
| hsa04015 | Colorectum | AD | Rap1 signaling pathway | 71/2092 | 210/8465 | 1.72e-03 | 9.68e-03 | 6.18e-03 | 71 |
| hsa04810 | Colorectum | AD | Regulation of actin cytoskeleton | 75/2092 | 229/8465 | 3.36e-03 | 1.76e-02 | 1.12e-02 | 75 |
| hsa051301 | Colorectum | AD | Pathogenic Escherichia coli infection | 79/2092 | 197/8465 | 1.05e-06 | 1.36e-05 | 8.65e-06 | 79 |
| hsa040151 | Colorectum | AD | Rap1 signaling pathway | 71/2092 | 210/8465 | 1.72e-03 | 9.68e-03 | 6.18e-03 | 71 |
| hsa048101 | Colorectum | AD | Regulation of actin cytoskeleton | 75/2092 | 229/8465 | 3.36e-03 | 1.76e-02 | 1.12e-02 | 75 |
| hsa051304 | Colorectum | MSS | Pathogenic Escherichia coli infection | 73/1875 | 197/8465 | 1.10e-06 | 1.48e-05 | 9.06e-06 | 73 |
| hsa040154 | Colorectum | MSS | Rap1 signaling pathway | 66/1875 | 210/8465 | 1.03e-03 | 5.94e-03 | 3.64e-03 | 66 |
| hsa048104 | Colorectum | MSS | Regulation of actin cytoskeleton | 68/1875 | 229/8465 | 4.27e-03 | 1.86e-02 | 1.14e-02 | 68 |
| hsa051305 | Colorectum | MSS | Pathogenic Escherichia coli infection | 73/1875 | 197/8465 | 1.10e-06 | 1.48e-05 | 9.06e-06 | 73 |
| hsa040155 | Colorectum | MSS | Rap1 signaling pathway | 66/1875 | 210/8465 | 1.03e-03 | 5.94e-03 | 3.64e-03 | 66 |
| hsa048105 | Colorectum | MSS | Regulation of actin cytoskeleton | 68/1875 | 229/8465 | 4.27e-03 | 1.86e-02 | 1.14e-02 | 68 |
| hsa051308 | Colorectum | FAP | Pathogenic Escherichia coli infection | 62/1404 | 197/8465 | 1.37e-07 | 3.08e-06 | 1.87e-06 | 62 |
| hsa048106 | Colorectum | FAP | Regulation of actin cytoskeleton | 65/1404 | 229/8465 | 4.07e-06 | 5.91e-05 | 3.59e-05 | 65 |
| Page: 1 2 3 4 |
Top |
Cell-cell communication analysis |
| Identification of potential cell-cell interactions between two cell types and their ligand-receptor pairs for different disease states |
| Ligand | Receptor | LRpair | Pathway | Tissue | Disease Stage |
| Page: 1 |
Top |
Single-cell gene regulatory network inference analysis |
| Find out the significant the regulons (TFs) and the target genes of each regulon across cell types for different disease states |
| TF | Cell Type | Tissue | Disease Stage | Target Gene | RSS | Regulon Activity |
| ∗The dot plots of a searched regulon are shown for all cell subpopulations in each disease state of each tissue based on the regulon specific score inferred using pySCENIC and by calculating the average expression. |
| Page: 1 |
Top |
Somatic mutation of malignant transformation related genes |
| Annotation of somatic variants for genes involved in malignant transformation |
| Hugo Symbol | Variant Class | Variant Classification | dbSNP RS | HGVSc | HGVSp | HGVSp Short | SWISSPROT | BIOTYPE | SIFT | PolyPhen | Tumor Sample Barcode | Tissue | Histology | Sex | Age | Stage | Therapy Types | Drugs | Outcome |
| LPAR1 | SNV | Missense_Mutation | c.1027N>T | p.Arg343Cys | p.R343C | Q92633 | protein_coding | tolerated(0.16) | possibly_damaging(0.793) | TCGA-AN-A0FL-01 | Breast | breast invasive carcinoma | Female | <65 | I/II | Unknown | Unknown | SD | |
| LPAR1 | insertion | Nonsense_Mutation | novel | c.796_797insTATTCCAAAAAAGTCATAGAAGATGAAGC | p.Ala266ValfsTer9 | p.A266Vfs*9 | Q92633 | protein_coding | TCGA-A7-A0CJ-01 | Breast | breast invasive carcinoma | Female | <65 | I/II | Chemotherapy | cytoxan | SD | ||
| LPAR1 | insertion | Frame_Shift_Ins | novel | c.164_165insCA | p.Gly56MetfsTer33 | p.G56Mfs*33 | Q92633 | protein_coding | TCGA-AN-A0FN-01 | Breast | breast invasive carcinoma | Female | <65 | I/II | Unknown | Unknown | SD | ||
| LPAR1 | insertion | Nonsense_Mutation | novel | c.162_163insTTTATTAATAACTCCTAATCTCTCACTGCTAC | p.Leu55PhefsTer6 | p.L55Ffs*6 | Q92633 | protein_coding | TCGA-AN-A0FN-01 | Breast | breast invasive carcinoma | Female | <65 | I/II | Unknown | Unknown | SD | ||
| LPAR1 | SNV | Missense_Mutation | novel | c.277G>T | p.Ala93Ser | p.A93S | Q92633 | protein_coding | deleterious(0.02) | probably_damaging(0.992) | TCGA-C5-A1MN-01 | Cervix | cervical & endocervical cancer | Female | <65 | III/IV | Chemotherapy | cisplatin | SD |
| LPAR1 | SNV | Missense_Mutation | rs769855870 | c.941G>A | p.Arg314His | p.R314H | Q92633 | protein_coding | deleterious(0.01) | probably_damaging(0.991) | TCGA-A6-5657-01 | Colorectum | colon adenocarcinoma | Male | >=65 | III/IV | Ancillary | leucovorin | SD |
| LPAR1 | SNV | Missense_Mutation | c.550N>A | p.Val184Met | p.V184M | Q92633 | protein_coding | tolerated(0.99) | benign(0.044) | TCGA-AA-3663-01 | Colorectum | colon adenocarcinoma | Male | <65 | I/II | Unknown | Unknown | SD | |
| LPAR1 | SNV | Missense_Mutation | c.616T>C | p.Tyr206His | p.Y206H | Q92633 | protein_coding | deleterious(0) | probably_damaging(0.997) | TCGA-AA-A010-01 | Colorectum | colon adenocarcinoma | Female | <65 | I/II | Chemotherapy | folinic | CR | |
| LPAR1 | SNV | Missense_Mutation | c.371N>A | p.Arg124His | p.R124H | Q92633 | protein_coding | deleterious(0.02) | probably_damaging(0.945) | TCGA-AG-3892-01 | Colorectum | rectum adenocarcinoma | Female | <65 | I/II | Unknown | Unknown | SD | |
| LPAR1 | SNV | Missense_Mutation | rs868460243 | c.433N>A | p.Glu145Lys | p.E145K | Q92633 | protein_coding | deleterious(0) | probably_damaging(1) | TCGA-AG-A002-01 | Colorectum | rectum adenocarcinoma | Male | <65 | I/II | Unknown | Unknown | SD |
| Page: 1 2 3 4 5 |
Top |
Related drugs of malignant transformation related genes |
| Identification of chemicals and drugs interact with genes involved in malignant transfromation |
| (DGIdb 4.0) |
| Entrez ID | Symbol | Category | Interaction Types | Drug Claim Name | Drug Name | PMIDs |
| 1902 | LPAR1 | G PROTEIN COUPLED RECEPTOR, CELL SURFACE, DRUGGABLE GENOME, KINASE | antagonist | 252166789 | ||
| 1902 | LPAR1 | G PROTEIN COUPLED RECEPTOR, CELL SURFACE, DRUGGABLE GENOME, KINASE | antagonist | 178102101 | ||
| 1902 | LPAR1 | G PROTEIN COUPLED RECEPTOR, CELL SURFACE, DRUGGABLE GENOME, KINASE | SAR-100842 | 25593637 | ||
| 1902 | LPAR1 | G PROTEIN COUPLED RECEPTOR, CELL SURFACE, DRUGGABLE GENOME, KINASE | antagonist | 329968437 | BMS-986020 | |
| 1902 | LPAR1 | G PROTEIN COUPLED RECEPTOR, CELL SURFACE, DRUGGABLE GENOME, KINASE | antagonist | 329968438 | ||
| 1902 | LPAR1 | G PROTEIN COUPLED RECEPTOR, CELL SURFACE, DRUGGABLE GENOME, KINASE | BMS-986202 | |||
| 1902 | LPAR1 | G PROTEIN COUPLED RECEPTOR, CELL SURFACE, DRUGGABLE GENOME, KINASE | agonist | 178103562 | ||
| 1902 | LPAR1 | G PROTEIN COUPLED RECEPTOR, CELL SURFACE, DRUGGABLE GENOME, KINASE | antagonist | 178103565 | ||
| 1902 | LPAR1 | G PROTEIN COUPLED RECEPTOR, CELL SURFACE, DRUGGABLE GENOME, KINASE | AM-152 | |||
| 1902 | LPAR1 | G PROTEIN COUPLED RECEPTOR, CELL SURFACE, DRUGGABLE GENOME, KINASE | antagonist | 135649931 |
| Page: 1 2 3 |

Copyright 2023-Present -The University of Texas Health Science Center at Houston |