
|
|||||
|
 | |
| |
| |
| |
| |
| |
|
Gene: LGALS1 |
Gene summary for LGALS1 |
| Gene information | Species | Human | Gene symbol | LGALS1 | Gene ID | 3956 |
| Gene name | galectin 1 | |
| Gene Alias | GAL1 | |
| Cytomap | 22q13.1 | |
| Gene Type | protein-coding | GO ID | GO:0001678 | UniProtAcc | P09382 |
Top |
Malignant transformation analysis |
| Identification of the aberrant gene expression in precancerous and cancerous lesions by comparing the gene expression of stem-like cells in diseased tissues with normal stem cells |
| Entrez ID | Symbol | Replicates | Species | Organ | Tissue | Adj P-value | Log2FC | Malignancy |
| 3956 | LGALS1 | GSM4909281 | Human | Breast | IDC | 6.11e-54 | 9.81e-01 | 0.21 |
| 3956 | LGALS1 | GSM4909282 | Human | Breast | IDC | 1.82e-08 | 5.09e-01 | -0.0288 |
| 3956 | LGALS1 | GSM4909285 | Human | Breast | IDC | 1.96e-37 | 7.73e-01 | 0.21 |
| 3956 | LGALS1 | GSM4909286 | Human | Breast | IDC | 6.66e-07 | -4.32e-01 | 0.1081 |
| 3956 | LGALS1 | GSM4909287 | Human | Breast | IDC | 7.07e-21 | 7.06e-01 | 0.2057 |
| 3956 | LGALS1 | GSM4909290 | Human | Breast | IDC | 3.03e-09 | 5.91e-01 | 0.2096 |
| 3956 | LGALS1 | GSM4909293 | Human | Breast | IDC | 4.86e-26 | -6.84e-01 | 0.1581 |
| 3956 | LGALS1 | GSM4909294 | Human | Breast | IDC | 5.75e-20 | -6.30e-01 | 0.2022 |
| 3956 | LGALS1 | GSM4909295 | Human | Breast | IDC | 8.72e-06 | 5.89e-01 | 0.0898 |
| 3956 | LGALS1 | GSM4909296 | Human | Breast | IDC | 1.77e-52 | 9.28e-01 | 0.1524 |
| 3956 | LGALS1 | GSM4909297 | Human | Breast | IDC | 9.27e-27 | 6.25e-01 | 0.1517 |
| 3956 | LGALS1 | GSM4909298 | Human | Breast | IDC | 9.67e-05 | 3.02e-01 | 0.1551 |
| 3956 | LGALS1 | GSM4909299 | Human | Breast | IDC | 1.10e-15 | 6.60e-01 | 0.035 |
| 3956 | LGALS1 | GSM4909302 | Human | Breast | IDC | 2.76e-24 | 7.22e-01 | 0.1545 |
| 3956 | LGALS1 | GSM4909303 | Human | Breast | IDC | 5.29e-04 | -5.28e-01 | 0.0438 |
| 3956 | LGALS1 | GSM4909304 | Human | Breast | IDC | 4.38e-47 | 7.72e-01 | 0.1636 |
| 3956 | LGALS1 | GSM4909307 | Human | Breast | IDC | 1.49e-19 | 6.41e-01 | 0.1569 |
| 3956 | LGALS1 | GSM4909308 | Human | Breast | IDC | 6.01e-10 | 4.84e-01 | 0.158 |
| 3956 | LGALS1 | GSM4909309 | Human | Breast | IDC | 2.13e-27 | 7.76e-01 | 0.0483 |
| 3956 | LGALS1 | GSM4909311 | Human | Breast | IDC | 1.83e-16 | -9.43e-02 | 0.1534 |
| Page: 1 2 3 4 5 6 7 8 9 10 11 12 |
| Tissue | Expression Dynamics | Abbreviation |
| Breast |  | IDC: Invasive ductal carcinoma |
| DCIS: Ductal carcinoma in situ | ||
| Precancer(BRCA1-mut): Precancerous lesion from BRCA1 mutation carriers | ||
| Cervix |  | CC: Cervix cancer |
| HSIL_HPV: HPV-infected high-grade squamous intraepithelial lesions | ||
| N_HPV: HPV-infected normal cervix | ||
| Endometrium | 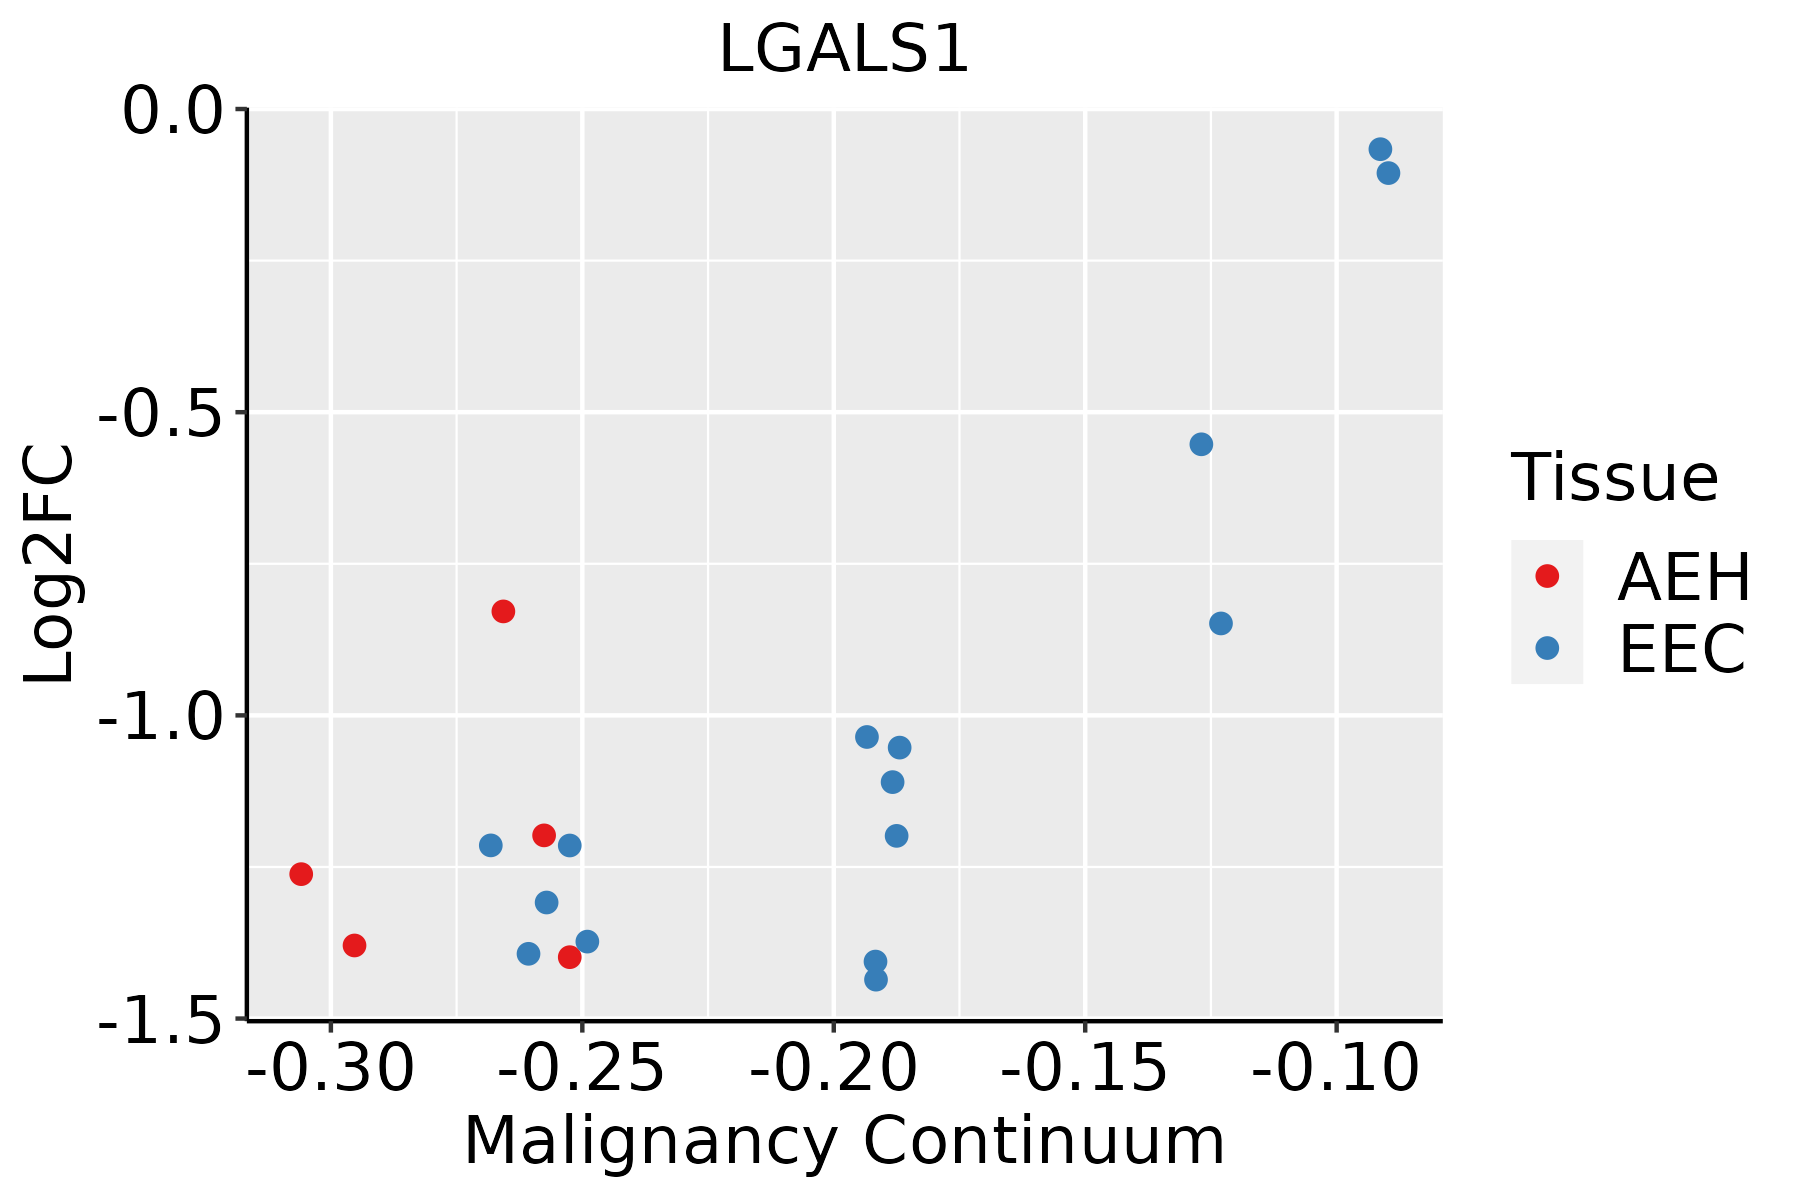 | AEH: Atypical endometrial hyperplasia |
| EEC: Endometrioid Cancer | ||
| Esophagus |  | ESCC: Esophageal squamous cell carcinoma |
| HGIN: High-grade intraepithelial neoplasias | ||
| LGIN: Low-grade intraepithelial neoplasias | ||
| Liver | 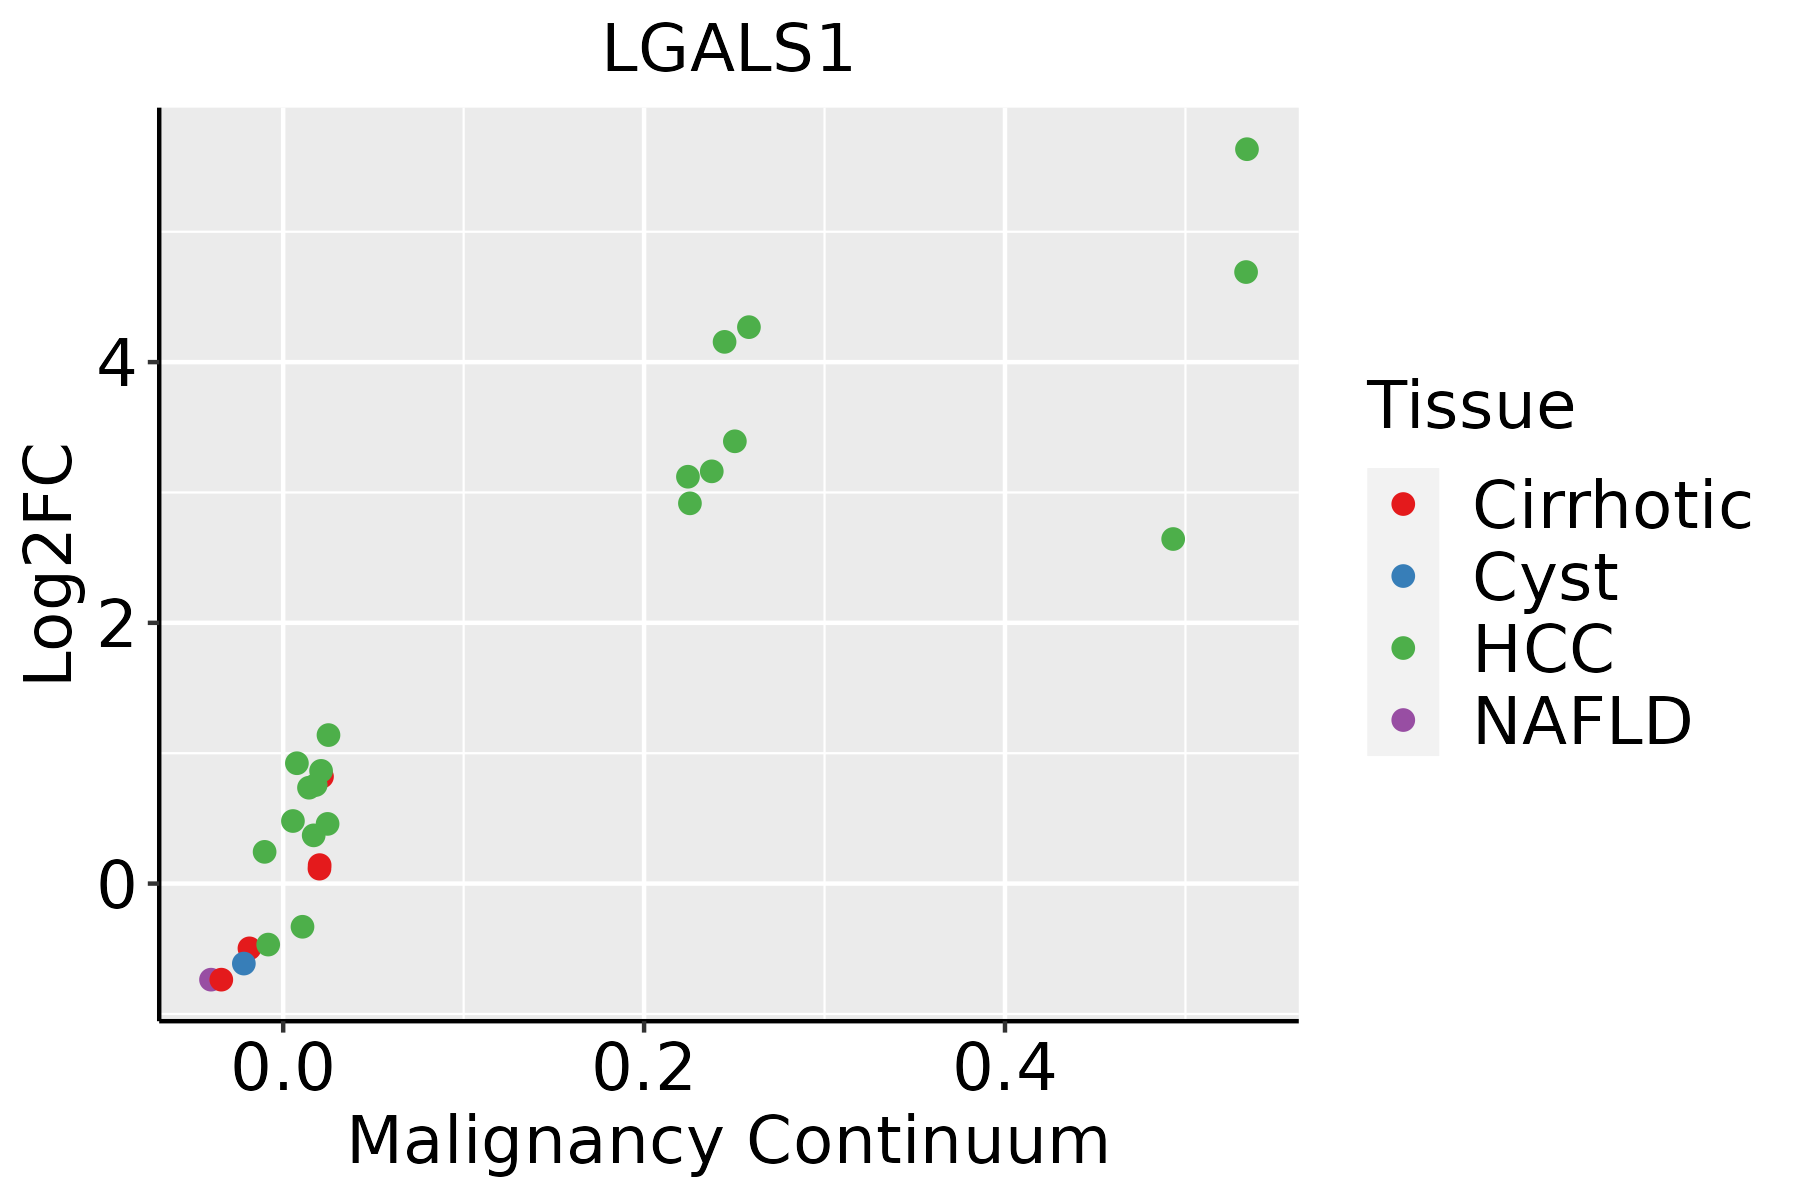 | HCC: Hepatocellular carcinoma |
| NAFLD: Non-alcoholic fatty liver disease | ||
| Lung |  | AAH: Atypical adenomatous hyperplasia |
| AIS: Adenocarcinoma in situ | ||
| IAC: Invasive lung adenocarcinoma | ||
| MIA: Minimally invasive adenocarcinoma | ||
| Oral Cavity | 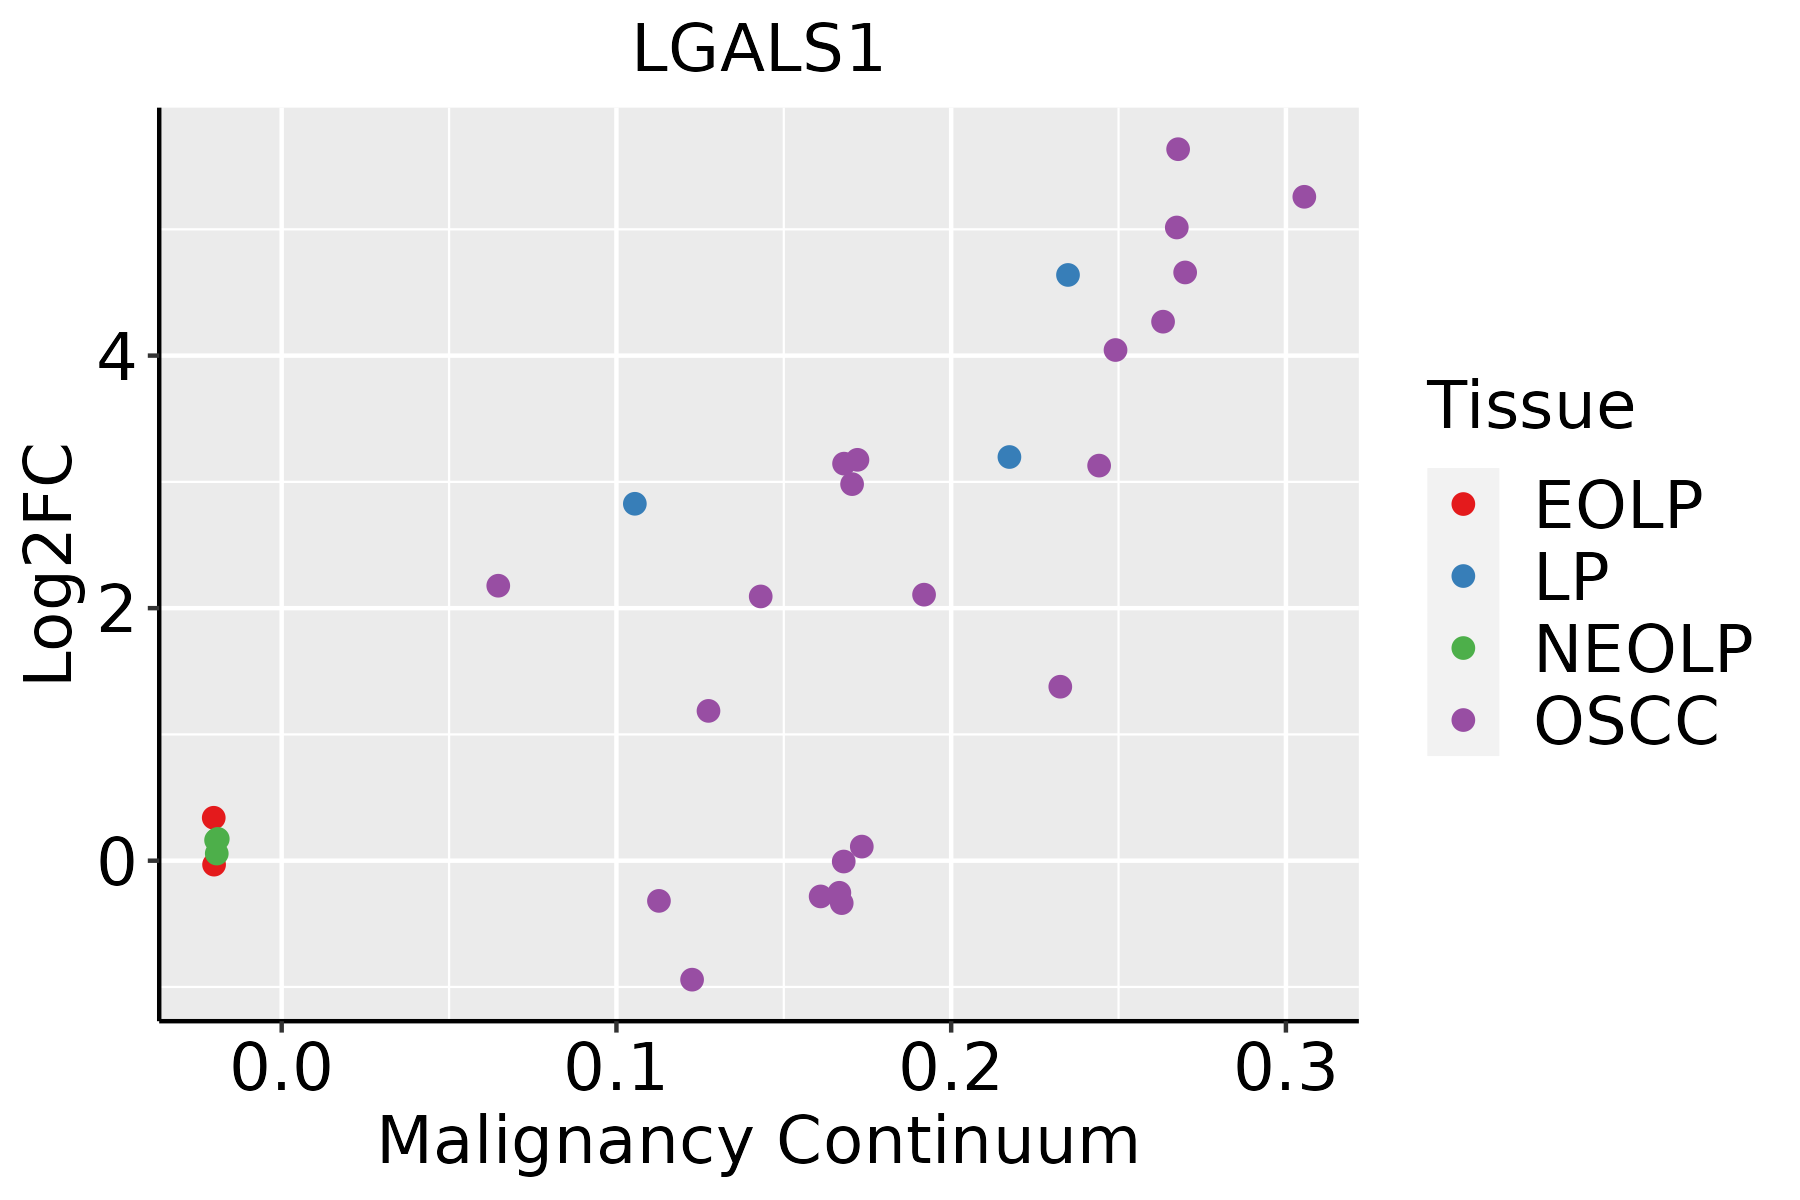 | EOLP: Erosive Oral lichen planus |
| LP: leukoplakia | ||
| NEOLP: Non-erosive oral lichen planus | ||
| OSCC: Oral squamous cell carcinoma | ||
| Prostate | 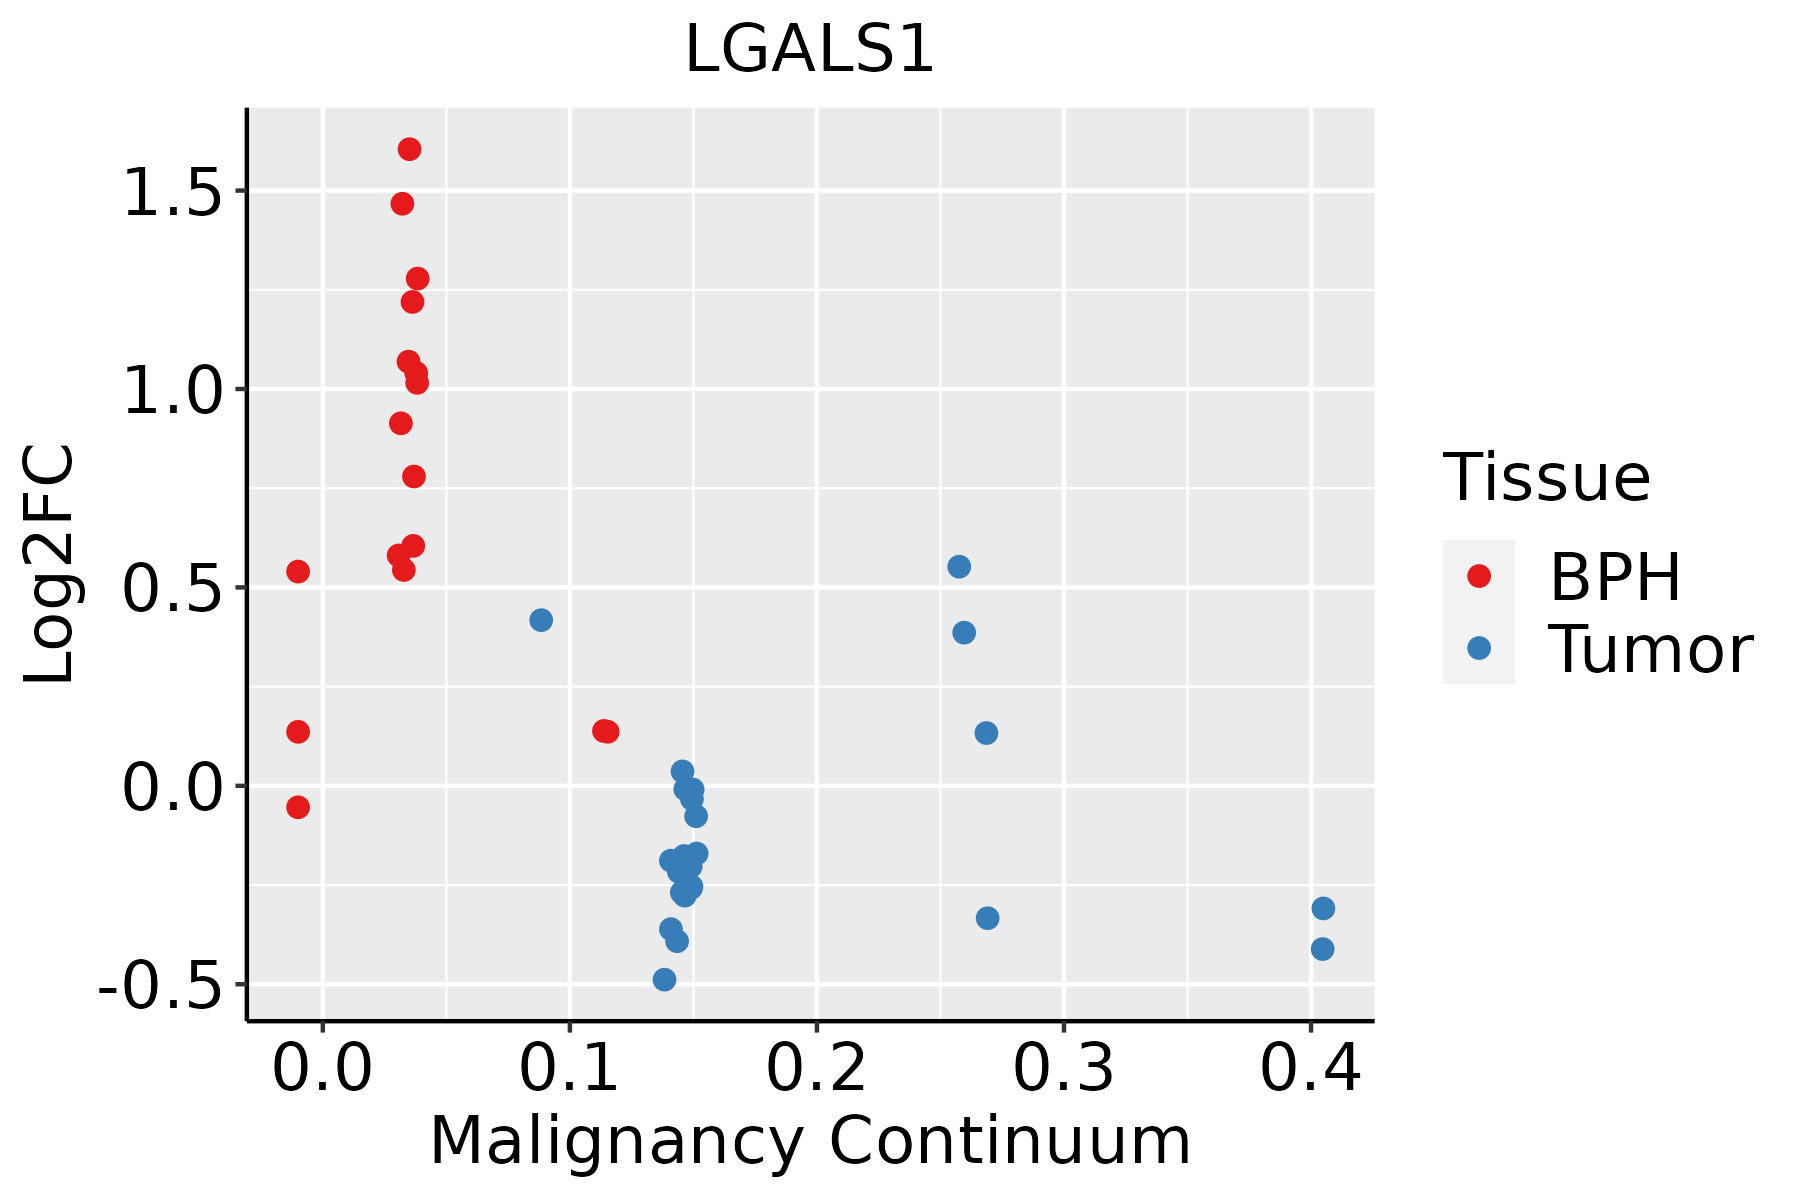 | BPH: Benign Prostatic Hyperplasia |
| Skin |  | AK: Actinic keratosis |
| cSCC: Cutaneous squamous cell carcinoma | ||
| SCCIS:squamous cell carcinoma in situ | ||
| Thyroid | 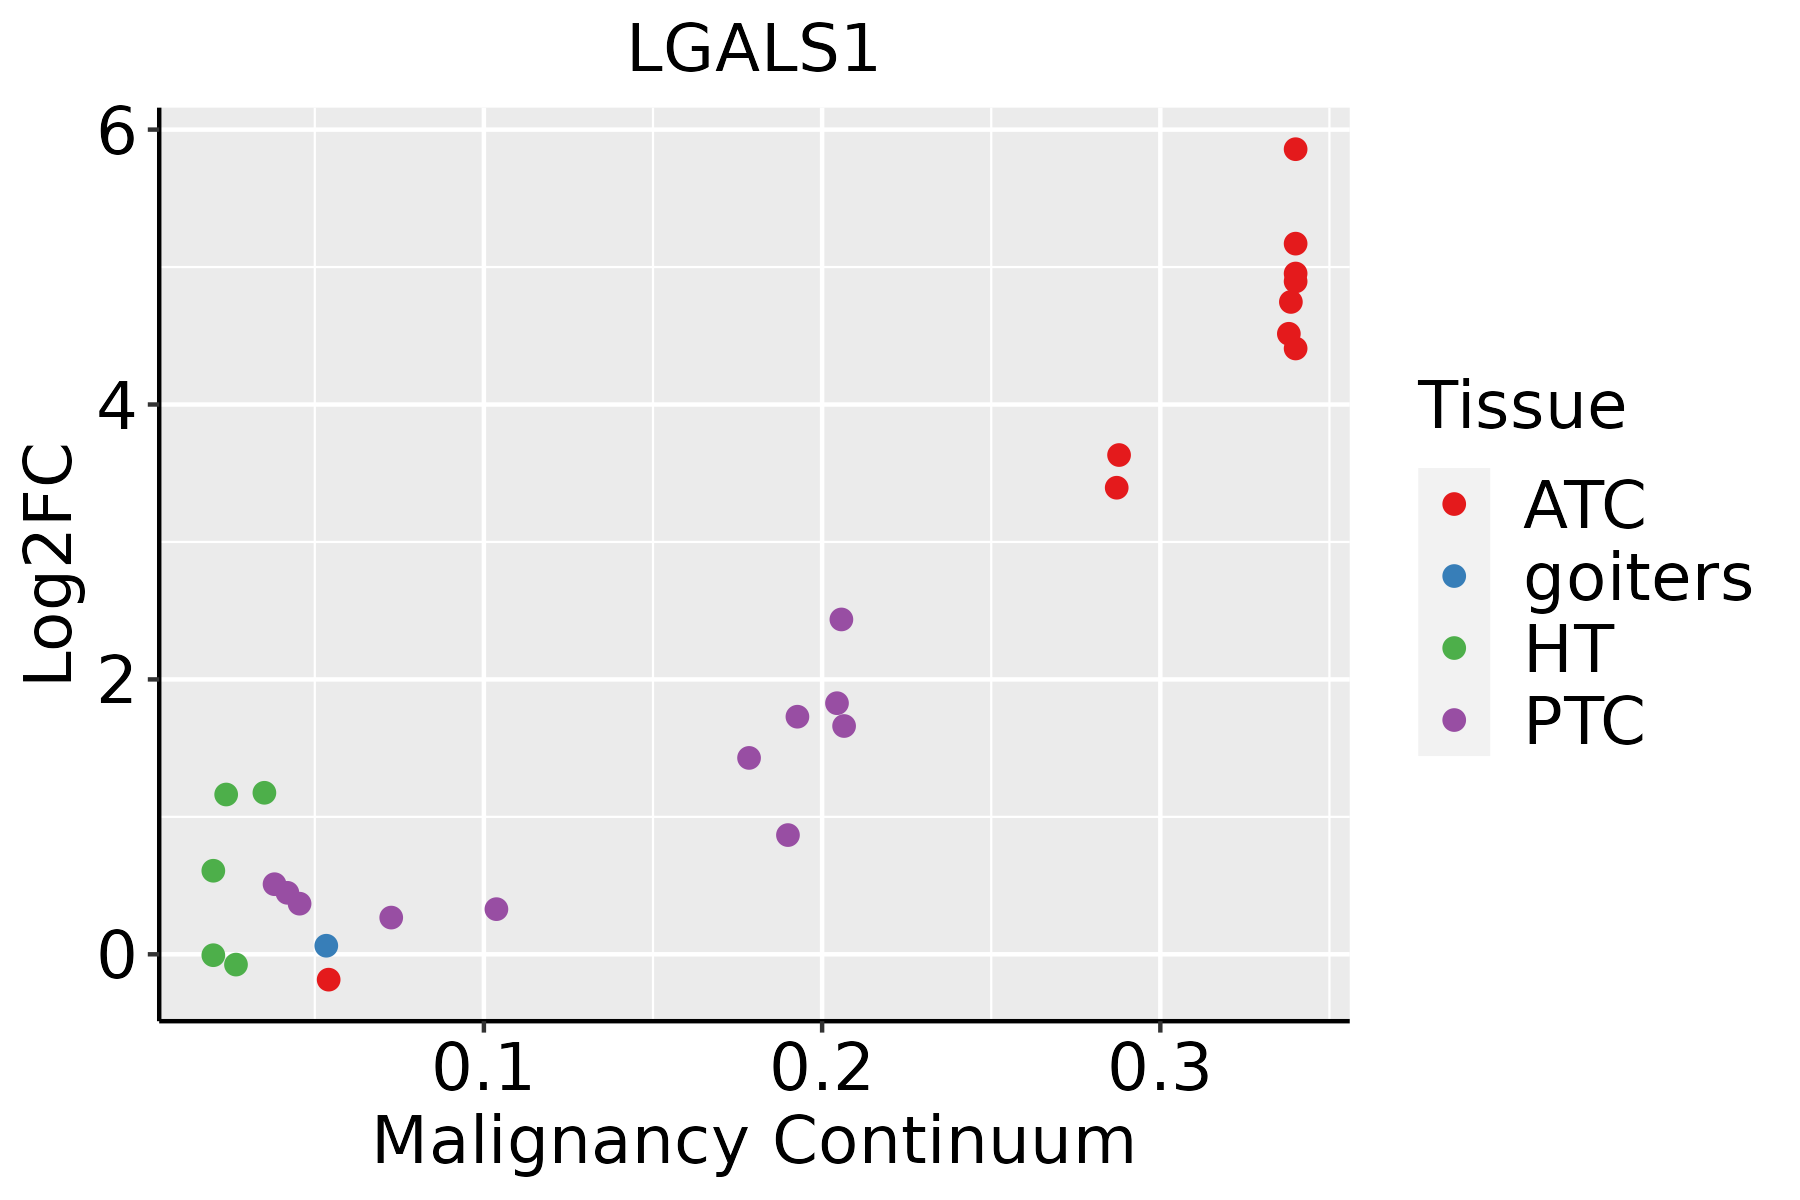 | ATC: Anaplastic thyroid cancer |
| HT: Hashimoto's thyroiditis | ||
| PTC: Papillary thyroid cancer |
| ∗log2FC in expression of this searched gene in stem-like cells from each diseased tissue sample relative to stem-like cells in normal samples in each tissue plotted against the malignancy continuum. Samples are colored based on if they are from different disease stage. |
Top |
Malignant transformation related pathway analysis |
| Find out the enriched GO biological processes and KEGG pathways involved in transition from healthy to precancer to cancer |
| Tissue | Disease Stage | Enriched GO biological Processes |
| Colorectum | AD |  |
| Colorectum | SER |  |
| Colorectum | MSS |  |
| Colorectum | MSI-H |  |
| Colorectum | FAP |  |
| ∗Top 15 enriched GO BP terms are showed in the bar plot of each disease state in each tissue. Each row represents a significant GO biological process which is colored according to the -log10(p.adjust). |
| Page: 1 2 3 4 5 6 7 8 9 |
| GO ID | Tissue | Disease Stage | Description | Gene Ratio | Bg Ratio | pvalue | p.adjust | Count |
| GO:00421108 | Cervix | CC | T cell activation | 107/2311 | 487/18723 | 1.24e-09 | 1.46e-07 | 107 |
| GO:00508638 | Cervix | CC | regulation of T cell activation | 80/2311 | 329/18723 | 1.28e-09 | 1.47e-07 | 80 |
| GO:004671810 | Cervix | CC | viral entry into host cell | 44/2311 | 144/18723 | 5.47e-09 | 5.03e-07 | 44 |
| GO:004440310 | Cervix | CC | biological process involved in symbiotic interaction | 71/2311 | 290/18723 | 7.94e-09 | 6.98e-07 | 71 |
| GO:00071598 | Cervix | CC | leukocyte cell-cell adhesion | 85/2311 | 371/18723 | 8.27e-09 | 7.07e-07 | 85 |
| GO:00071626 | Cervix | CC | negative regulation of cell adhesion | 72/2311 | 303/18723 | 2.36e-08 | 1.70e-06 | 72 |
| GO:19030378 | Cervix | CC | regulation of leukocyte cell-cell adhesion | 77/2311 | 336/18723 | 4.08e-08 | 2.54e-06 | 77 |
| GO:00109757 | Cervix | CC | regulation of neuron projection development | 88/2311 | 445/18723 | 4.26e-06 | 1.09e-04 | 88 |
| GO:00224099 | Cervix | CC | positive regulation of cell-cell adhesion | 61/2311 | 284/18723 | 9.30e-06 | 2.11e-04 | 61 |
| GO:19030397 | Cervix | CC | positive regulation of leukocyte cell-cell adhesion | 53/2311 | 239/18723 | 1.37e-05 | 2.74e-04 | 53 |
| GO:00508708 | Cervix | CC | positive regulation of T cell activation | 49/2311 | 216/18723 | 1.51e-05 | 2.97e-04 | 49 |
| GO:003410910 | Cervix | CC | homotypic cell-cell adhesion | 26/2311 | 90/18723 | 2.12e-05 | 3.82e-04 | 26 |
| GO:00108122 | Cervix | CC | negative regulation of cell-substrate adhesion | 21/2311 | 68/18723 | 4.35e-05 | 6.66e-04 | 21 |
| GO:00431228 | Cervix | CC | regulation of I-kappaB kinase/NF-kappaB signaling | 53/2311 | 249/18723 | 4.50e-05 | 6.87e-04 | 53 |
| GO:000974310 | Cervix | CC | response to carbohydrate | 53/2311 | 253/18723 | 7.02e-05 | 9.85e-04 | 53 |
| GO:005079210 | Cervix | CC | regulation of viral process | 38/2311 | 164/18723 | 8.12e-05 | 1.10e-03 | 38 |
| GO:003428410 | Cervix | CC | response to monosaccharide | 48/2311 | 225/18723 | 9.48e-05 | 1.25e-03 | 48 |
| GO:00072497 | Cervix | CC | I-kappaB kinase/NF-kappaB signaling | 56/2311 | 281/18723 | 1.81e-04 | 2.12e-03 | 56 |
| GO:000974610 | Cervix | CC | response to hexose | 45/2311 | 219/18723 | 3.73e-04 | 3.86e-03 | 45 |
| GO:190390010 | Cervix | CC | regulation of viral life cycle | 33/2311 | 148/18723 | 4.86e-04 | 4.76e-03 | 33 |
| Page: 1 2 3 4 5 6 7 8 9 10 11 12 13 14 15 16 17 18 19 20 21 22 23 24 25 26 27 28 29 30 31 32 33 34 35 36 37 38 39 40 41 42 43 44 45 46 47 48 49 |
| Pathway ID | Tissue | Disease Stage | Description | Gene Ratio | Bg Ratio | pvalue | p.adjust | qvalue | Count |
| Page: 1 |
Top |
Cell-cell communication analysis |
| Identification of potential cell-cell interactions between two cell types and their ligand-receptor pairs for different disease states |
| Ligand | Receptor | LRpair | Pathway | Tissue | Disease Stage |
| Page: 1 |
Top |
Single-cell gene regulatory network inference analysis |
| Find out the significant the regulons (TFs) and the target genes of each regulon across cell types for different disease states |
| TF | Cell Type | Tissue | Disease Stage | Target Gene | RSS | Regulon Activity |
| ∗The dot plots of a searched regulon are shown for all cell subpopulations in each disease state of each tissue based on the regulon specific score inferred using pySCENIC and by calculating the average expression. |
| Page: 1 |
Top |
Somatic mutation of malignant transformation related genes |
| Annotation of somatic variants for genes involved in malignant transformation |
| Hugo Symbol | Variant Class | Variant Classification | dbSNP RS | HGVSc | HGVSp | HGVSp Short | SWISSPROT | BIOTYPE | SIFT | PolyPhen | Tumor Sample Barcode | Tissue | Histology | Sex | Age | Stage | Therapy Types | Drugs | Outcome |
| LGALS1 | SNV | Missense_Mutation | c.307G>T | p.Asp103Tyr | p.D103Y | P09382 | protein_coding | deleterious(0) | probably_damaging(0.994) | TCGA-A1-A0SI-01 | Breast | breast invasive carcinoma | Female | <65 | I/II | Unknown | Unknown | SD | |
| LGALS1 | SNV | Missense_Mutation | rs113281514 | c.8N>T | p.Cys3Phe | p.C3F | P09382 | protein_coding | tolerated(0.07) | benign(0.165) | TCGA-A2-A25A-01 | Breast | breast invasive carcinoma | Female | <65 | I/II | Unspecific | Cytoxan | SD |
| LGALS1 | SNV | Missense_Mutation | c.62N>A | p.Arg21Gln | p.R21Q | P09382 | protein_coding | tolerated(0.16) | benign(0.007) | TCGA-A7-A26H-01 | Breast | breast invasive carcinoma | Female | >=65 | I/II | Hormone Therapy | anastrozole | PD | |
| LGALS1 | SNV | Missense_Mutation | novel | c.259N>C | p.Glu87Gln | p.E87Q | P09382 | protein_coding | tolerated(0.05) | benign(0.131) | TCGA-BH-A2L8-01 | Breast | breast invasive carcinoma | Female | <65 | I/II | Chemotherapy | cytoxan | CR |
| LGALS1 | SNV | Missense_Mutation | novel | c.55N>G | p.Arg19Gly | p.R19G | P09382 | protein_coding | tolerated(0.23) | benign(0.189) | TCGA-VS-A94Z-01 | Cervix | cervical & endocervical cancer | Female | <65 | I/II | Chemotherapy | cisplatin | CR |
| LGALS1 | SNV | Missense_Mutation | c.316G>A | p.Glu106Lys | p.E106K | P09382 | protein_coding | deleterious(0.04) | benign(0.113) | TCGA-AA-3814-01 | Colorectum | colon adenocarcinoma | Female | >=65 | I/II | Unknown | Unknown | SD | |
| LGALS1 | SNV | Missense_Mutation | c.128G>A | p.Cys43Tyr | p.C43Y | P09382 | protein_coding | tolerated(0.16) | possibly_damaging(0.897) | TCGA-AP-A059-01 | Endometrium | uterine corpus endometrioid carcinoma | Female | >=65 | I/II | Unknown | Unknown | SD | |
| LGALS1 | SNV | Missense_Mutation | rs111700736 | c.146N>A | p.Arg49His | p.R49H | P09382 | protein_coding | deleterious(0.04) | possibly_damaging(0.754) | TCGA-AX-A0IU-01 | Endometrium | uterine corpus endometrioid carcinoma | Female | >=65 | III/IV | Chemotherapy | carboplatin | SD |
| LGALS1 | SNV | Missense_Mutation | novel | c.355N>G | p.Asn119Asp | p.N119D | P09382 | protein_coding | tolerated(0.71) | benign(0.005) | TCGA-95-7567-01 | Lung | lung adenocarcinoma | Male | <65 | I/II | Chemotherapy | cisplatin | SD |
| LGALS1 | SNV | Missense_Mutation | novel | c.299A>G | p.Lys100Arg | p.K100R | P09382 | protein_coding | tolerated(0.11) | benign(0.005) | TCGA-66-2778-01 | Lung | lung squamous cell carcinoma | Female | >=65 | III/IV | Chemotherapy | cisplatin | CR |
| Page: 1 2 |
Top |
Related drugs of malignant transformation related genes |
| Identification of chemicals and drugs interact with genes involved in malignant transfromation |
| (DGIdb 4.0) |
| Entrez ID | Symbol | Category | Interaction Types | Drug Claim Name | Drug Name | PMIDs |
| 3956 | LGALS1 | KINASE, DRUGGABLE GENOME | US8703720, Reference Compound 2 | |||
| 3956 | LGALS1 | KINASE, DRUGGABLE GENOME | US8703720, 15 | |||
| 3956 | LGALS1 | KINASE, DRUGGABLE GENOME | US8703720, Reference Compound 1 |
| Page: 1 |

Copyright 2023-Present -The University of Texas Health Science Center at Houston |