
|
|||||
|
 | |
| |
| |
| |
| |
| |
|
Gene: KIF3B |
Gene summary for KIF3B |
| Gene information | Species | Human | Gene symbol | KIF3B | Gene ID | 9371 |
| Gene name | kinesin family member 3B | |
| Gene Alias | FLA8 | |
| Cytomap | 20q11.21 | |
| Gene Type | protein-coding | GO ID | GO:0000226 | UniProtAcc | O15066 |
Top |
Malignant transformation analysis |
| Identification of the aberrant gene expression in precancerous and cancerous lesions by comparing the gene expression of stem-like cells in diseased tissues with normal stem cells |
| Entrez ID | Symbol | Replicates | Species | Organ | Tissue | Adj P-value | Log2FC | Malignancy |
| 9371 | KIF3B | HTA11_3410_2000001011 | Human | Colorectum | AD | 2.38e-02 | 1.68e-01 | 0.0155 |
| 9371 | KIF3B | HTA11_1938_2000001011 | Human | Colorectum | AD | 7.23e-05 | 5.03e-01 | -0.0811 |
| 9371 | KIF3B | HTA11_347_2000001011 | Human | Colorectum | AD | 6.04e-15 | 5.90e-01 | -0.1954 |
| 9371 | KIF3B | HTA11_696_2000001011 | Human | Colorectum | AD | 6.16e-09 | 4.02e-01 | -0.1464 |
| 9371 | KIF3B | HTA11_866_2000001011 | Human | Colorectum | AD | 1.36e-07 | 3.03e-01 | -0.1001 |
| 9371 | KIF3B | HTA11_1391_2000001011 | Human | Colorectum | AD | 2.54e-07 | 6.20e-01 | -0.059 |
| 9371 | KIF3B | HTA11_546_2000001011 | Human | Colorectum | AD | 1.66e-02 | 4.04e-01 | -0.0842 |
| 9371 | KIF3B | HTA11_7663_2000001011 | Human | Colorectum | SER | 4.54e-03 | 6.01e-01 | 0.0131 |
| 9371 | KIF3B | HTA11_7696_3000711011 | Human | Colorectum | AD | 3.86e-11 | 3.92e-01 | 0.0674 |
| 9371 | KIF3B | HTA11_99999965104_69814 | Human | Colorectum | MSS | 4.89e-02 | 3.72e-01 | 0.281 |
| 9371 | KIF3B | HTA11_99999971662_82457 | Human | Colorectum | MSS | 1.04e-40 | 1.12e+00 | 0.3859 |
| 9371 | KIF3B | HTA11_99999973899_84307 | Human | Colorectum | MSS | 4.26e-06 | 6.91e-01 | 0.2585 |
| 9371 | KIF3B | HTA11_99999974143_84620 | Human | Colorectum | MSS | 1.25e-03 | 2.59e-01 | 0.3005 |
| 9371 | KIF3B | A002-C-205 | Human | Colorectum | FAP | 8.21e-03 | 1.15e-01 | -0.1236 |
| 9371 | KIF3B | A015-C-104 | Human | Colorectum | FAP | 1.66e-02 | 6.78e-03 | -0.1899 |
| 9371 | KIF3B | A002-C-116 | Human | Colorectum | FAP | 1.00e-02 | 4.09e-03 | -0.0452 |
| 9371 | KIF3B | CRC-3-11773 | Human | Colorectum | CRC | 4.91e-08 | 4.84e-01 | 0.2564 |
| 9371 | KIF3B | LZE4T | Human | Esophagus | ESCC | 2.50e-08 | 2.01e-01 | 0.0811 |
| 9371 | KIF3B | LZE20T | Human | Esophagus | ESCC | 3.97e-02 | 5.39e-02 | 0.0662 |
| 9371 | KIF3B | LZE24T | Human | Esophagus | ESCC | 1.33e-21 | 7.32e-01 | 0.0596 |
| Page: 1 2 3 4 5 6 7 |
| Tissue | Expression Dynamics | Abbreviation |
| Colorectum (GSE201348) |  | FAP: Familial adenomatous polyposis |
| CRC: Colorectal cancer | ||
| Colorectum (HTA11) |  | AD: Adenomas |
| SER: Sessile serrated lesions | ||
| MSI-H: Microsatellite-high colorectal cancer | ||
| MSS: Microsatellite stable colorectal cancer | ||
| Esophagus |  | ESCC: Esophageal squamous cell carcinoma |
| HGIN: High-grade intraepithelial neoplasias | ||
| LGIN: Low-grade intraepithelial neoplasias | ||
| Liver | 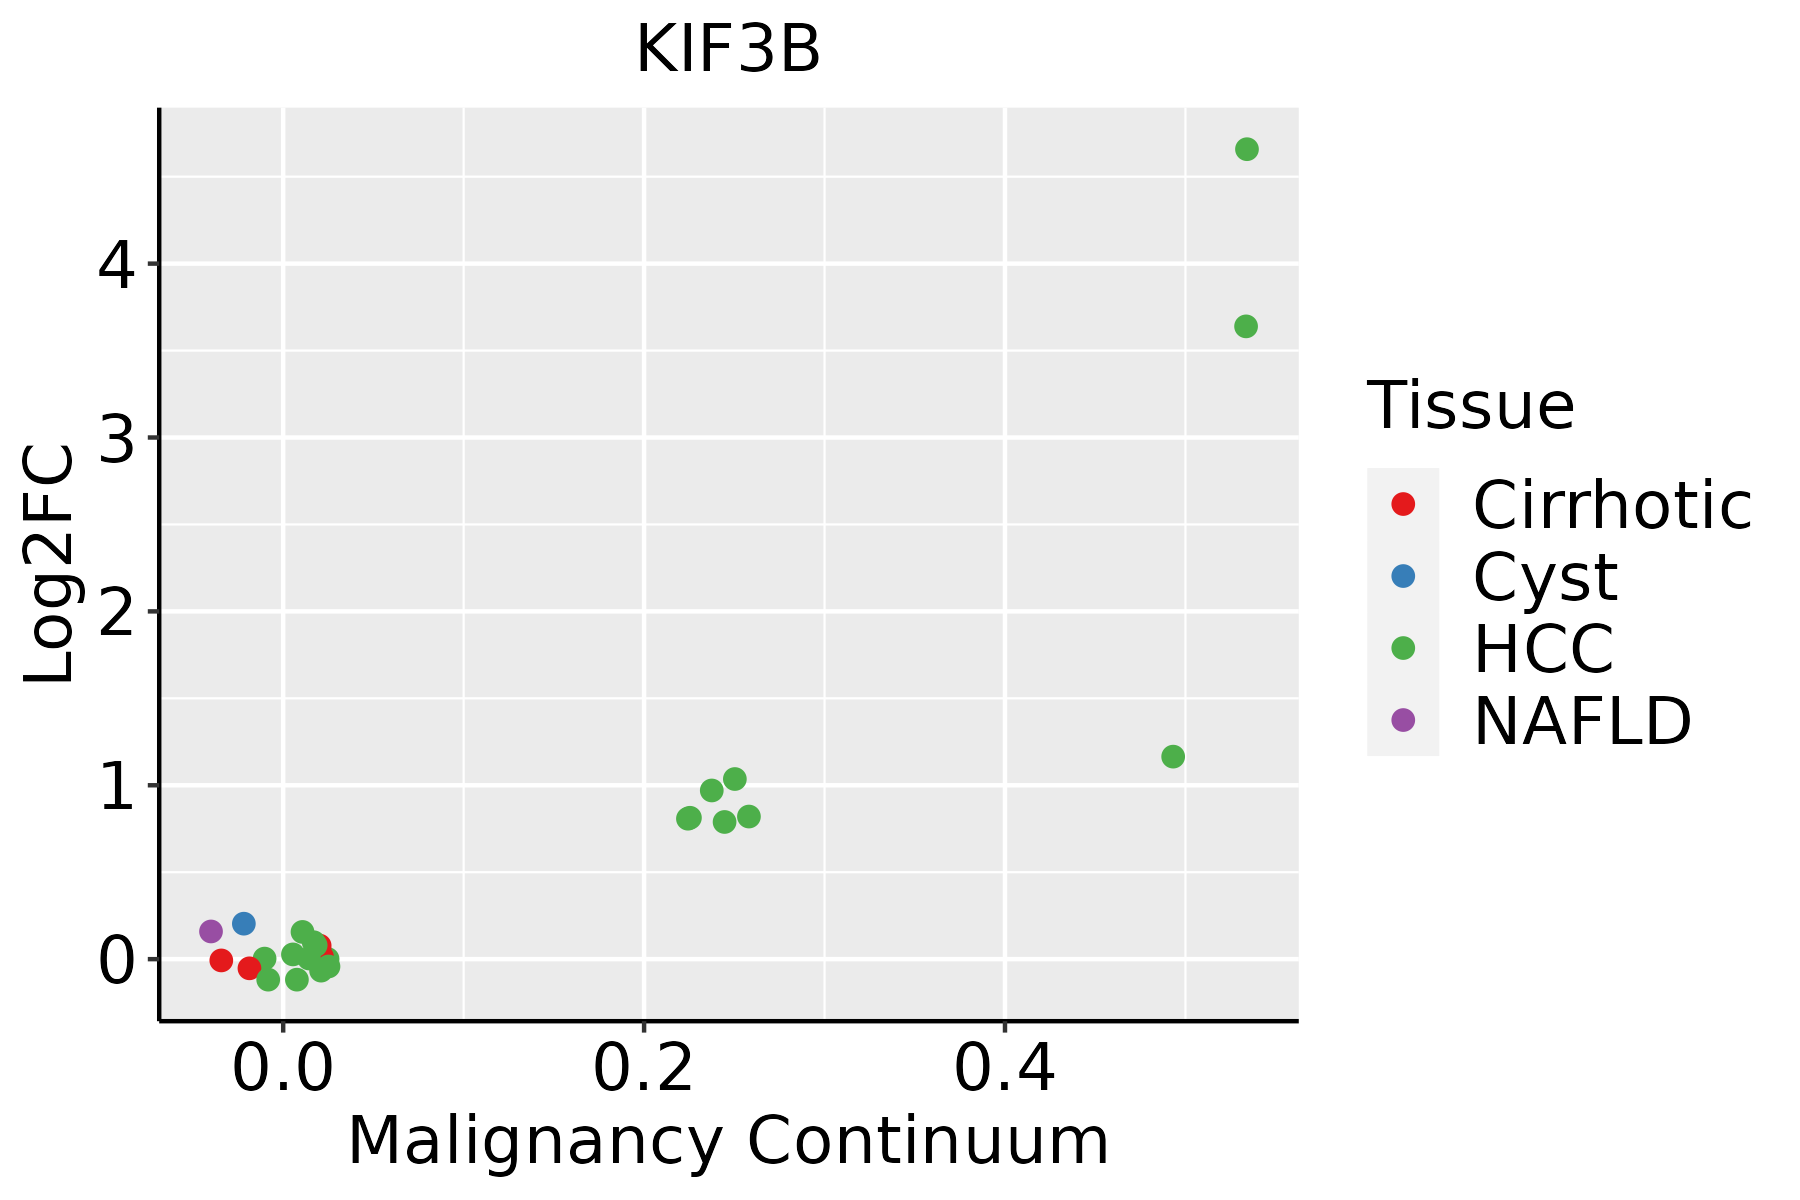 | HCC: Hepatocellular carcinoma |
| NAFLD: Non-alcoholic fatty liver disease | ||
| Oral Cavity | 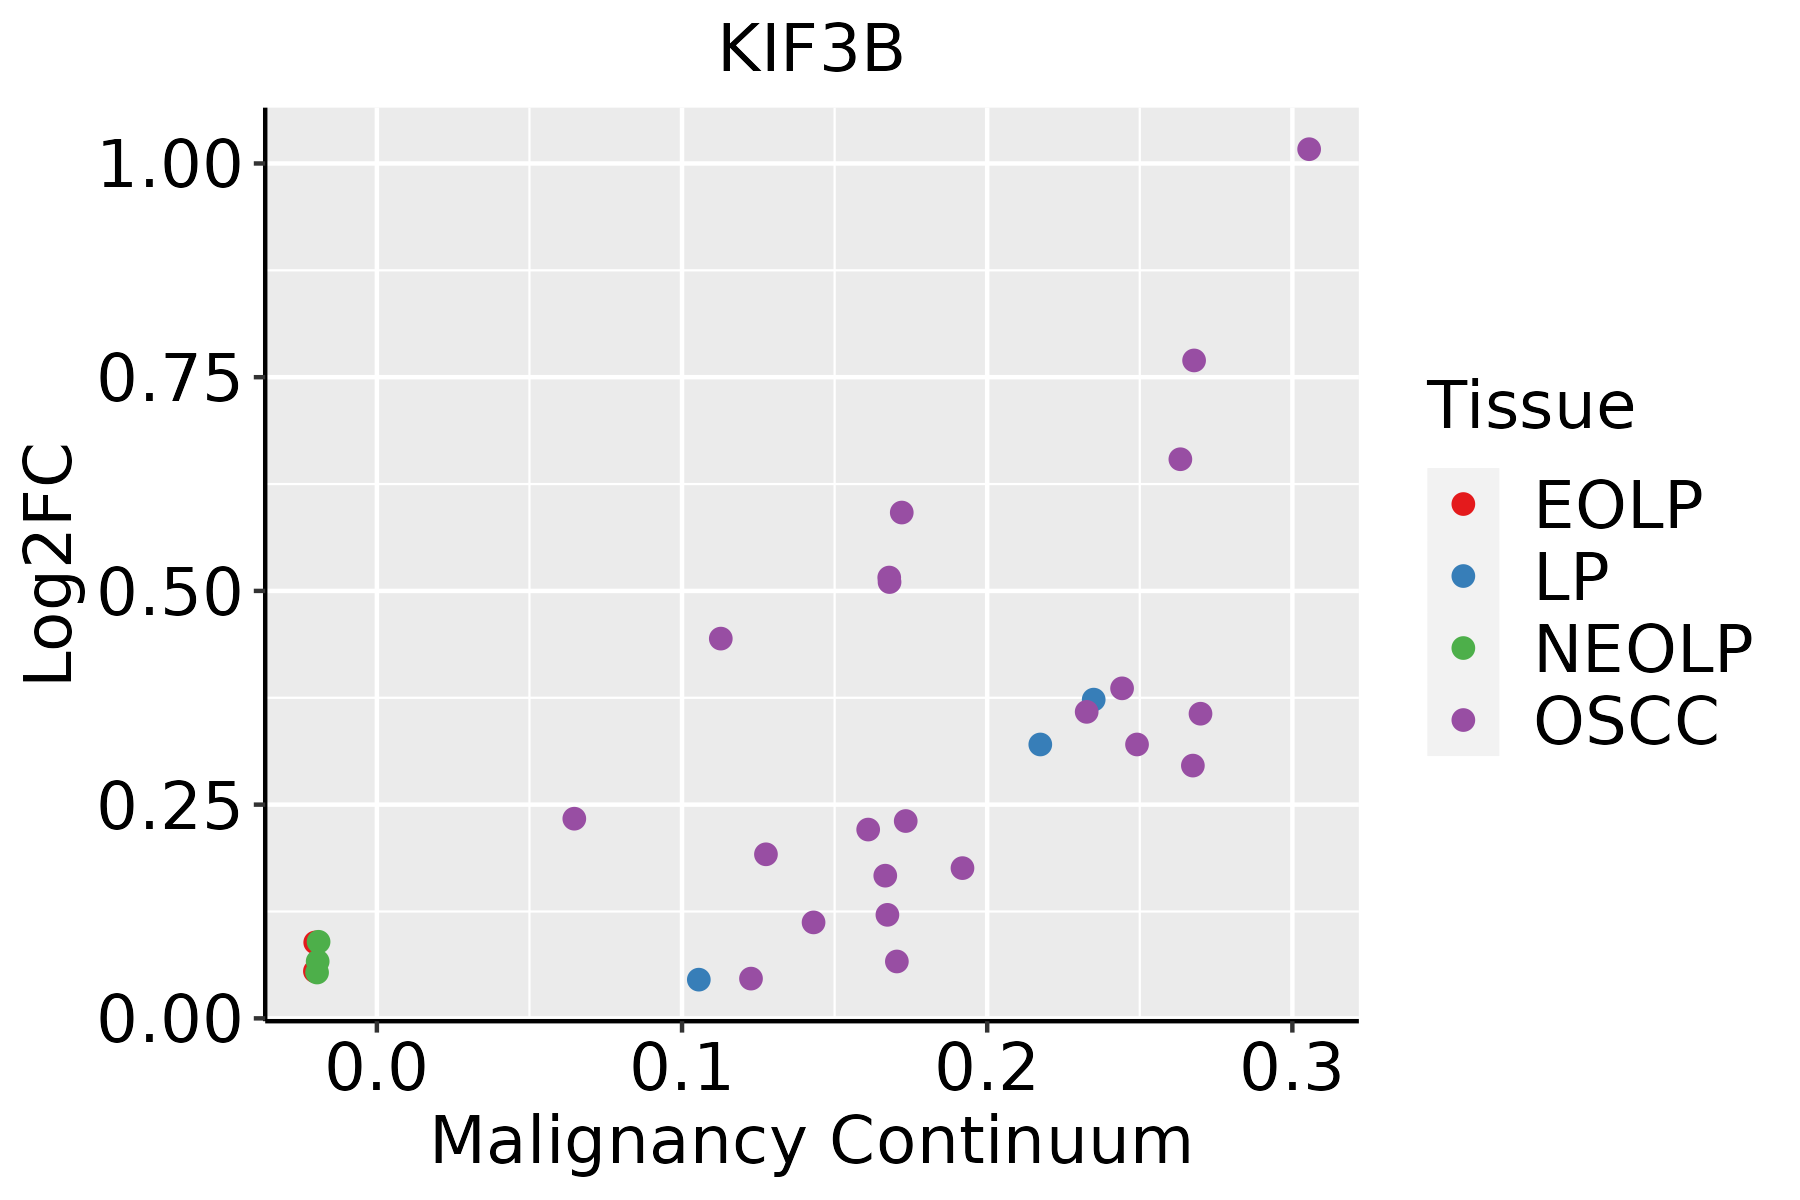 | EOLP: Erosive Oral lichen planus |
| LP: leukoplakia | ||
| NEOLP: Non-erosive oral lichen planus | ||
| OSCC: Oral squamous cell carcinoma | ||
| Prostate |  | BPH: Benign Prostatic Hyperplasia |
| Thyroid | 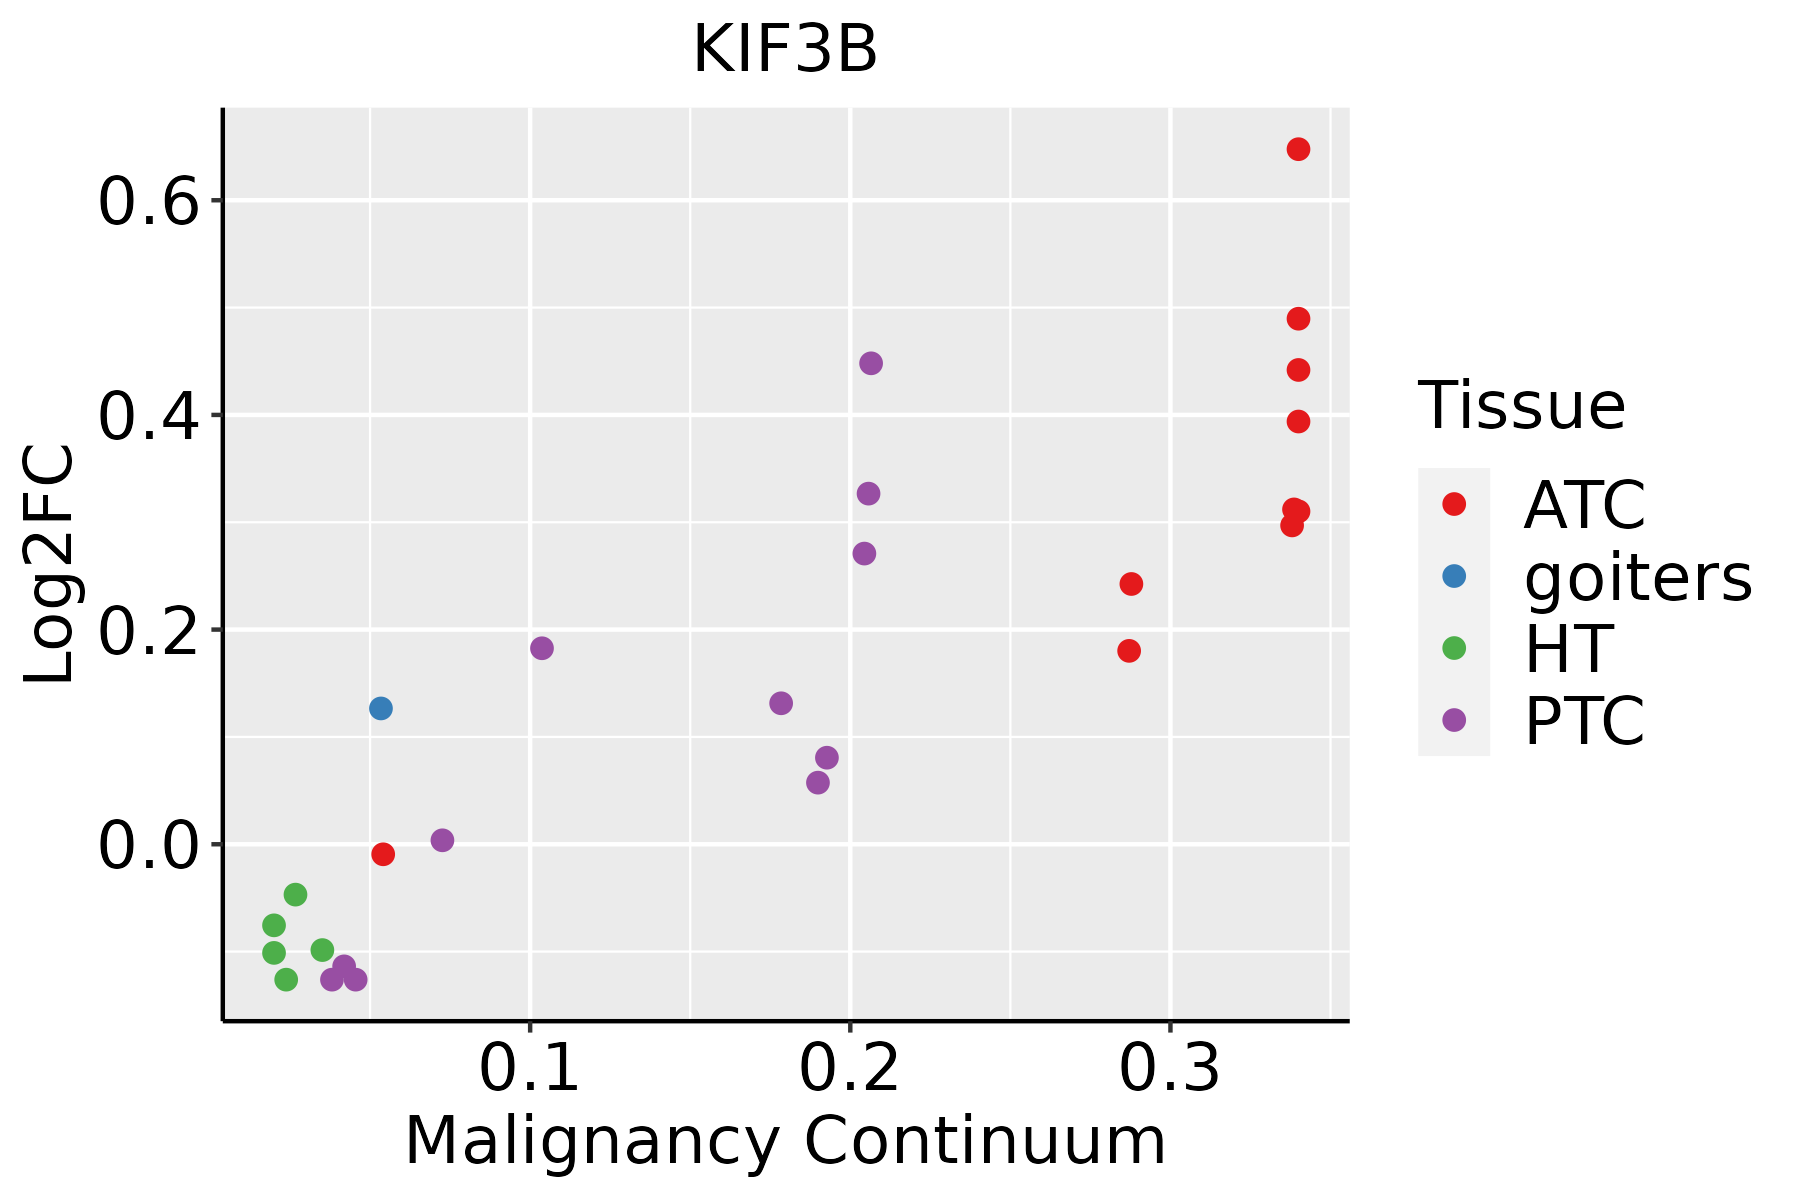 | ATC: Anaplastic thyroid cancer |
| HT: Hashimoto's thyroiditis | ||
| PTC: Papillary thyroid cancer |
| ∗log2FC in expression of this searched gene in stem-like cells from each diseased tissue sample relative to stem-like cells in normal samples in each tissue plotted against the malignancy continuum. Samples are colored based on if they are from different disease stage. |
Top |
Malignant transformation related pathway analysis |
| Find out the enriched GO biological processes and KEGG pathways involved in transition from healthy to precancer to cancer |
| Tissue | Disease Stage | Enriched GO biological Processes |
| Colorectum | AD |  |
| Colorectum | SER |  |
| Colorectum | MSS |  |
| Colorectum | MSI-H |  |
| Colorectum | FAP |  |
| ∗Top 15 enriched GO BP terms are showed in the bar plot of each disease state in each tissue. Each row represents a significant GO biological process which is colored according to the -log10(p.adjust). |
| Page: 1 2 3 4 5 6 7 8 9 |
| GO ID | Tissue | Disease Stage | Description | Gene Ratio | Bg Ratio | pvalue | p.adjust | Count |
| GO:00009109 | Prostate | BPH | cytokinesis | 55/3107 | 173/18723 | 5.81e-07 | 1.15e-05 | 55 |
| GO:00516508 | Prostate | BPH | establishment of vesicle localization | 49/3107 | 161/18723 | 9.12e-06 | 1.28e-04 | 49 |
| GO:00109705 | Prostate | BPH | transport along microtubule | 47/3107 | 155/18723 | 1.53e-05 | 1.95e-04 | 47 |
| GO:00457878 | Prostate | BPH | positive regulation of cell cycle | 81/3107 | 313/18723 | 1.76e-05 | 2.18e-04 | 81 |
| GO:00516488 | Prostate | BPH | vesicle localization | 51/3107 | 177/18723 | 3.20e-05 | 3.61e-04 | 51 |
| GO:00315033 | Prostate | BPH | protein-containing complex localization | 59/3107 | 220/18723 | 8.01e-05 | 7.66e-04 | 59 |
| GO:19028505 | Prostate | BPH | microtubule cytoskeleton organization involved in mitosis | 43/3107 | 147/18723 | 8.78e-05 | 8.27e-04 | 43 |
| GO:00070525 | Prostate | BPH | mitotic spindle organization | 36/3107 | 120/18723 | 1.83e-04 | 1.54e-03 | 36 |
| GO:00080888 | Prostate | BPH | axo-dendritic transport | 25/3107 | 75/18723 | 2.94e-04 | 2.28e-03 | 25 |
| GO:00903075 | Prostate | BPH | mitotic spindle assembly | 22/3107 | 65/18723 | 5.23e-04 | 3.68e-03 | 22 |
| GO:00070516 | Prostate | BPH | spindle organization | 48/3107 | 184/18723 | 6.91e-04 | 4.60e-03 | 48 |
| GO:00991112 | Prostate | BPH | microtubule-based transport | 49/3107 | 190/18723 | 8.05e-04 | 5.27e-03 | 49 |
| GO:00723844 | Prostate | BPH | organelle transport along microtubule | 26/3107 | 85/18723 | 9.92e-04 | 6.24e-03 | 26 |
| GO:00900687 | Prostate | BPH | positive regulation of cell cycle process | 58/3107 | 236/18723 | 1.03e-03 | 6.46e-03 | 58 |
| GO:00995183 | Prostate | BPH | vesicle cytoskeletal trafficking | 23/3107 | 73/18723 | 1.22e-03 | 7.41e-03 | 23 |
| GO:01400144 | Prostate | BPH | mitotic nuclear division | 67/3107 | 287/18723 | 1.87e-03 | 1.07e-02 | 67 |
| GO:00989302 | Prostate | BPH | axonal transport | 20/3107 | 64/18723 | 2.75e-03 | 1.46e-02 | 20 |
| GO:00512254 | Prostate | BPH | spindle assembly | 31/3107 | 117/18723 | 4.39e-03 | 2.16e-02 | 31 |
| GO:00324651 | Prostate | BPH | regulation of cytokinesis | 25/3107 | 92/18723 | 7.02e-03 | 3.14e-02 | 25 |
| GO:00513023 | Prostate | BPH | regulation of cell division | 42/3107 | 177/18723 | 8.93e-03 | 3.82e-02 | 42 |
| Page: 1 2 3 4 5 6 7 8 9 10 11 12 |
| Pathway ID | Tissue | Disease Stage | Description | Gene Ratio | Bg Ratio | pvalue | p.adjust | qvalue | Count |
| Page: 1 |
Top |
Cell-cell communication analysis |
| Identification of potential cell-cell interactions between two cell types and their ligand-receptor pairs for different disease states |
| Ligand | Receptor | LRpair | Pathway | Tissue | Disease Stage |
| Page: 1 |
Top |
Single-cell gene regulatory network inference analysis |
| Find out the significant the regulons (TFs) and the target genes of each regulon across cell types for different disease states |
| TF | Cell Type | Tissue | Disease Stage | Target Gene | RSS | Regulon Activity |
| ∗The dot plots of a searched regulon are shown for all cell subpopulations in each disease state of each tissue based on the regulon specific score inferred using pySCENIC and by calculating the average expression. |
| Page: 1 |
Top |
Somatic mutation of malignant transformation related genes |
| Annotation of somatic variants for genes involved in malignant transformation |
| Hugo Symbol | Variant Class | Variant Classification | dbSNP RS | HGVSc | HGVSp | HGVSp Short | SWISSPROT | BIOTYPE | SIFT | PolyPhen | Tumor Sample Barcode | Tissue | Histology | Sex | Age | Stage | Therapy Types | Drugs | Outcome |
| KIF3B | SNV | Missense_Mutation | c.1484N>T | p.Lys495Ile | p.K495I | O15066 | protein_coding | deleterious(0) | possibly_damaging(0.514) | TCGA-A7-A13D-01 | Breast | breast invasive carcinoma | Female | <65 | I/II | Chemotherapy | cytoxan | SD | |
| KIF3B | SNV | Missense_Mutation | c.1579T>C | p.Tyr527His | p.Y527H | O15066 | protein_coding | tolerated(0.07) | probably_damaging(0.947) | TCGA-AO-A128-01 | Breast | breast invasive carcinoma | Female | <65 | I/II | Chemotherapy | doxorubicin | SD | |
| KIF3B | SNV | Missense_Mutation | novel | c.122N>G | p.Val41Gly | p.V41G | O15066 | protein_coding | deleterious(0) | probably_damaging(0.99) | TCGA-BH-A1F8-01 | Breast | breast invasive carcinoma | Female | >=65 | III/IV | Unknown | Unknown | PD |
| KIF3B | SNV | Missense_Mutation | novel | c.1367A>G | p.Glu456Gly | p.E456G | O15066 | protein_coding | deleterious(0) | possibly_damaging(0.71) | TCGA-C8-A273-01 | Breast | breast invasive carcinoma | Female | <65 | I/II | Hormone Therapy | tamoxiphen | SD |
| KIF3B | insertion | Nonsense_Mutation | novel | c.2191_2192insATCATT | p.Gly731delinsAspHisTer | p.G731delinsDH* | O15066 | protein_coding | TCGA-AR-A0TY-01 | Breast | breast invasive carcinoma | Female | <65 | I/II | Unspecific | Paclitaxel | PD | ||
| KIF3B | insertion | In_Frame_Ins | novel | c.2192_2193insGAAACTACATCCTAT | p.Gly731_Thr732insLysLeuHisProIle | p.G731_T732insKLHPI | O15066 | protein_coding | TCGA-AR-A0TY-01 | Breast | breast invasive carcinoma | Female | <65 | I/II | Unspecific | Paclitaxel | PD | ||
| KIF3B | SNV | Missense_Mutation | novel | c.952N>A | p.Gly318Arg | p.G318R | O15066 | protein_coding | deleterious(0) | probably_damaging(1) | TCGA-2W-A8YY-01 | Cervix | cervical & endocervical cancer | Female | <65 | I/II | Chemotherapy | cisplatin | CR |
| KIF3B | SNV | Missense_Mutation | c.646N>G | p.His216Asp | p.H216D | O15066 | protein_coding | deleterious(0) | probably_damaging(1) | TCGA-BI-A0VR-01 | Cervix | cervical & endocervical cancer | Female | <65 | III/IV | Unknown | Unknown | SD | |
| KIF3B | SNV | Missense_Mutation | novel | c.1231N>T | p.Asp411Tyr | p.D411Y | O15066 | protein_coding | deleterious(0.01) | benign(0.396) | TCGA-C5-A1MN-01 | Cervix | cervical & endocervical cancer | Female | <65 | III/IV | Chemotherapy | cisplatin | SD |
| KIF3B | SNV | Missense_Mutation | novel | c.2186N>T | p.Ser729Phe | p.S729F | O15066 | protein_coding | deleterious(0.04) | benign(0.133) | TCGA-C5-A2LY-01 | Cervix | cervical & endocervical cancer | Female | <65 | I/II | Chemotherapy | cisplatin | SD |
| Page: 1 2 3 4 5 6 7 8 |
Top |
Related drugs of malignant transformation related genes |
| Identification of chemicals and drugs interact with genes involved in malignant transfromation |
| (DGIdb 4.0) |
| Entrez ID | Symbol | Category | Interaction Types | Drug Claim Name | Drug Name | PMIDs |
| Page: 1 |

Copyright 2023-Present -The University of Texas Health Science Center at Houston |