
|
|||||
|
 | |
| |
| |
| |
| |
| |
|
Gene: JMJD6 |
Gene summary for JMJD6 |
| Gene information | Species | Human | Gene symbol | JMJD6 | Gene ID | 23210 |
| Gene name | jumonji domain containing 6, arginine demethylase and lysine hydroxylase | |
| Gene Alias | PSR | |
| Cytomap | 17q25.1 | |
| Gene Type | protein-coding | GO ID | GO:0000375 | UniProtAcc | Q6NYC1 |
Top |
Malignant transformation analysis |
| Identification of the aberrant gene expression in precancerous and cancerous lesions by comparing the gene expression of stem-like cells in diseased tissues with normal stem cells |
| Entrez ID | Symbol | Replicates | Species | Organ | Tissue | Adj P-value | Log2FC | Malignancy |
| 23210 | JMJD6 | LZE4T | Human | Esophagus | ESCC | 2.74e-12 | 5.67e-01 | 0.0811 |
| 23210 | JMJD6 | LZE7T | Human | Esophagus | ESCC | 4.25e-07 | 4.81e-01 | 0.0667 |
| 23210 | JMJD6 | LZE8T | Human | Esophagus | ESCC | 4.14e-14 | 1.94e-01 | 0.067 |
| 23210 | JMJD6 | LZE20T | Human | Esophagus | ESCC | 2.53e-02 | 2.43e-01 | 0.0662 |
| 23210 | JMJD6 | LZE24T | Human | Esophagus | ESCC | 2.42e-08 | 3.78e-01 | 0.0596 |
| 23210 | JMJD6 | LZE21T | Human | Esophagus | ESCC | 4.90e-05 | 5.61e-01 | 0.0655 |
| 23210 | JMJD6 | LZE6T | Human | Esophagus | ESCC | 1.05e-08 | 3.73e-01 | 0.0845 |
| 23210 | JMJD6 | P1T-E | Human | Esophagus | ESCC | 1.14e-12 | 5.71e-01 | 0.0875 |
| 23210 | JMJD6 | P2T-E | Human | Esophagus | ESCC | 3.96e-35 | 7.20e-01 | 0.1177 |
| 23210 | JMJD6 | P4T-E | Human | Esophagus | ESCC | 3.44e-15 | 4.70e-01 | 0.1323 |
| 23210 | JMJD6 | P5T-E | Human | Esophagus | ESCC | 3.80e-13 | 3.49e-01 | 0.1327 |
| 23210 | JMJD6 | P8T-E | Human | Esophagus | ESCC | 3.23e-25 | 4.68e-01 | 0.0889 |
| 23210 | JMJD6 | P9T-E | Human | Esophagus | ESCC | 4.67e-12 | 2.59e-01 | 0.1131 |
| 23210 | JMJD6 | P10T-E | Human | Esophagus | ESCC | 2.23e-07 | 1.16e-01 | 0.116 |
| 23210 | JMJD6 | P11T-E | Human | Esophagus | ESCC | 5.15e-24 | 1.89e+00 | 0.1426 |
| 23210 | JMJD6 | P12T-E | Human | Esophagus | ESCC | 5.87e-38 | 9.78e-01 | 0.1122 |
| 23210 | JMJD6 | P15T-E | Human | Esophagus | ESCC | 4.96e-20 | 6.07e-01 | 0.1149 |
| 23210 | JMJD6 | P16T-E | Human | Esophagus | ESCC | 7.82e-28 | 6.49e-01 | 0.1153 |
| 23210 | JMJD6 | P17T-E | Human | Esophagus | ESCC | 6.00e-06 | 3.05e-01 | 0.1278 |
| 23210 | JMJD6 | P19T-E | Human | Esophagus | ESCC | 1.70e-03 | 2.33e-01 | 0.1662 |
| Page: 1 2 3 4 5 |
| Tissue | Expression Dynamics | Abbreviation |
| Esophagus |  | ESCC: Esophageal squamous cell carcinoma |
| HGIN: High-grade intraepithelial neoplasias | ||
| LGIN: Low-grade intraepithelial neoplasias | ||
| Liver |  | HCC: Hepatocellular carcinoma |
| NAFLD: Non-alcoholic fatty liver disease | ||
| Oral Cavity | 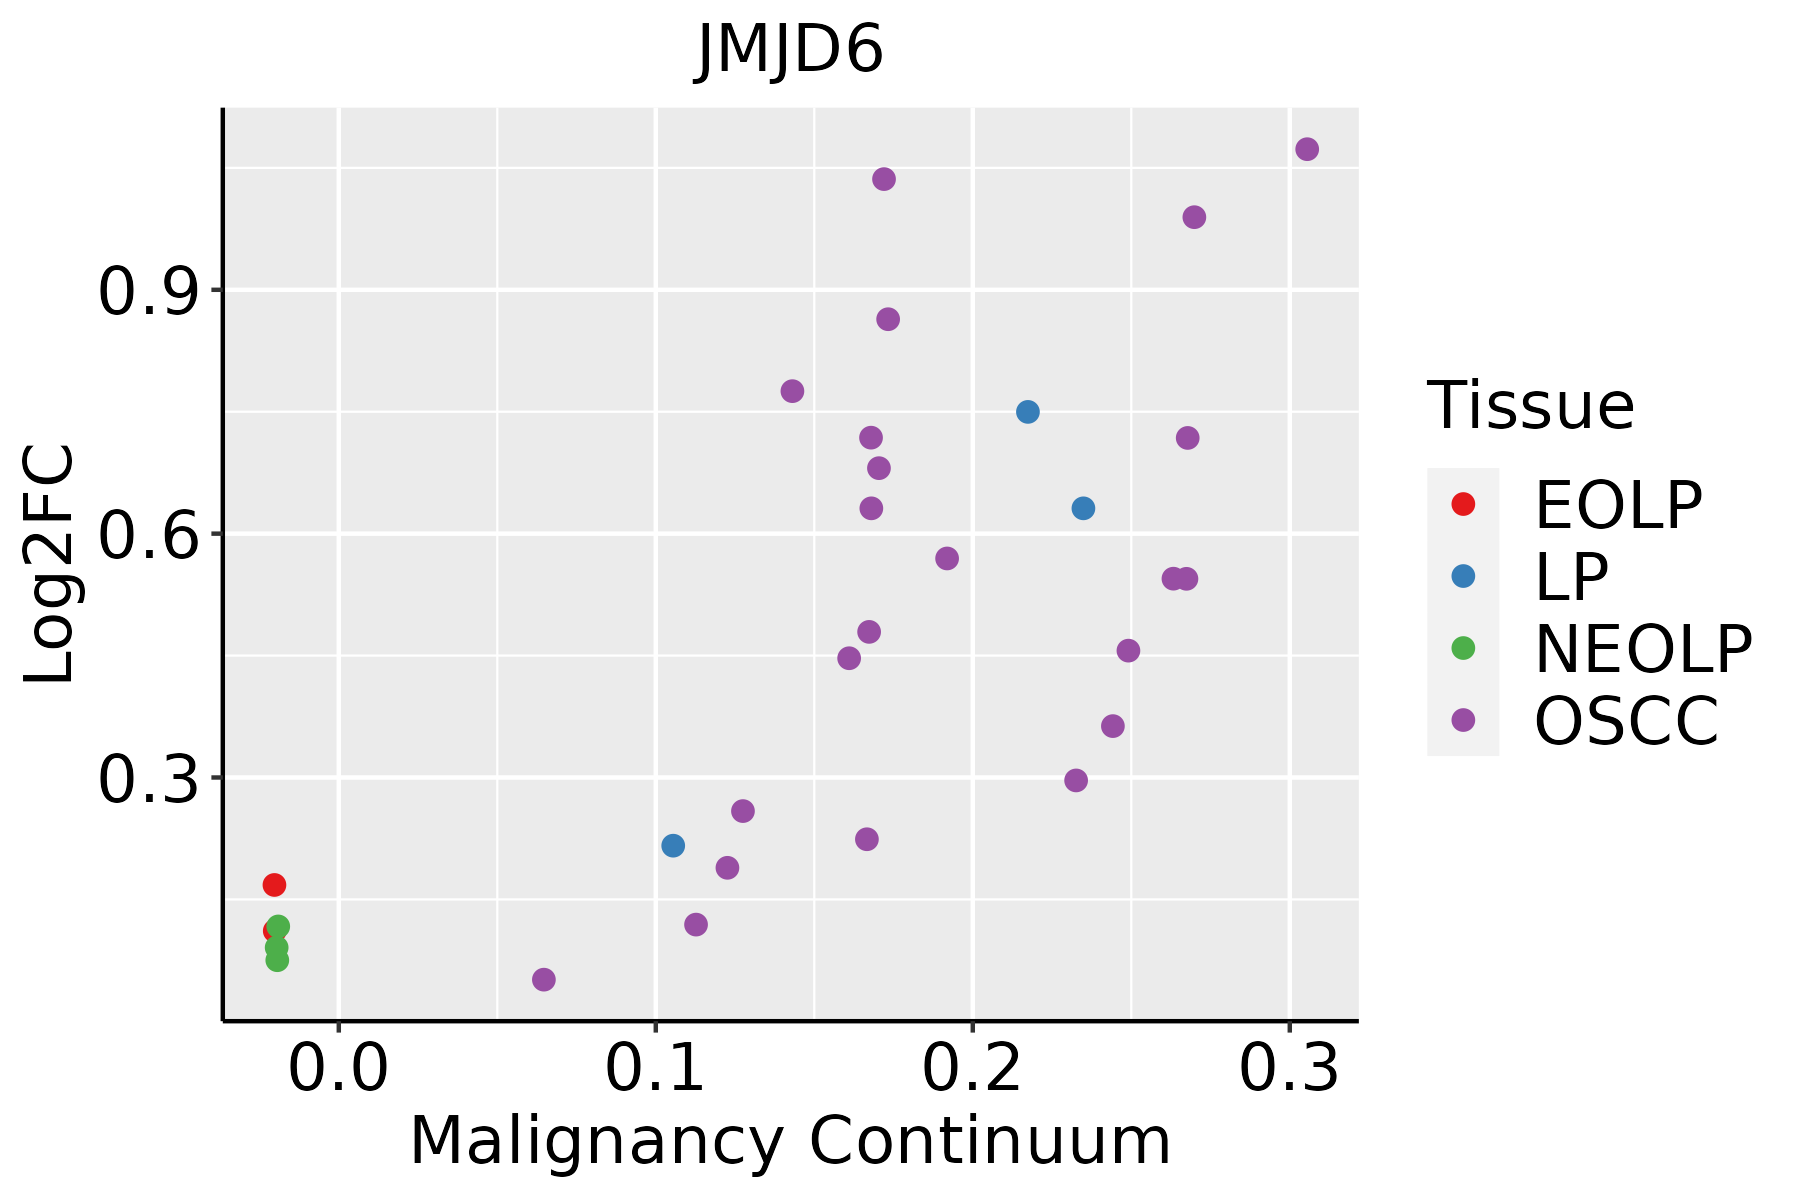 | EOLP: Erosive Oral lichen planus |
| LP: leukoplakia | ||
| NEOLP: Non-erosive oral lichen planus | ||
| OSCC: Oral squamous cell carcinoma |
| ∗log2FC in expression of this searched gene in stem-like cells from each diseased tissue sample relative to stem-like cells in normal samples in each tissue plotted against the malignancy continuum. Samples are colored based on if they are from different disease stage. |
Top |
Malignant transformation related pathway analysis |
| Find out the enriched GO biological processes and KEGG pathways involved in transition from healthy to precancer to cancer |
| Tissue | Disease Stage | Enriched GO biological Processes |
| Colorectum | AD |  |
| Colorectum | SER |  |
| Colorectum | MSS |  |
| Colorectum | MSI-H |  |
| Colorectum | FAP |  |
| ∗Top 15 enriched GO BP terms are showed in the bar plot of each disease state in each tissue. Each row represents a significant GO biological process which is colored according to the -log10(p.adjust). |
| Page: 1 2 3 4 5 6 7 8 9 |
| GO ID | Tissue | Disease Stage | Description | Gene Ratio | Bg Ratio | pvalue | p.adjust | Count |
| GO:003032315 | Oral cavity | NEOLP | respiratory tube development | 33/2005 | 181/18723 | 1.58e-03 | 1.11e-02 | 33 |
| GO:003021721 | Oral cavity | NEOLP | T cell differentiation | 43/2005 | 257/18723 | 2.05e-03 | 1.36e-02 | 43 |
| GO:006054114 | Oral cavity | NEOLP | respiratory system development | 35/2005 | 203/18723 | 3.08e-03 | 1.88e-02 | 35 |
| GO:003032416 | Oral cavity | NEOLP | lung development | 31/2005 | 177/18723 | 4.04e-03 | 2.30e-02 | 31 |
| GO:0002040 | Oral cavity | NEOLP | sprouting angiogenesis | 32/2005 | 185/18723 | 4.29e-03 | 2.42e-02 | 32 |
| GO:00720017 | Oral cavity | NEOLP | renal system development | 47/2005 | 302/18723 | 5.60e-03 | 2.97e-02 | 47 |
| GO:00064823 | Oral cavity | NEOLP | protein demethylation | 9/2005 | 33/18723 | 6.45e-03 | 3.32e-02 | 9 |
| GO:00082143 | Oral cavity | NEOLP | protein dealkylation | 9/2005 | 33/18723 | 6.45e-03 | 3.32e-02 | 9 |
| GO:00018226 | Oral cavity | NEOLP | kidney development | 45/2005 | 293/18723 | 8.36e-03 | 4.08e-02 | 45 |
| Page: 1 2 3 4 5 6 7 8 |
| Pathway ID | Tissue | Disease Stage | Description | Gene Ratio | Bg Ratio | pvalue | p.adjust | qvalue | Count |
| Page: 1 |
Top |
Cell-cell communication analysis |
| Identification of potential cell-cell interactions between two cell types and their ligand-receptor pairs for different disease states |
| Ligand | Receptor | LRpair | Pathway | Tissue | Disease Stage |
| Page: 1 |
Top |
Single-cell gene regulatory network inference analysis |
| Find out the significant the regulons (TFs) and the target genes of each regulon across cell types for different disease states |
| TF | Cell Type | Tissue | Disease Stage | Target Gene | RSS | Regulon Activity |
| ∗The dot plots of a searched regulon are shown for all cell subpopulations in each disease state of each tissue based on the regulon specific score inferred using pySCENIC and by calculating the average expression. |
| Page: 1 |
Top |
Somatic mutation of malignant transformation related genes |
| Annotation of somatic variants for genes involved in malignant transformation |
| Hugo Symbol | Variant Class | Variant Classification | dbSNP RS | HGVSc | HGVSp | HGVSp Short | SWISSPROT | BIOTYPE | SIFT | PolyPhen | Tumor Sample Barcode | Tissue | Histology | Sex | Age | Stage | Therapy Types | Drugs | Outcome |
| JMJD6 | SNV | Missense_Mutation | c.235N>G | p.Trp79Gly | p.W79G | Q6NYC1 | protein_coding | deleterious(0) | probably_damaging(1) | TCGA-A8-A09D-01 | Breast | breast invasive carcinoma | Female | <65 | I/II | Chemotherapy | doxorubicin | CR | |
| JMJD6 | SNV | Missense_Mutation | c.754N>A | p.Phe252Ile | p.F252I | Q6NYC1 | protein_coding | tolerated(0.11) | benign(0.014) | TCGA-BH-A18G-01 | Breast | breast invasive carcinoma | Female | >=65 | I/II | Unknown | Unknown | SD | |
| JMJD6 | SNV | Missense_Mutation | c.944N>G | p.Ile315Ser | p.I315S | Q6NYC1 | protein_coding | tolerated(0.76) | benign(0.006) | TCGA-E9-A1N8-01 | Breast | breast invasive carcinoma | Female | <65 | I/II | Chemotherapy | doxorubicin | SD | |
| JMJD6 | insertion | In_Frame_Ins | novel | c.1120_1121insAGAGTTGGGGACCTAGAACATCAGGAGGACCCTGGGTCT | p.Arg374delinsLysSerTrpGlyProArgThrSerGlyGlyProTrpValTrp | p.R374delinsKSWGPRTSGGPWVW | Q6NYC1 | protein_coding | TCGA-A8-A06X-01 | Breast | breast invasive carcinoma | Female | >=65 | I/II | Unknown | Unknown | SD | ||
| JMJD6 | insertion | Frame_Shift_Ins | novel | c.156_157insAGGAAACTTTTGGAAGACTACAAGGTGCC | p.Gln53ArgfsTer31 | p.Q53Rfs*31 | Q6NYC1 | protein_coding | TCGA-AN-A046-01 | Breast | breast invasive carcinoma | Female | >=65 | I/II | Unknown | Unknown | SD | ||
| JMJD6 | deletion | Frame_Shift_Del | novel | c.1127delA | p.Lys376ArgfsTer75 | p.K376Rfs*75 | Q6NYC1 | protein_coding | TCGA-EW-A2FV-01 | Breast | breast invasive carcinoma | Female | <65 | III/IV | Chemotherapy | docetaxel | SD | ||
| JMJD6 | SNV | Missense_Mutation | c.665N>A | p.Arg222Gln | p.R222Q | Q6NYC1 | protein_coding | tolerated(0.33) | benign(0.012) | TCGA-C5-A7UH-01 | Cervix | cervical & endocervical cancer | Female | <65 | III/IV | Chemotherapy | cisplatin | SD | |
| JMJD6 | SNV | Missense_Mutation | c.355N>A | p.Glu119Lys | p.E119K | Q6NYC1 | protein_coding | tolerated(0.12) | benign(0.027) | TCGA-IR-A3LA-01 | Cervix | cervical & endocervical cancer | Female | <65 | I/II | Chemotherapy | cisplatin | CR | |
| JMJD6 | SNV | Missense_Mutation | novel | c.354N>G | p.Ile118Met | p.I118M | Q6NYC1 | protein_coding | tolerated(0.33) | benign(0.071) | TCGA-Q1-A5R2-01 | Cervix | cervical & endocervical cancer | Female | <65 | I/II | Chemotherapy | cisplatin | PR |
| JMJD6 | SNV | Missense_Mutation | novel | c.23N>A | p.Arg8His | p.R8H | Q6NYC1 | protein_coding | deleterious(0.01) | probably_damaging(0.941) | TCGA-VS-A9UD-01 | Cervix | cervical & endocervical cancer | Female | >=65 | III/IV | Chemotherapy | cisplatin | CR |
| Page: 1 2 3 4 5 |
Top |
Related drugs of malignant transformation related genes |
| Identification of chemicals and drugs interact with genes involved in malignant transfromation |
| (DGIdb 4.0) |
| Entrez ID | Symbol | Category | Interaction Types | Drug Claim Name | Drug Name | PMIDs |
| Page: 1 |

Copyright 2023-Present -The University of Texas Health Science Center at Houston |