
|
|||||
|
 | |
| |
| |
| |
| |
| |
|
Gene: IMP3 |
Gene summary for IMP3 |
| Gene information | Species | Human | Gene symbol | IMP3 | Gene ID | 55272 |
| Gene name | IMP U3 small nucleolar ribonucleoprotein 3 | |
| Gene Alias | BRMS2 | |
| Cytomap | 15q24.2 | |
| Gene Type | protein-coding | GO ID | GO:0006139 | UniProtAcc | Q9NV31 |
Top |
Malignant transformation analysis |
| Identification of the aberrant gene expression in precancerous and cancerous lesions by comparing the gene expression of stem-like cells in diseased tissues with normal stem cells |
| Entrez ID | Symbol | Replicates | Species | Organ | Tissue | Adj P-value | Log2FC | Malignancy |
| 55272 | IMP3 | LZE4T | Human | Esophagus | ESCC | 3.54e-19 | 7.34e-01 | 0.0811 |
| 55272 | IMP3 | LZE7T | Human | Esophagus | ESCC | 3.48e-17 | 1.21e+00 | 0.0667 |
| 55272 | IMP3 | LZE8T | Human | Esophagus | ESCC | 1.72e-08 | 4.75e-01 | 0.067 |
| 55272 | IMP3 | LZE20T | Human | Esophagus | ESCC | 2.01e-08 | 3.28e-01 | 0.0662 |
| 55272 | IMP3 | LZE22T | Human | Esophagus | ESCC | 1.56e-04 | 6.43e-01 | 0.068 |
| 55272 | IMP3 | LZE24T | Human | Esophagus | ESCC | 5.53e-16 | 6.28e-01 | 0.0596 |
| 55272 | IMP3 | LZE21T | Human | Esophagus | ESCC | 6.14e-04 | 6.07e-01 | 0.0655 |
| 55272 | IMP3 | LZE6T | Human | Esophagus | ESCC | 1.56e-03 | 3.95e-01 | 0.0845 |
| 55272 | IMP3 | P1T-E | Human | Esophagus | ESCC | 5.65e-15 | 1.20e+00 | 0.0875 |
| 55272 | IMP3 | P2T-E | Human | Esophagus | ESCC | 8.77e-30 | 7.02e-01 | 0.1177 |
| 55272 | IMP3 | P4T-E | Human | Esophagus | ESCC | 2.02e-56 | 1.72e+00 | 0.1323 |
| 55272 | IMP3 | P5T-E | Human | Esophagus | ESCC | 1.93e-20 | 5.13e-01 | 0.1327 |
| 55272 | IMP3 | P8T-E | Human | Esophagus | ESCC | 7.40e-45 | 9.29e-01 | 0.0889 |
| 55272 | IMP3 | P9T-E | Human | Esophagus | ESCC | 7.23e-46 | 1.28e+00 | 0.1131 |
| 55272 | IMP3 | P10T-E | Human | Esophagus | ESCC | 1.28e-62 | 1.20e+00 | 0.116 |
| 55272 | IMP3 | P11T-E | Human | Esophagus | ESCC | 5.06e-19 | 1.12e+00 | 0.1426 |
| 55272 | IMP3 | P12T-E | Human | Esophagus | ESCC | 7.53e-45 | 1.06e+00 | 0.1122 |
| 55272 | IMP3 | P15T-E | Human | Esophagus | ESCC | 2.28e-53 | 1.19e+00 | 0.1149 |
| 55272 | IMP3 | P16T-E | Human | Esophagus | ESCC | 8.87e-54 | 1.31e+00 | 0.1153 |
| 55272 | IMP3 | P17T-E | Human | Esophagus | ESCC | 1.08e-11 | 5.27e-01 | 0.1278 |
| Page: 1 2 3 4 5 6 7 8 |
| Tissue | Expression Dynamics | Abbreviation |
| Esophagus | 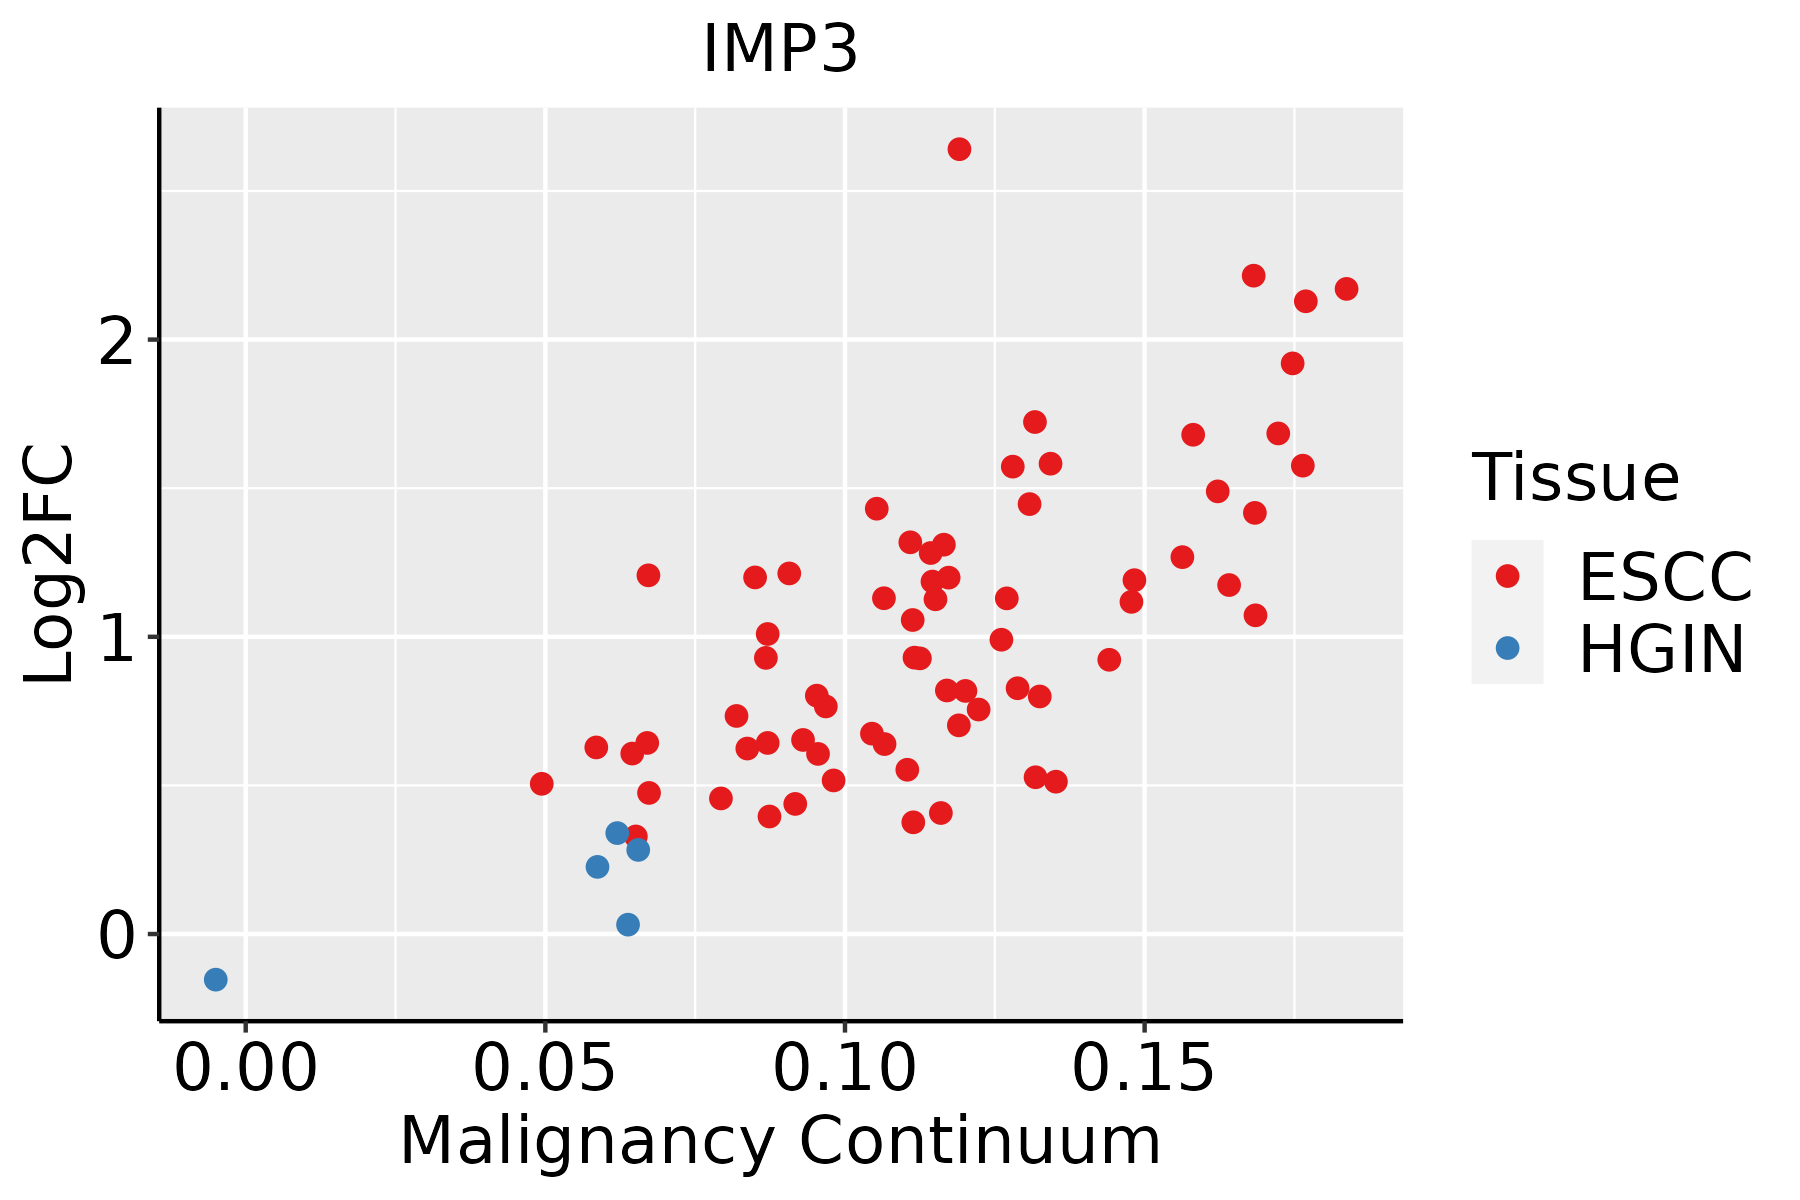 | ESCC: Esophageal squamous cell carcinoma |
| HGIN: High-grade intraepithelial neoplasias | ||
| LGIN: Low-grade intraepithelial neoplasias | ||
| Liver | 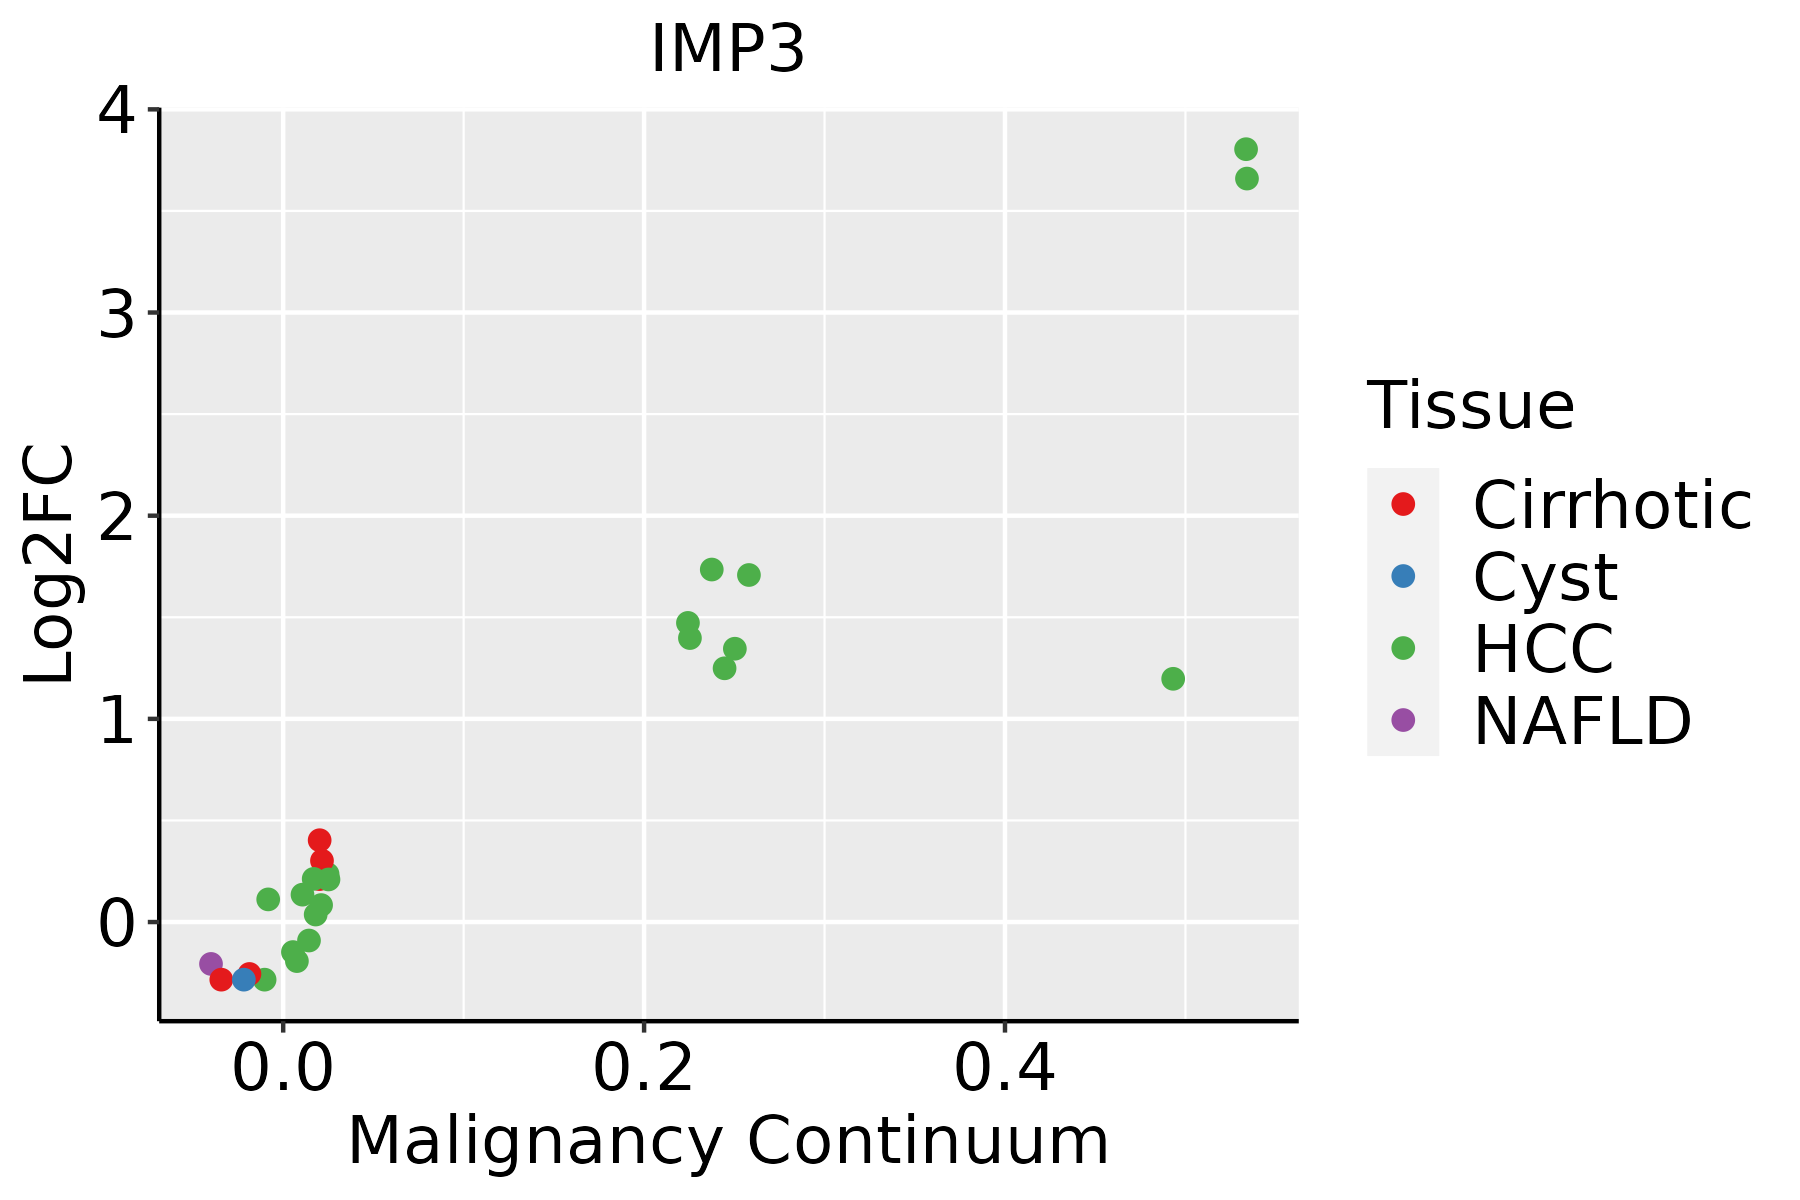 | HCC: Hepatocellular carcinoma |
| NAFLD: Non-alcoholic fatty liver disease | ||
| Oral Cavity | 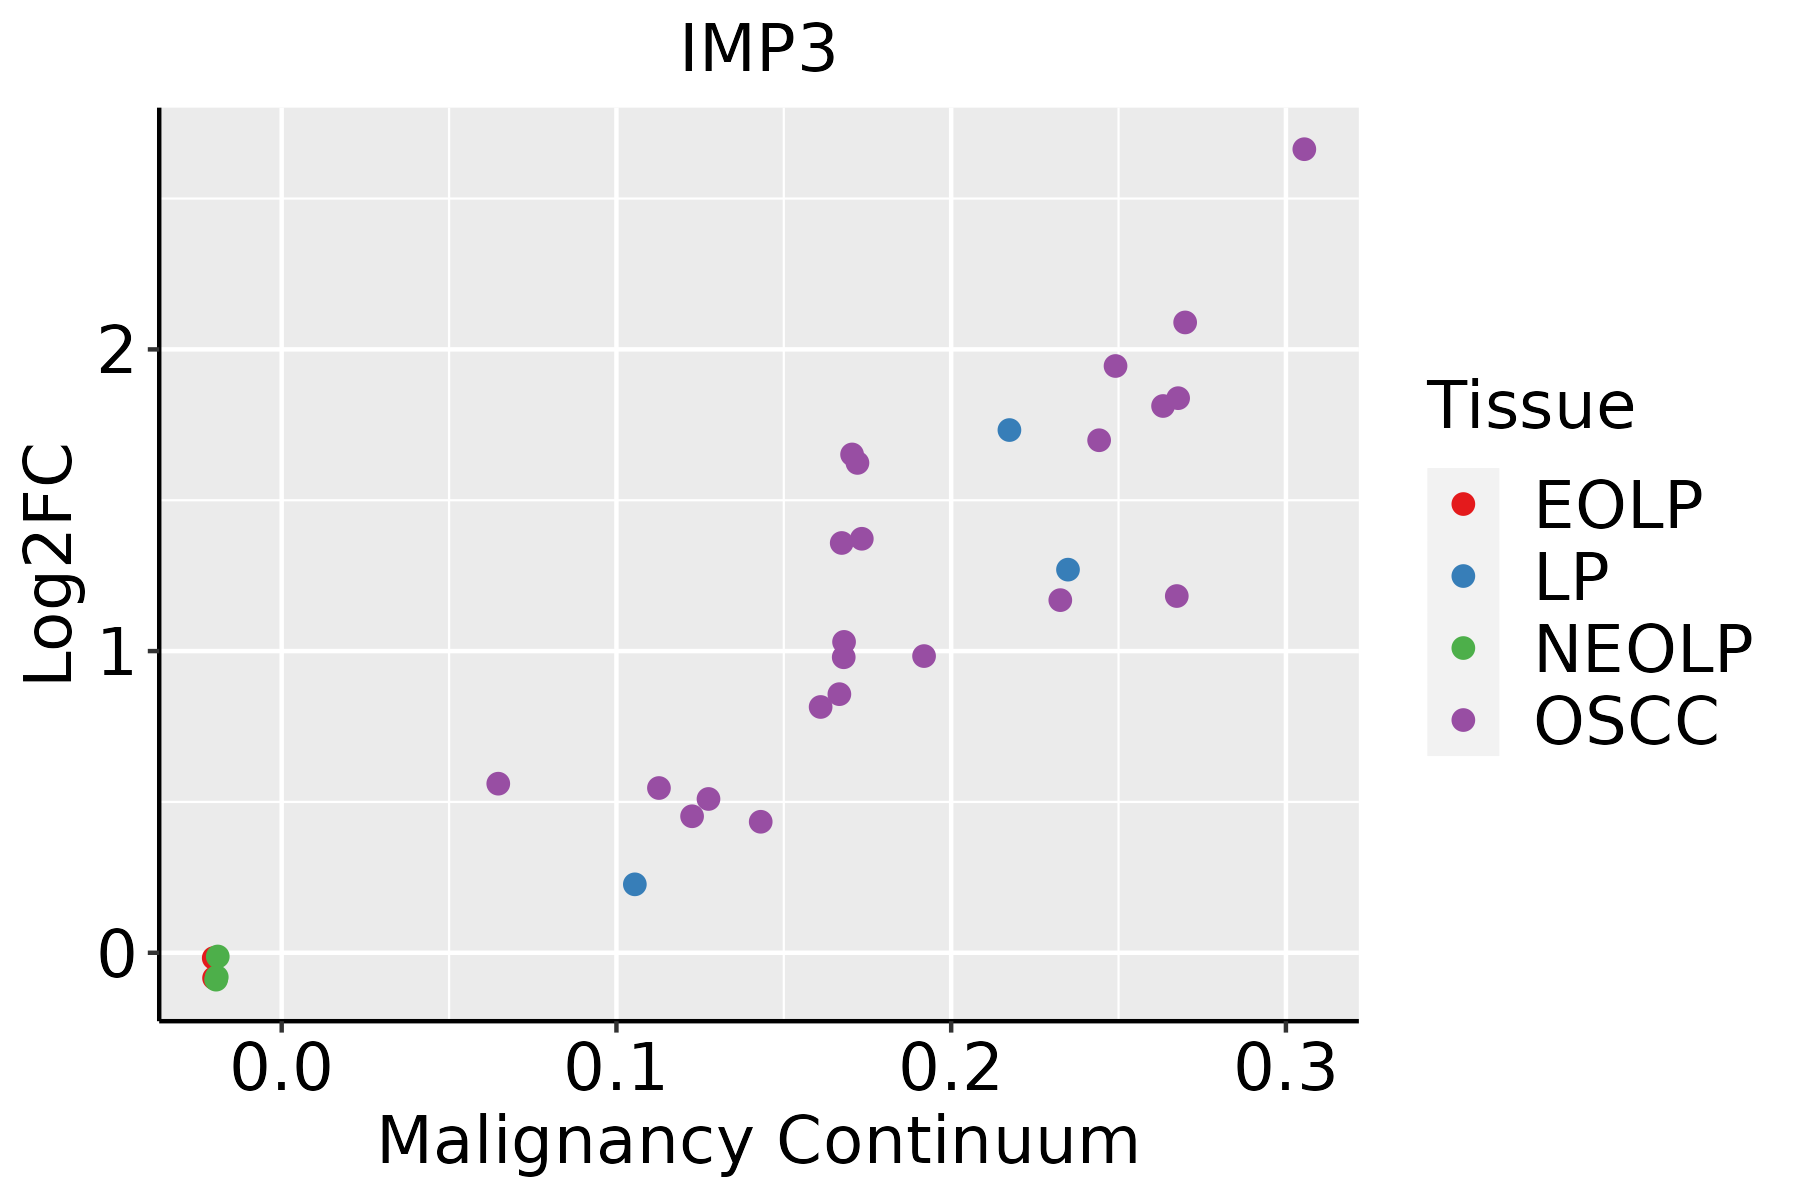 | EOLP: Erosive Oral lichen planus |
| LP: leukoplakia | ||
| NEOLP: Non-erosive oral lichen planus | ||
| OSCC: Oral squamous cell carcinoma | ||
| Prostate | 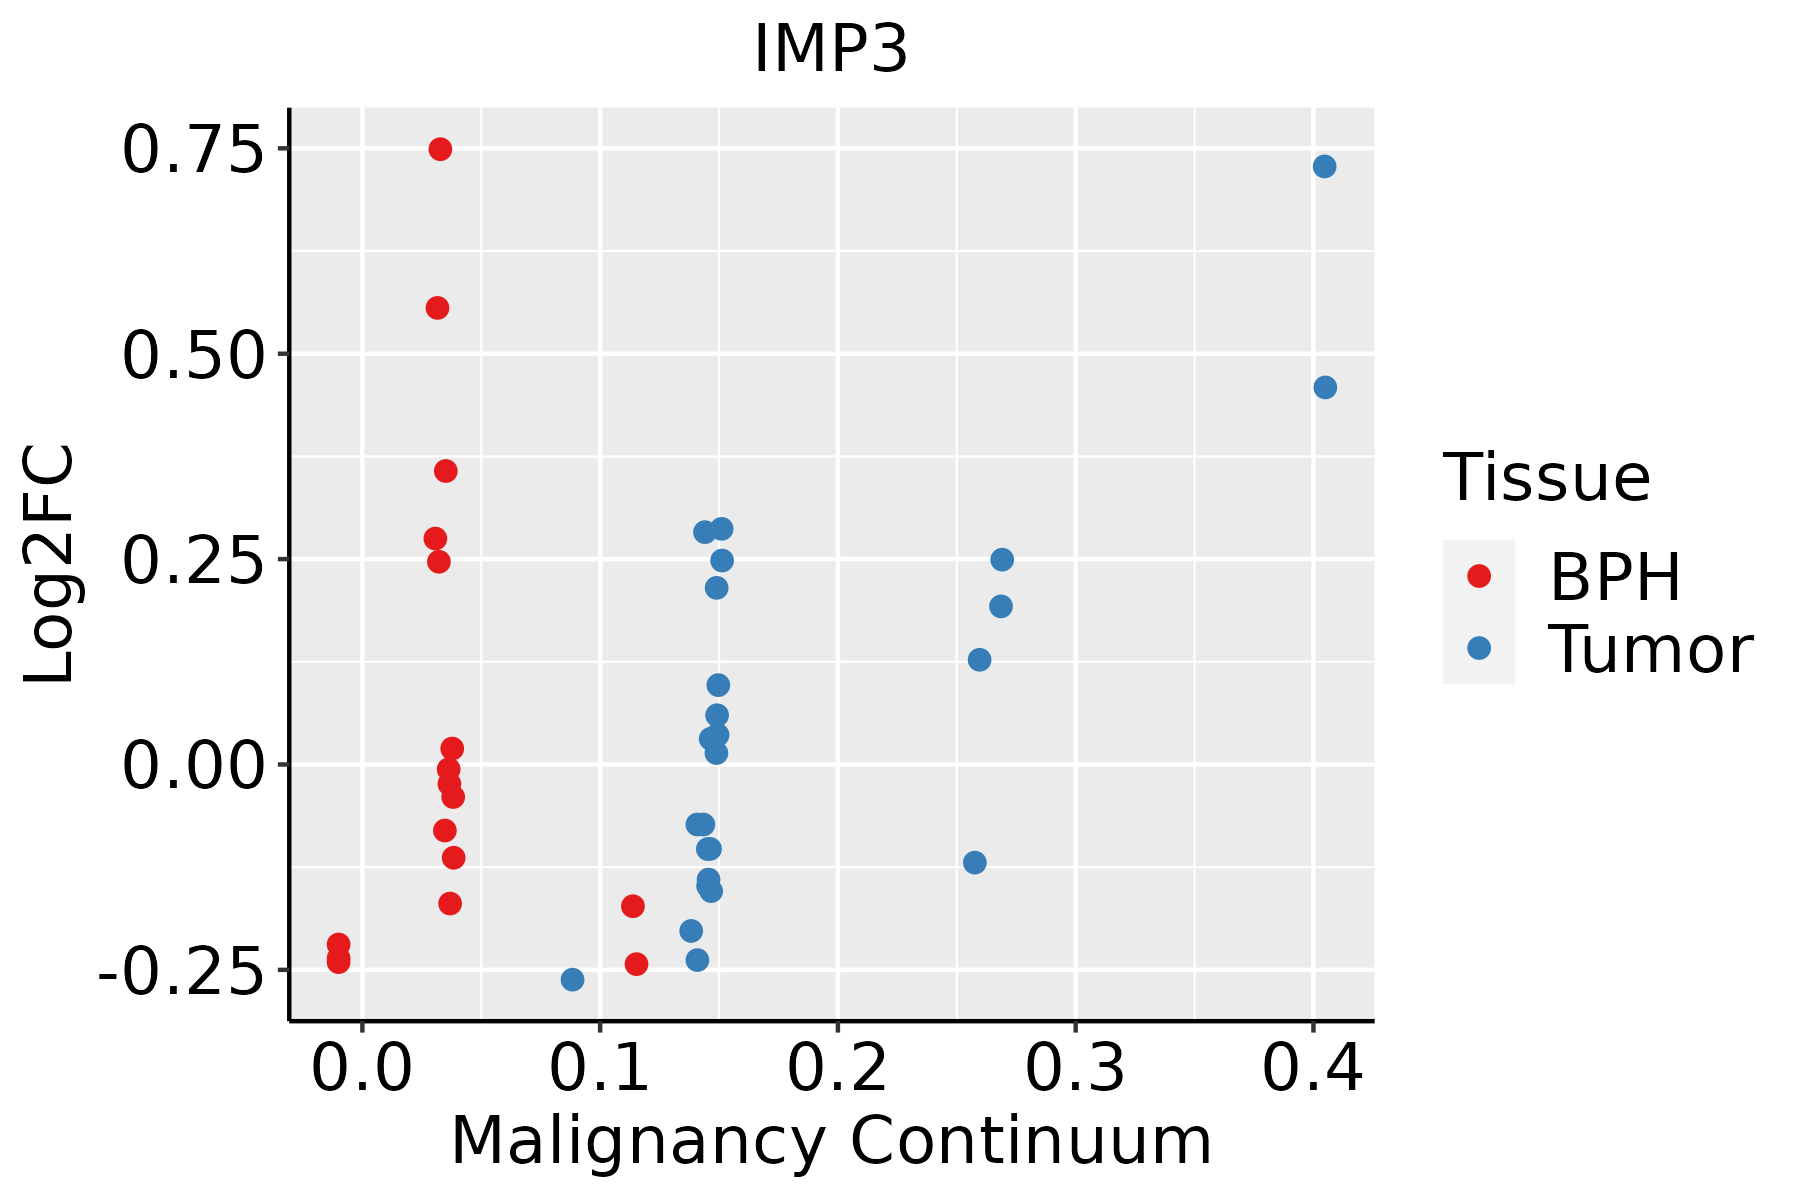 | BPH: Benign Prostatic Hyperplasia |
| Skin | 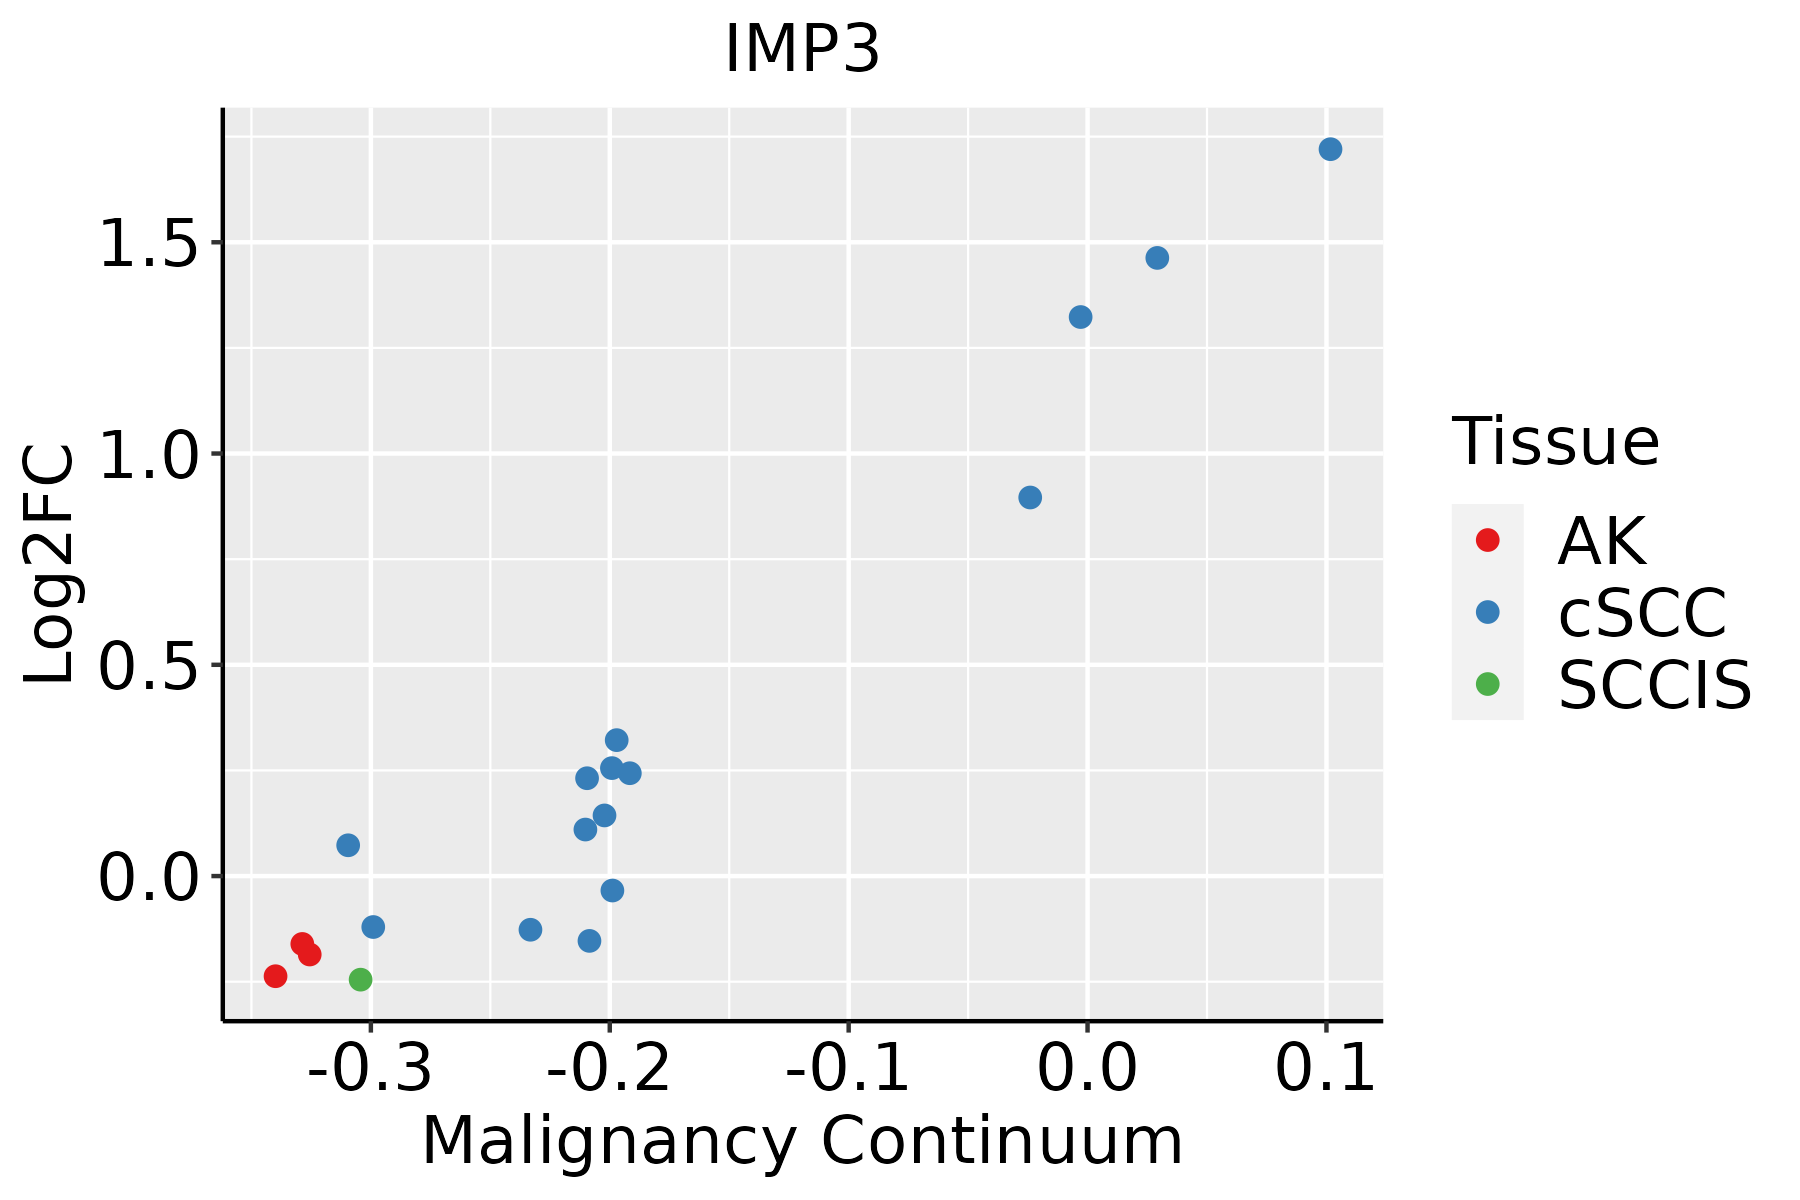 | AK: Actinic keratosis |
| cSCC: Cutaneous squamous cell carcinoma | ||
| SCCIS:squamous cell carcinoma in situ | ||
| Thyroid |  | ATC: Anaplastic thyroid cancer |
| HT: Hashimoto's thyroiditis | ||
| PTC: Papillary thyroid cancer |
| ∗log2FC in expression of this searched gene in stem-like cells from each diseased tissue sample relative to stem-like cells in normal samples in each tissue plotted against the malignancy continuum. Samples are colored based on if they are from different disease stage. |
Top |
Malignant transformation related pathway analysis |
| Find out the enriched GO biological processes and KEGG pathways involved in transition from healthy to precancer to cancer |
| Tissue | Disease Stage | Enriched GO biological Processes |
| Colorectum | AD |  |
| Colorectum | SER |  |
| Colorectum | MSS |  |
| Colorectum | MSI-H |  |
| Colorectum | FAP |  |
| ∗Top 15 enriched GO BP terms are showed in the bar plot of each disease state in each tissue. Each row represents a significant GO biological process which is colored according to the -log10(p.adjust). |
| Page: 1 2 3 4 5 6 7 8 9 |
| GO ID | Tissue | Disease Stage | Description | Gene Ratio | Bg Ratio | pvalue | p.adjust | Count |
| GO:004217613 | Lung | AIS | regulation of protein catabolic process | 92/1849 | 391/18723 | 1.34e-15 | 3.91e-12 | 92 |
| GO:200123313 | Lung | AIS | regulation of apoptotic signaling pathway | 71/1849 | 356/18723 | 6.10e-09 | 9.87e-07 | 71 |
| GO:004340912 | Lung | AIS | negative regulation of MAPK cascade | 39/1849 | 180/18723 | 1.92e-06 | 1.12e-04 | 39 |
| GO:003133013 | Lung | AIS | negative regulation of cellular catabolic process | 50/1849 | 262/18723 | 3.94e-06 | 2.05e-04 | 50 |
| GO:000989513 | Lung | AIS | negative regulation of catabolic process | 55/1849 | 320/18723 | 3.22e-05 | 1.01e-03 | 55 |
| GO:009719113 | Lung | AIS | extrinsic apoptotic signaling pathway | 41/1849 | 219/18723 | 4.46e-05 | 1.33e-03 | 41 |
| GO:200123613 | Lung | AIS | regulation of extrinsic apoptotic signaling pathway | 31/1849 | 151/18723 | 6.27e-05 | 1.70e-03 | 31 |
| GO:004217713 | Lung | AIS | negative regulation of protein catabolic process | 26/1849 | 121/18723 | 1.09e-04 | 2.57e-03 | 26 |
| GO:004586113 | Lung | AIS | negative regulation of proteolysis | 55/1849 | 351/18723 | 3.87e-04 | 6.72e-03 | 55 |
| GO:0070371 | Lung | AIS | ERK1 and ERK2 cascade | 52/1849 | 330/18723 | 4.80e-04 | 7.95e-03 | 52 |
| GO:00703731 | Lung | AIS | negative regulation of ERK1 and ERK2 cascade | 18/1849 | 78/18723 | 4.83e-04 | 7.98e-03 | 18 |
| GO:005254713 | Lung | AIS | regulation of peptidase activity | 68/1849 | 461/18723 | 5.01e-04 | 8.23e-03 | 68 |
| GO:005254813 | Lung | AIS | regulation of endopeptidase activity | 63/1849 | 432/18723 | 1.06e-03 | 1.38e-02 | 63 |
| GO:0070372 | Lung | AIS | regulation of ERK1 and ERK2 cascade | 48/1849 | 309/18723 | 1.06e-03 | 1.38e-02 | 48 |
| GO:200123513 | Lung | AIS | positive regulation of apoptotic signaling pathway | 22/1849 | 126/18723 | 5.81e-03 | 4.83e-02 | 22 |
| GO:0036462 | Lung | AIS | TRAIL-activated apoptotic signaling pathway | 5/1849 | 13/18723 | 6.10e-03 | 4.98e-02 | 5 |
| GO:19020431 | Lung | AIS | positive regulation of extrinsic apoptotic signaling pathway via death domain receptors | 5/1849 | 13/18723 | 6.10e-03 | 4.98e-02 | 5 |
| GO:002261320 | Oral cavity | OSCC | ribonucleoprotein complex biogenesis | 333/7305 | 463/18723 | 8.28e-48 | 5.24e-44 | 333 |
| GO:004225420 | Oral cavity | OSCC | ribosome biogenesis | 230/7305 | 299/18723 | 3.22e-41 | 6.80e-38 | 230 |
| GO:000636410 | Oral cavity | OSCC | rRNA processing | 172/7305 | 225/18723 | 1.57e-30 | 1.24e-27 | 172 |
| Page: 1 2 3 4 5 6 7 8 9 10 11 12 13 14 15 16 17 18 19 20 21 |
| Pathway ID | Tissue | Disease Stage | Description | Gene Ratio | Bg Ratio | pvalue | p.adjust | qvalue | Count |
| Page: 1 |
Top |
Cell-cell communication analysis |
| Identification of potential cell-cell interactions between two cell types and their ligand-receptor pairs for different disease states |
| Ligand | Receptor | LRpair | Pathway | Tissue | Disease Stage |
| Page: 1 |
Top |
Single-cell gene regulatory network inference analysis |
| Find out the significant the regulons (TFs) and the target genes of each regulon across cell types for different disease states |
| TF | Cell Type | Tissue | Disease Stage | Target Gene | RSS | Regulon Activity |
| ∗The dot plots of a searched regulon are shown for all cell subpopulations in each disease state of each tissue based on the regulon specific score inferred using pySCENIC and by calculating the average expression. |
| Page: 1 |
Top |
Somatic mutation of malignant transformation related genes |
| Annotation of somatic variants for genes involved in malignant transformation |
| Hugo Symbol | Variant Class | Variant Classification | dbSNP RS | HGVSc | HGVSp | HGVSp Short | SWISSPROT | BIOTYPE | SIFT | PolyPhen | Tumor Sample Barcode | Tissue | Histology | Sex | Age | Stage | Therapy Types | Drugs | Outcome |
| IMP3 | SNV | Missense_Mutation | rs746193463 | c.227C>T | p.Ser76Leu | p.S76L | Q9NV31 | protein_coding | deleterious(0.02) | benign(0.242) | TCGA-C8-A274-01 | Breast | breast invasive carcinoma | Female | <65 | I/II | Hormone Therapy | tamoxiphen | SD |
| IMP3 | SNV | Missense_Mutation | c.538N>G | p.Phe180Val | p.F180V | Q9NV31 | protein_coding | deleterious(0) | probably_damaging(0.972) | TCGA-AA-A02E-01 | Colorectum | colon adenocarcinoma | Female | >=65 | III/IV | Unknown | Unknown | PD | |
| IMP3 | SNV | Missense_Mutation | rs200453864 | c.521N>G | p.Asn174Ser | p.N174S | Q9NV31 | protein_coding | deleterious(0.04) | benign(0.063) | TCGA-AG-3594-01 | Colorectum | rectum adenocarcinoma | Male | >=65 | I/II | Unknown | Unknown | PD |
| IMP3 | SNV | Missense_Mutation | novel | c.268N>T | p.Pro90Ser | p.P90S | Q9NV31 | protein_coding | tolerated(0.53) | benign(0.015) | TCGA-DI-A1BU-01 | Endometrium | uterine corpus endometrioid carcinoma | Female | <65 | I/II | Chemotherapy | paclitaxel | SD |
| IMP3 | SNV | Missense_Mutation | novel | c.541N>C | p.Asp181His | p.D181H | Q9NV31 | protein_coding | deleterious(0) | probably_damaging(0.969) | TCGA-HD-A4C1-01 | Oral cavity | head & neck squamous cell carcinoma | Female | <65 | I/II | Unknown | Unknown | SD |
| IMP3 | insertion | Frame_Shift_Ins | novel | c.456_457insGC | p.Ser153AlafsTer20 | p.S153Afs*20 | Q9NV31 | protein_coding | TCGA-CV-6003-01 | Oral cavity | head & neck squamous cell carcinoma | Female | <65 | III/IV | Unknown | Unknown | SD | ||
| IMP3 | SNV | Missense_Mutation | c.540N>A | p.Phe180Leu | p.F180L | Q9NV31 | protein_coding | deleterious(0) | possibly_damaging(0.878) | TCGA-G9-7510-01 | Prostate | prostate adenocarcinoma | Male | >=65 | 8 | Unknown | Unknown | SD |
| Page: 1 |
Top |
Related drugs of malignant transformation related genes |
| Identification of chemicals and drugs interact with genes involved in malignant transfromation |
| (DGIdb 4.0) |
| Entrez ID | Symbol | Category | Interaction Types | Drug Claim Name | Drug Name | PMIDs |
| Page: 1 |

Copyright 2023-Present -The University of Texas Health Science Center at Houston |