| Tissue | Expression Dynamics | Abbreviation |
| Colorectum (GSE201348) |  | FAP: Familial adenomatous polyposis |
| CRC: Colorectal cancer |
| Colorectum (HTA11) |  | AD: Adenomas |
| SER: Sessile serrated lesions |
| MSI-H: Microsatellite-high colorectal cancer |
| MSS: Microsatellite stable colorectal cancer |
| Esophagus | 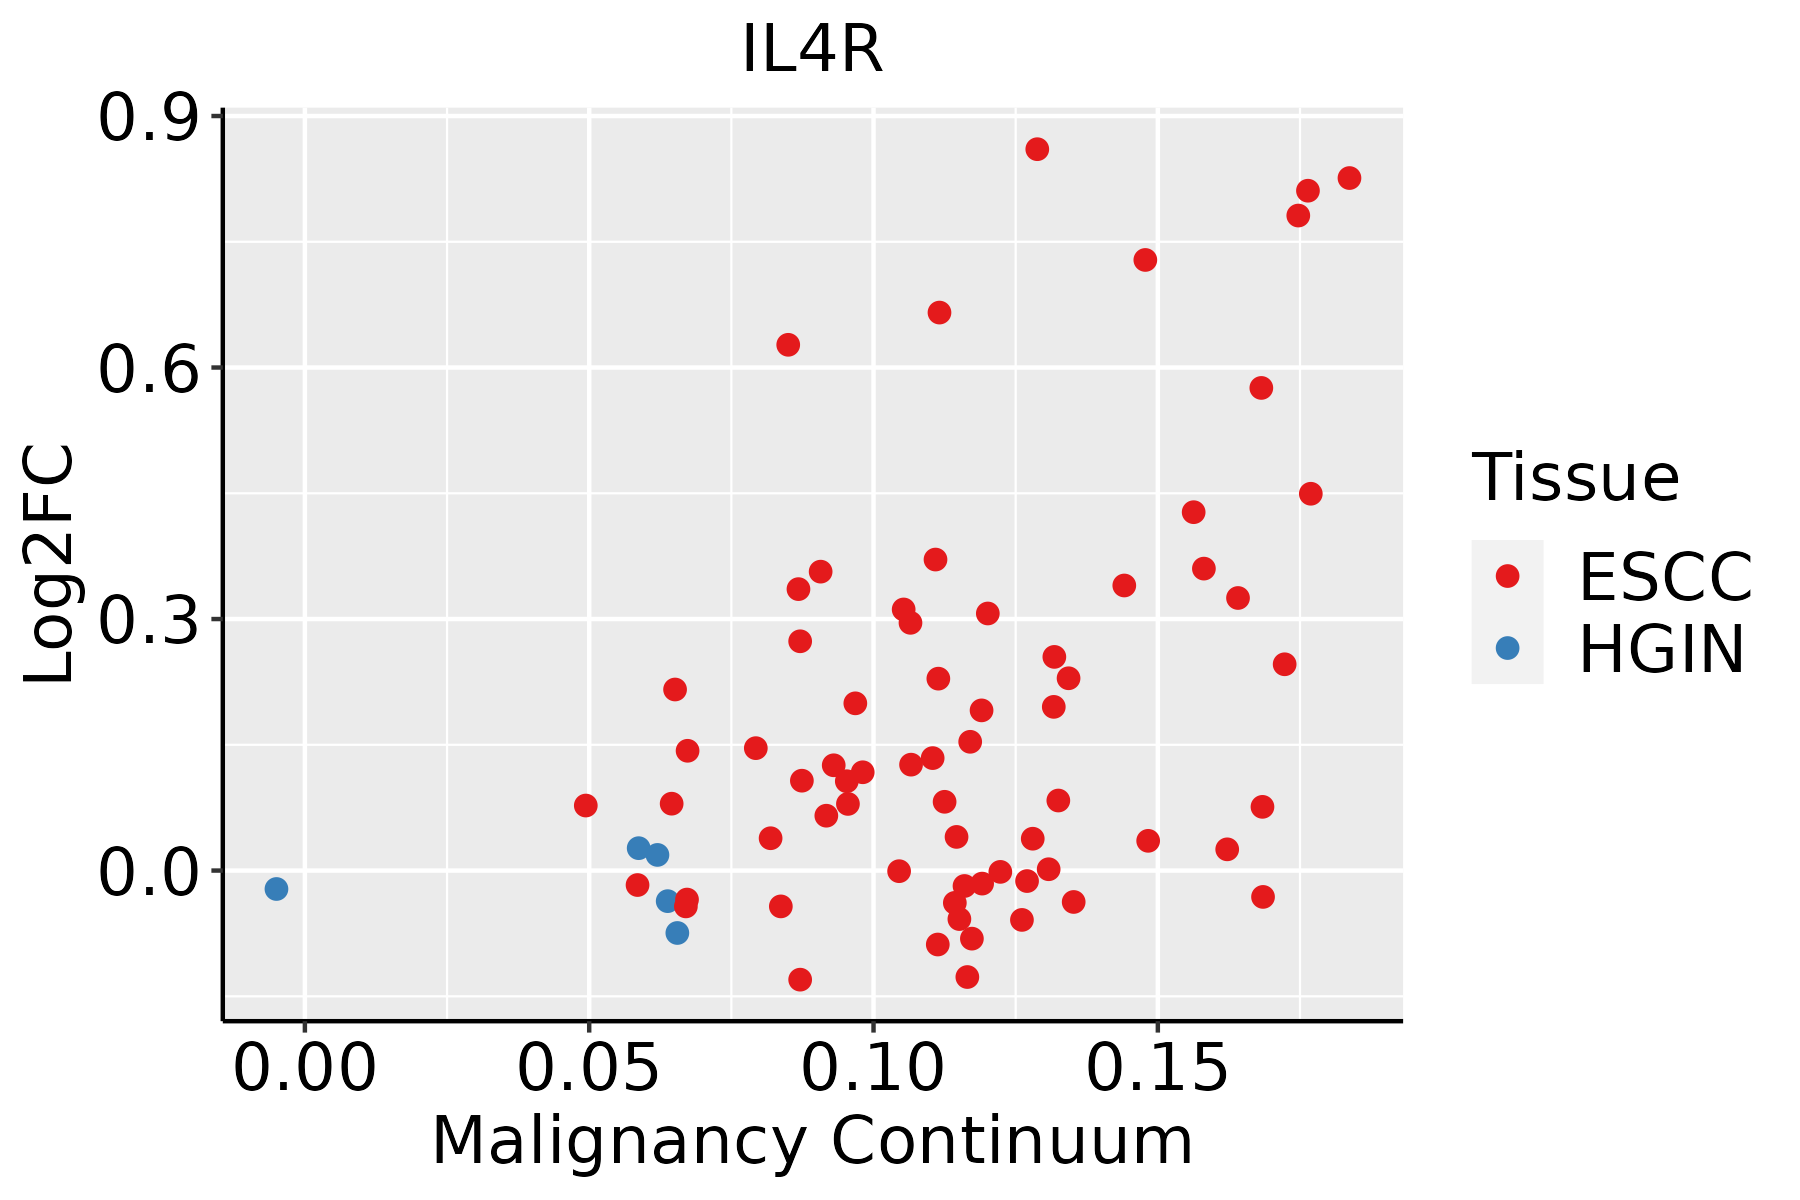 | ESCC: Esophageal squamous cell carcinoma |
| HGIN: High-grade intraepithelial neoplasias |
| LGIN: Low-grade intraepithelial neoplasias |
| Oral Cavity | 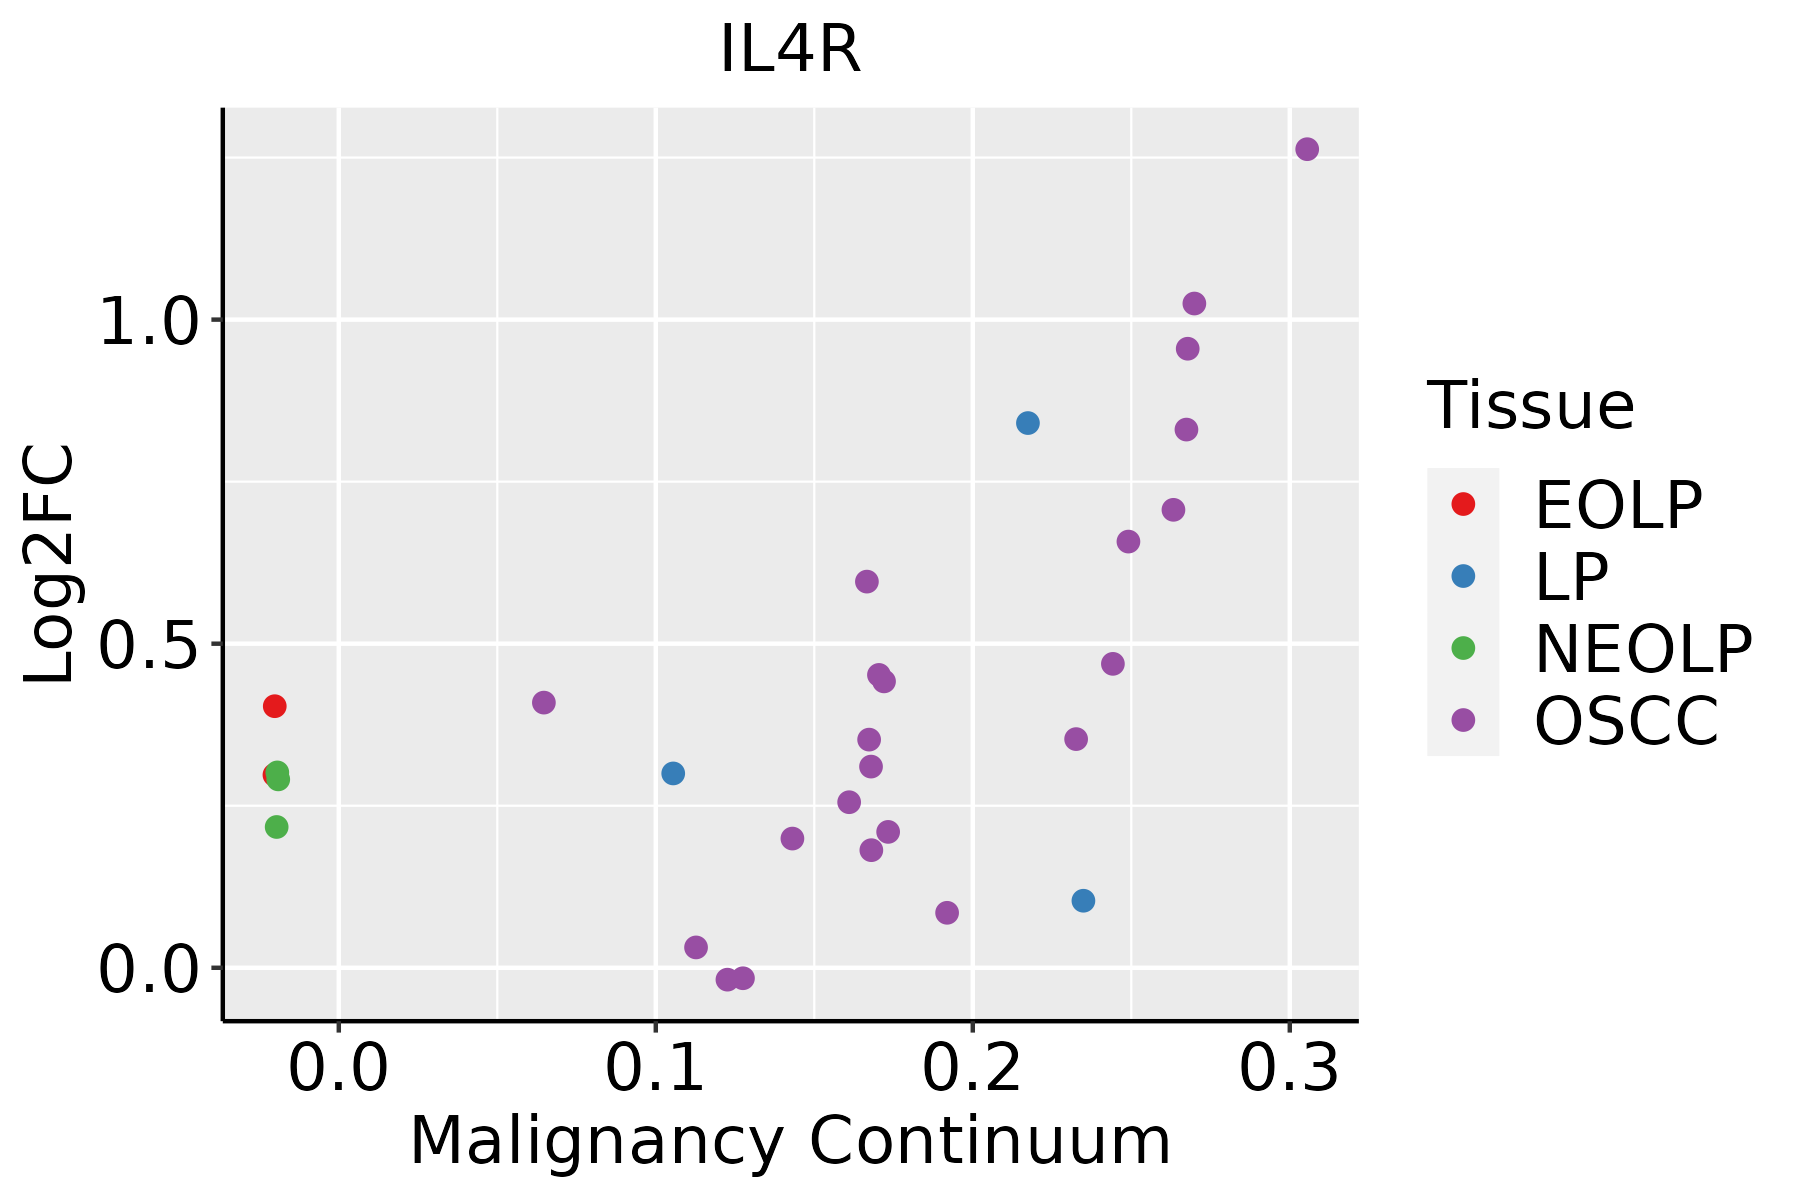 | EOLP: Erosive Oral lichen planus |
| LP: leukoplakia |
| NEOLP: Non-erosive oral lichen planus |
| OSCC: Oral squamous cell carcinoma |
| Skin | 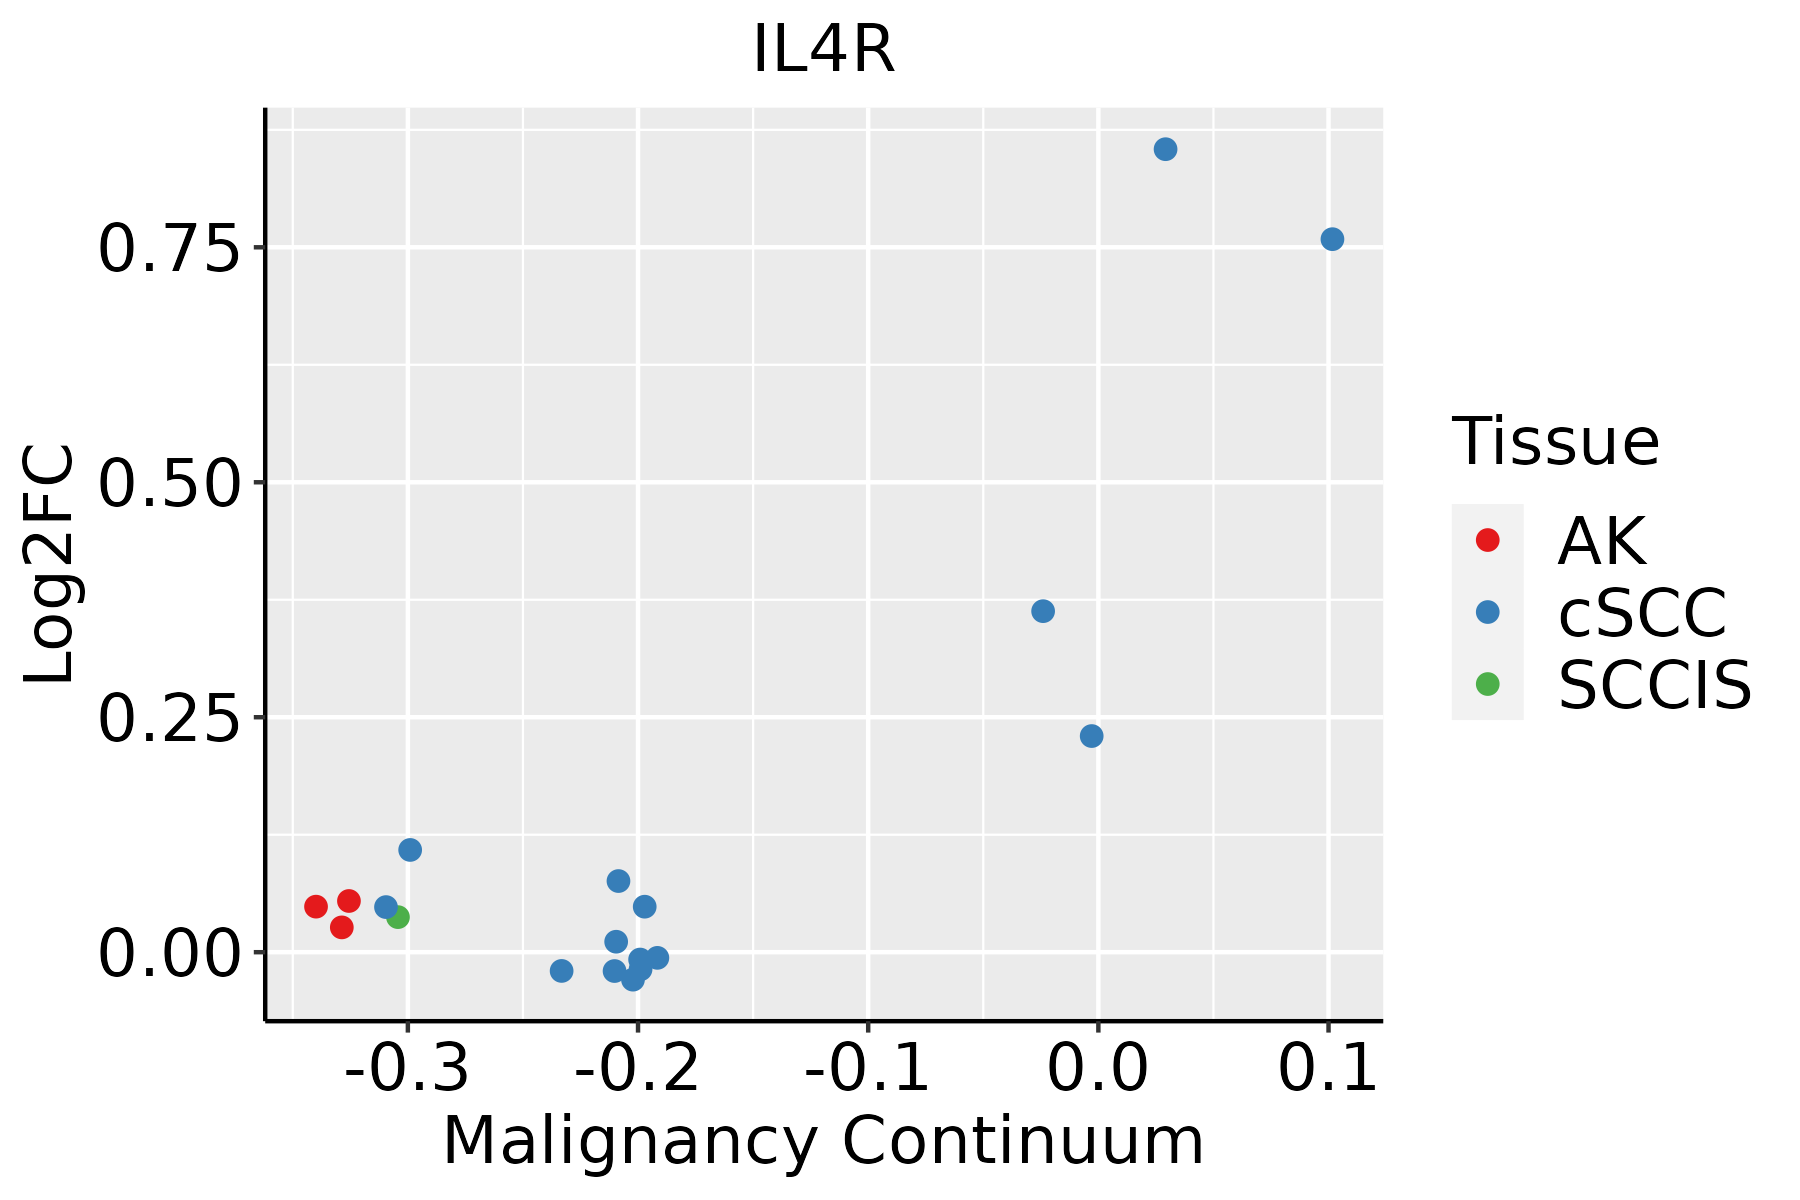 | AK: Actinic keratosis |
| cSCC: Cutaneous squamous cell carcinoma |
| SCCIS:squamous cell carcinoma in situ |
| GO ID | Tissue | Disease Stage | Description | Gene Ratio | Bg Ratio | pvalue | p.adjust | Count |
| GO:00026984 | Oral cavity | EOLP | negative regulation of immune effector process | 26/2218 | 110/18723 | 3.94e-04 | 3.53e-03 | 26 |
| GO:00508681 | Oral cavity | EOLP | negative regulation of T cell activation | 28/2218 | 122/18723 | 4.03e-04 | 3.58e-03 | 28 |
| GO:0046638 | Oral cavity | EOLP | positive regulation of alpha-beta T cell differentiation | 15/2218 | 50/18723 | 4.75e-04 | 4.16e-03 | 15 |
| GO:0042093 | Oral cavity | EOLP | T-helper cell differentiation | 18/2218 | 66/18723 | 4.94e-04 | 4.31e-03 | 18 |
| GO:00026974 | Oral cavity | EOLP | regulation of immune effector process | 61/2218 | 339/18723 | 5.48e-04 | 4.68e-03 | 61 |
| GO:00022864 | Oral cavity | EOLP | T cell activation involved in immune response | 26/2218 | 114/18723 | 7.06e-04 | 5.78e-03 | 26 |
| GO:0002294 | Oral cavity | EOLP | CD4-positive, alpha-beta T cell differentiation involved in immune response | 18/2218 | 68/18723 | 7.29e-04 | 5.94e-03 | 18 |
| GO:0002287 | Oral cavity | EOLP | alpha-beta T cell activation involved in immune response | 18/2218 | 69/18723 | 8.79e-04 | 6.75e-03 | 18 |
| GO:0002293 | Oral cavity | EOLP | alpha-beta T cell differentiation involved in immune response | 18/2218 | 69/18723 | 8.79e-04 | 6.75e-03 | 18 |
| GO:0002292 | Oral cavity | EOLP | T cell differentiation involved in immune response | 19/2218 | 75/18723 | 9.43e-04 | 7.15e-03 | 19 |
| GO:007135321 | Oral cavity | EOLP | cellular response to interleukin-4 | 11/2218 | 33/18723 | 1.01e-03 | 7.54e-03 | 11 |
| GO:0046636 | Oral cavity | EOLP | negative regulation of alpha-beta T cell activation | 13/2218 | 43/18723 | 1.03e-03 | 7.63e-03 | 13 |
| GO:20005161 | Oral cavity | EOLP | positive regulation of CD4-positive, alpha-beta T cell activation | 12/2218 | 39/18723 | 1.34e-03 | 9.33e-03 | 12 |
| GO:00456203 | Oral cavity | EOLP | negative regulation of lymphocyte differentiation | 15/2218 | 55/18723 | 1.42e-03 | 9.62e-03 | 15 |
| GO:00024433 | Oral cavity | EOLP | leukocyte mediated immunity | 73/2218 | 440/18723 | 1.78e-03 | 1.16e-02 | 73 |
| GO:0046639 | Oral cavity | EOLP | negative regulation of alpha-beta T cell differentiation | 9/2218 | 26/18723 | 2.14e-03 | 1.34e-02 | 9 |
| GO:00456212 | Oral cavity | EOLP | positive regulation of lymphocyte differentiation | 23/2218 | 104/18723 | 2.14e-03 | 1.34e-02 | 23 |
| GO:007067021 | Oral cavity | EOLP | response to interleukin-4 | 11/2218 | 36/18723 | 2.24e-03 | 1.39e-02 | 11 |
| GO:00068874 | Oral cavity | EOLP | exocytosis | 60/2218 | 352/18723 | 2.32e-03 | 1.43e-02 | 60 |
| GO:00455811 | Oral cavity | EOLP | negative regulation of T cell differentiation | 13/2218 | 47/18723 | 2.52e-03 | 1.53e-02 | 13 |
| Pathway ID | Tissue | Disease Stage | Description | Gene Ratio | Bg Ratio | pvalue | p.adjust | qvalue | Count |
| hsa04151 | Colorectum | FAP | PI3K-Akt signaling pathway | 75/1404 | 354/8465 | 1.23e-02 | 4.19e-02 | 2.55e-02 | 75 |
| hsa041511 | Colorectum | FAP | PI3K-Akt signaling pathway | 75/1404 | 354/8465 | 1.23e-02 | 4.19e-02 | 2.55e-02 | 75 |
| hsa046599 | Esophagus | ESCC | Th17 cell differentiation | 68/4205 | 108/8465 | 3.53e-03 | 9.30e-03 | 4.76e-03 | 68 |
| hsa046585 | Esophagus | ESCC | Th1 and Th2 cell differentiation | 58/4205 | 92/8465 | 6.49e-03 | 1.60e-02 | 8.19e-03 | 58 |
| hsa041517 | Esophagus | ESCC | PI3K-Akt signaling pathway | 197/4205 | 354/8465 | 1.24e-02 | 2.83e-02 | 1.45e-02 | 197 |
| hsa0465914 | Esophagus | ESCC | Th17 cell differentiation | 68/4205 | 108/8465 | 3.53e-03 | 9.30e-03 | 4.76e-03 | 68 |
| hsa0465812 | Esophagus | ESCC | Th1 and Th2 cell differentiation | 58/4205 | 92/8465 | 6.49e-03 | 1.60e-02 | 8.19e-03 | 58 |
| hsa0415114 | Esophagus | ESCC | PI3K-Akt signaling pathway | 197/4205 | 354/8465 | 1.24e-02 | 2.83e-02 | 1.45e-02 | 197 |
| hsa046598 | Oral cavity | OSCC | Th17 cell differentiation | 65/3704 | 108/8465 | 4.02e-04 | 1.25e-03 | 6.35e-04 | 65 |
| hsa041516 | Oral cavity | OSCC | PI3K-Akt signaling pathway | 185/3704 | 354/8465 | 6.26e-04 | 1.86e-03 | 9.49e-04 | 185 |
| hsa046584 | Oral cavity | OSCC | Th1 and Th2 cell differentiation | 53/3704 | 92/8465 | 5.00e-03 | 1.20e-02 | 6.13e-03 | 53 |
| hsa0465913 | Oral cavity | OSCC | Th17 cell differentiation | 65/3704 | 108/8465 | 4.02e-04 | 1.25e-03 | 6.35e-04 | 65 |
| hsa0415113 | Oral cavity | OSCC | PI3K-Akt signaling pathway | 185/3704 | 354/8465 | 6.26e-04 | 1.86e-03 | 9.49e-04 | 185 |
| hsa0465811 | Oral cavity | OSCC | Th1 and Th2 cell differentiation | 53/3704 | 92/8465 | 5.00e-03 | 1.20e-02 | 6.13e-03 | 53 |
| hsa0465923 | Oral cavity | EOLP | Th17 cell differentiation | 41/1218 | 108/8465 | 9.84e-10 | 3.18e-08 | 1.87e-08 | 41 |
| hsa0465821 | Oral cavity | EOLP | Th1 and Th2 cell differentiation | 31/1218 | 92/8465 | 2.27e-06 | 1.79e-05 | 1.05e-05 | 31 |
| hsa053214 | Oral cavity | EOLP | Inflammatory bowel disease | 20/1218 | 65/8465 | 5.49e-04 | 2.16e-03 | 1.28e-03 | 20 |
| hsa0415123 | Oral cavity | EOLP | PI3K-Akt signaling pathway | 73/1218 | 354/8465 | 7.03e-04 | 2.69e-03 | 1.59e-03 | 73 |
| hsa04630 | Oral cavity | EOLP | JAK-STAT signaling pathway | 35/1218 | 166/8465 | 1.15e-02 | 3.07e-02 | 1.81e-02 | 35 |
| hsa0465933 | Oral cavity | EOLP | Th17 cell differentiation | 41/1218 | 108/8465 | 9.84e-10 | 3.18e-08 | 1.87e-08 | 41 |
| Hugo Symbol | Variant Class | Variant Classification | dbSNP RS | HGVSc | HGVSp | HGVSp Short | SWISSPROT | BIOTYPE | SIFT | PolyPhen | Tumor Sample Barcode | Tissue | Histology | Sex | Age | Stage | Therapy Types | Drugs | Outcome |
| IL4R | SNV | Missense_Mutation | | c.971C>A | p.Pro324His | p.P324H | P24394 | protein_coding | tolerated(0.21) | benign(0.187) | TCGA-A8-A07R-01 | Breast | breast invasive carcinoma | Female | >=65 | III/IV | Ancillary | zoledronic | SD |
| IL4R | SNV | Missense_Mutation | novel | c.352A>C | p.Ser118Arg | p.S118R | P24394 | protein_coding | deleterious(0.04) | probably_damaging(0.993) | TCGA-A8-A08H-01 | Breast | breast invasive carcinoma | Female | >=65 | I/II | Unknown | Unknown | SD |
| IL4R | SNV | Missense_Mutation | novel | c.353G>C | p.Ser118Thr | p.S118T | P24394 | protein_coding | deleterious(0.04) | possibly_damaging(0.578) | TCGA-A8-A08H-01 | Breast | breast invasive carcinoma | Female | >=65 | I/II | Unknown | Unknown | SD |
| IL4R | SNV | Missense_Mutation | | c.293N>T | p.Asn98Ile | p.N98I | P24394 | protein_coding | tolerated(0.29) | benign(0.003) | TCGA-A8-A091-01 | Breast | breast invasive carcinoma | Female | <65 | I/II | Chemotherapy | 5-fluorouracil | PD |
| IL4R | SNV | Missense_Mutation | | c.761N>A | p.Ser254Asn | p.S254N | P24394 | protein_coding | deleterious(0.02) | possibly_damaging(0.462) | TCGA-A8-A09Z-01 | Breast | breast invasive carcinoma | Female | >=65 | I/II | Unknown | Unknown | SD |
| IL4R | SNV | Missense_Mutation | novel | c.2143N>C | p.Ala715Pro | p.A715P | P24394 | protein_coding | deleterious(0.01) | probably_damaging(0.946) | TCGA-AO-A1KT-01 | Breast | breast invasive carcinoma | Female | >=65 | I/II | Chemotherapy | fluorouracil | SD |
| IL4R | SNV | Missense_Mutation | | c.2462A>G | p.Tyr821Cys | p.Y821C | P24394 | protein_coding | tolerated(0.37) | benign(0) | TCGA-AR-A24S-01 | Breast | breast invasive carcinoma | Female | <65 | I/II | Hormone Therapy | anastrozole | SD |
| IL4R | SNV | Missense_Mutation | novel | c.1805N>C | p.Gly602Ala | p.G602A | P24394 | protein_coding | tolerated(0.05) | benign(0.07) | TCGA-B6-A0I8-01 | Breast | breast invasive carcinoma | Female | <65 | I/II | Unknown | Unknown | PD |
| IL4R | SNV | Missense_Mutation | | c.731T>A | p.Ile244Asn | p.I244N | P24394 | protein_coding | deleterious(0) | probably_damaging(0.95) | TCGA-B6-A0IJ-01 | Breast | breast invasive carcinoma | Female | <65 | I/II | Unknown | Unknown | SD |
| IL4R | SNV | Missense_Mutation | | c.2260N>T | p.Pro754Ser | p.P754S | P24394 | protein_coding | tolerated(0.32) | benign(0.211) | TCGA-BH-A0HF-01 | Breast | breast invasive carcinoma | Female | >=65 | I/II | Hormone Therapy | arimidex | SD |
| Entrez ID | Symbol | Category | Interaction Types | Drug Claim Name | Drug Name | PMIDs |
| 3566 | IL4R | DRUGGABLE GENOME, EXTERNAL SIDE OF PLASMA MEMBRANE | | Hepatitis vaccines | | 21111021 |
| 3566 | IL4R | DRUGGABLE GENOME, EXTERNAL SIDE OF PLASMA MEMBRANE | | PRX-321 | PRX-321 | |
| 3566 | IL4R | DRUGGABLE GENOME, EXTERNAL SIDE OF PLASMA MEMBRANE | | CHEMBL2108583 | CINTREDEKIN BESUDOTOX | |
| 3566 | IL4R | DRUGGABLE GENOME, EXTERNAL SIDE OF PLASMA MEMBRANE | | AIR645 | | |
| 3566 | IL4R | DRUGGABLE GENOME, EXTERNAL SIDE OF PLASMA MEMBRANE | | SAR-156597 | ROMILKIMAB | |
| 3566 | IL4R | DRUGGABLE GENOME, EXTERNAL SIDE OF PLASMA MEMBRANE | | Aerovant | | |
| 3566 | IL4R | DRUGGABLE GENOME, EXTERNAL SIDE OF PLASMA MEMBRANE | | CINTREDEKIN BESUDOTOX | | |
| 3566 | IL4R | DRUGGABLE GENOME, EXTERNAL SIDE OF PLASMA MEMBRANE | | AER001,AEROVANT | | |
| 3566 | IL4R | DRUGGABLE GENOME, EXTERNAL SIDE OF PLASMA MEMBRANE | antibody | 223365910 | DUPILUMAB | |
| 3566 | IL4R | DRUGGABLE GENOME, EXTERNAL SIDE OF PLASMA MEMBRANE | | pitrakinra | PITRAKINRA | |


