
|
|||||
|
 | |
| |
| |
| |
| |
| |
|
Gene: IGFBP3 |
Gene summary for IGFBP3 |
| Gene information | Species | Human | Gene symbol | IGFBP3 | Gene ID | 3486 |
| Gene name | insulin like growth factor binding protein 3 | |
| Gene Alias | BP-53 | |
| Cytomap | 7p12.3 | |
| Gene Type | protein-coding | GO ID | GO:0001932 | UniProtAcc | B3KPF0 |
Top |
Malignant transformation analysis |
| Identification of the aberrant gene expression in precancerous and cancerous lesions by comparing the gene expression of stem-like cells in diseased tissues with normal stem cells |
| Entrez ID | Symbol | Replicates | Species | Organ | Tissue | Adj P-value | Log2FC | Malignancy |
| 3486 | IGFBP3 | GSM4909285 | Human | Breast | IDC | 1.72e-06 | 2.76e-01 | 0.21 |
| 3486 | IGFBP3 | GSM4909286 | Human | Breast | IDC | 3.51e-04 | -1.80e-01 | 0.1081 |
| 3486 | IGFBP3 | GSM4909290 | Human | Breast | IDC | 8.79e-03 | -1.80e-01 | 0.2096 |
| 3486 | IGFBP3 | GSM4909295 | Human | Breast | IDC | 2.17e-06 | 5.50e-01 | 0.0898 |
| 3486 | IGFBP3 | GSM4909297 | Human | Breast | IDC | 1.57e-03 | -1.64e-01 | 0.1517 |
| 3486 | IGFBP3 | GSM4909312 | Human | Breast | IDC | 1.57e-03 | -1.80e-01 | 0.1552 |
| 3486 | IGFBP3 | GSM4909319 | Human | Breast | IDC | 1.48e-02 | -1.80e-01 | 0.1563 |
| 3486 | IGFBP3 | GSM4909321 | Human | Breast | IDC | 3.32e-03 | -1.80e-01 | 0.1559 |
| 3486 | IGFBP3 | ctrl6 | Human | Breast | Precancer | 3.50e-20 | 9.44e-01 | -0.0061 |
| 3486 | IGFBP3 | brca1 | Human | Breast | Precancer | 1.63e-04 | 2.58e-01 | -0.0338 |
| 3486 | IGFBP3 | NCCBC14 | Human | Breast | DCIS | 3.77e-03 | -1.80e-01 | 0.2021 |
| 3486 | IGFBP3 | DCIS2 | Human | Breast | DCIS | 5.02e-04 | -1.04e-01 | 0.0085 |
| 3486 | IGFBP3 | CA_HPV_1 | Human | Cervix | CC | 1.91e-06 | -3.48e-01 | 0.0264 |
| 3486 | IGFBP3 | CA_HPV_2 | Human | Cervix | CC | 4.18e-05 | 4.29e-01 | 0.0391 |
| 3486 | IGFBP3 | CA_HPV_3 | Human | Cervix | CC | 6.56e-03 | -3.43e-01 | 0.0414 |
| 3486 | IGFBP3 | N_HPV_1 | Human | Cervix | N_HPV | 7.81e-03 | -3.16e-01 | 0.0079 |
| 3486 | IGFBP3 | CCI_2 | Human | Cervix | CC | 3.29e-02 | -3.94e-01 | 0.5249 |
| 3486 | IGFBP3 | Tumor | Human | Cervix | CC | 1.69e-20 | 7.38e-01 | 0.1241 |
| 3486 | IGFBP3 | sample3 | Human | Cervix | CC | 5.19e-59 | 1.10e+00 | 0.1387 |
| 3486 | IGFBP3 | L1 | Human | Cervix | CC | 2.11e-02 | -1.61e-01 | 0.0802 |
| Page: 1 2 3 4 5 6 7 |
| Tissue | Expression Dynamics | Abbreviation |
| Breast | 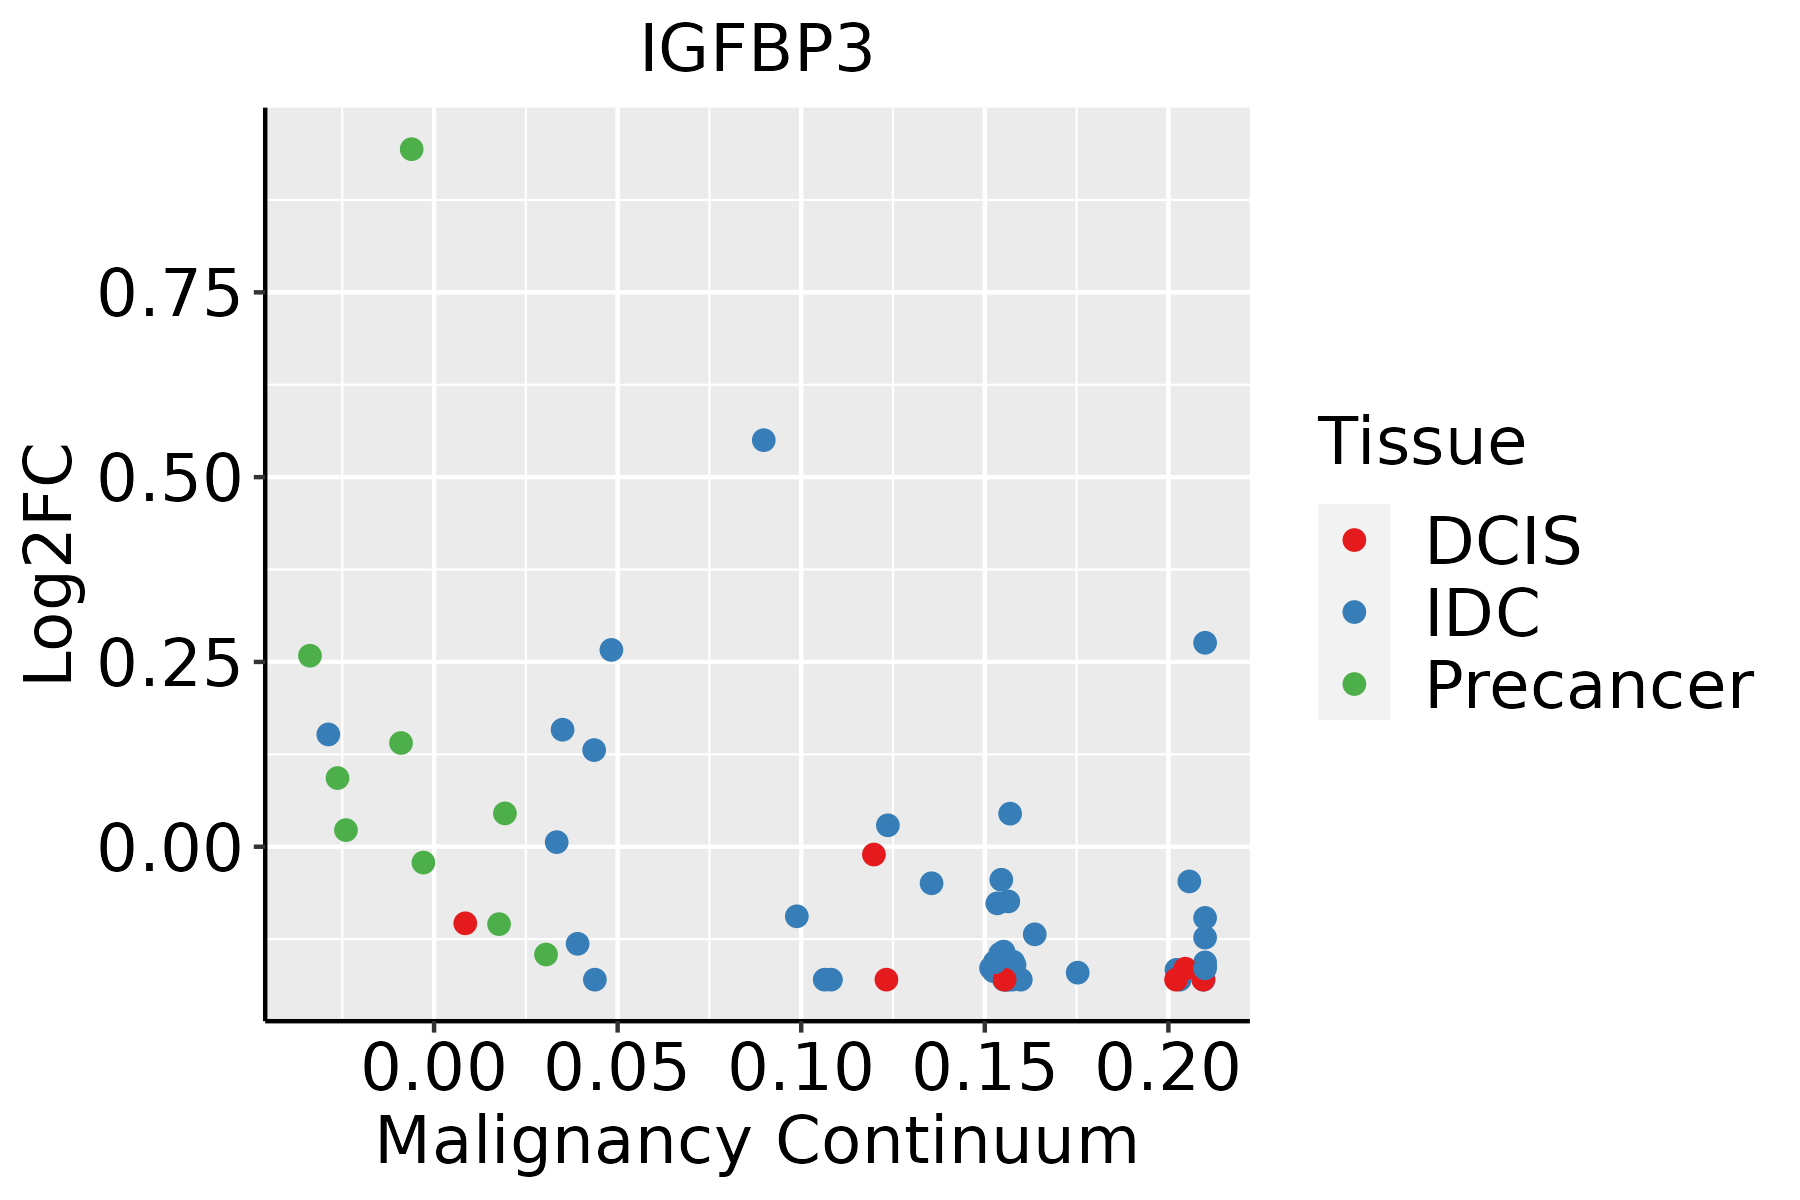 | IDC: Invasive ductal carcinoma |
| DCIS: Ductal carcinoma in situ | ||
| Precancer(BRCA1-mut): Precancerous lesion from BRCA1 mutation carriers | ||
| Cervix | 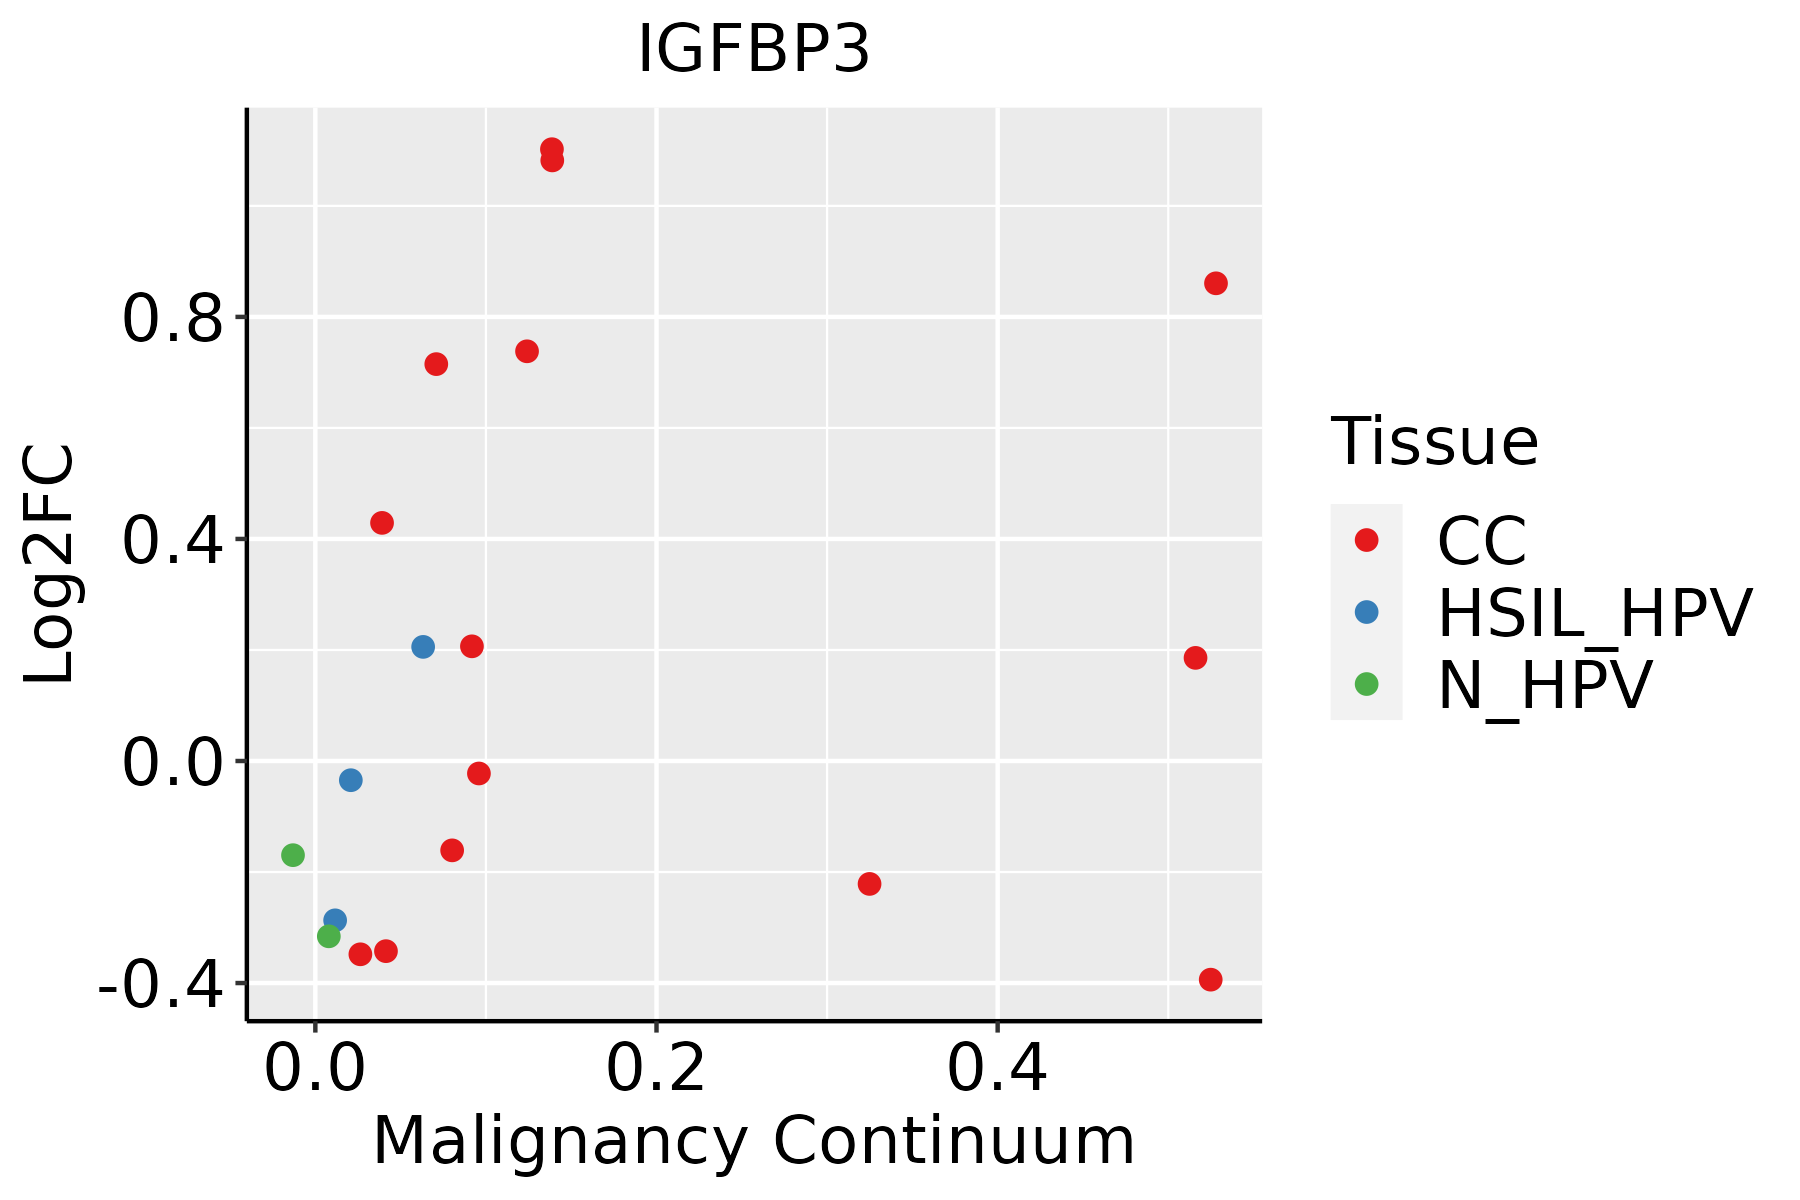 | CC: Cervix cancer |
| HSIL_HPV: HPV-infected high-grade squamous intraepithelial lesions | ||
| N_HPV: HPV-infected normal cervix | ||
| Colorectum (GSE201348) |  | FAP: Familial adenomatous polyposis |
| CRC: Colorectal cancer | ||
| Colorectum (HTA11) | 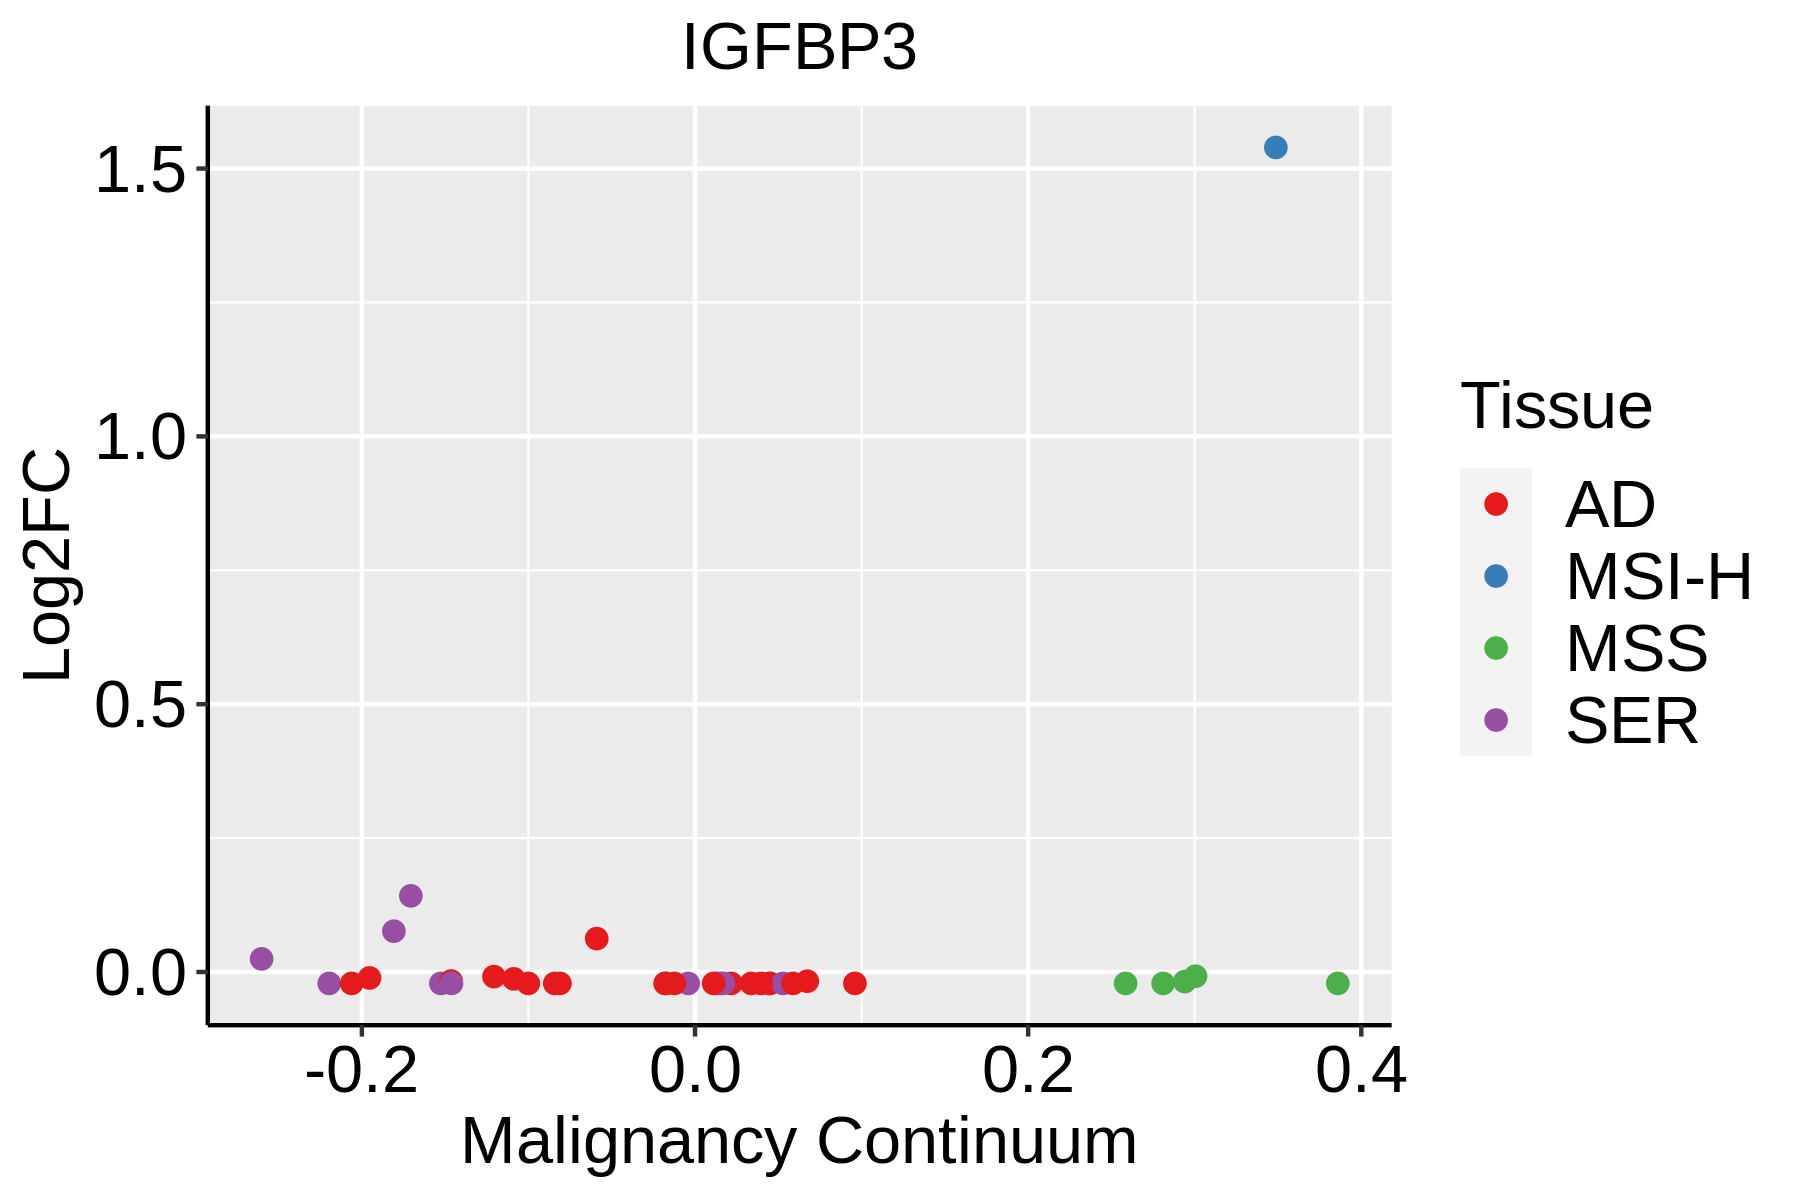 | AD: Adenomas |
| SER: Sessile serrated lesions | ||
| MSI-H: Microsatellite-high colorectal cancer | ||
| MSS: Microsatellite stable colorectal cancer | ||
| Endometrium | 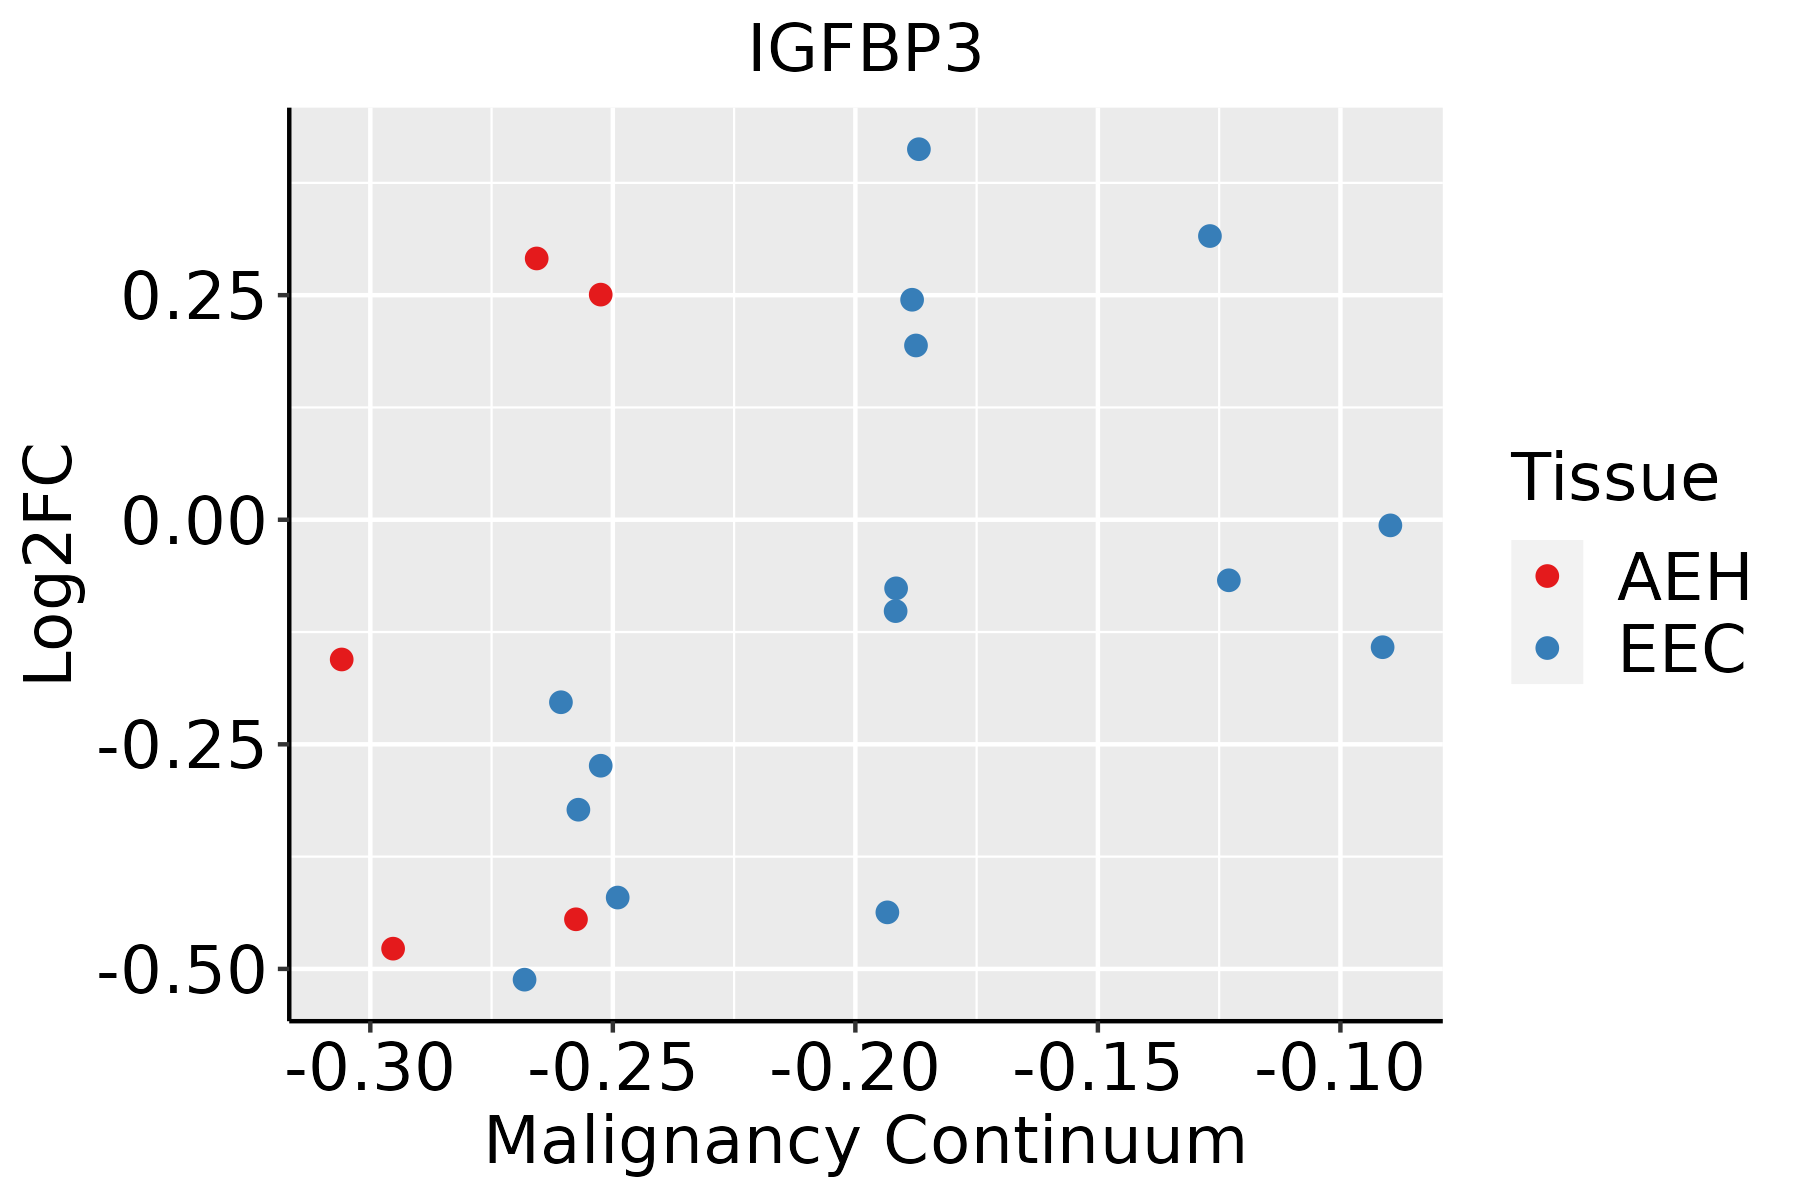 | AEH: Atypical endometrial hyperplasia |
| EEC: Endometrioid Cancer | ||
| Esophagus | 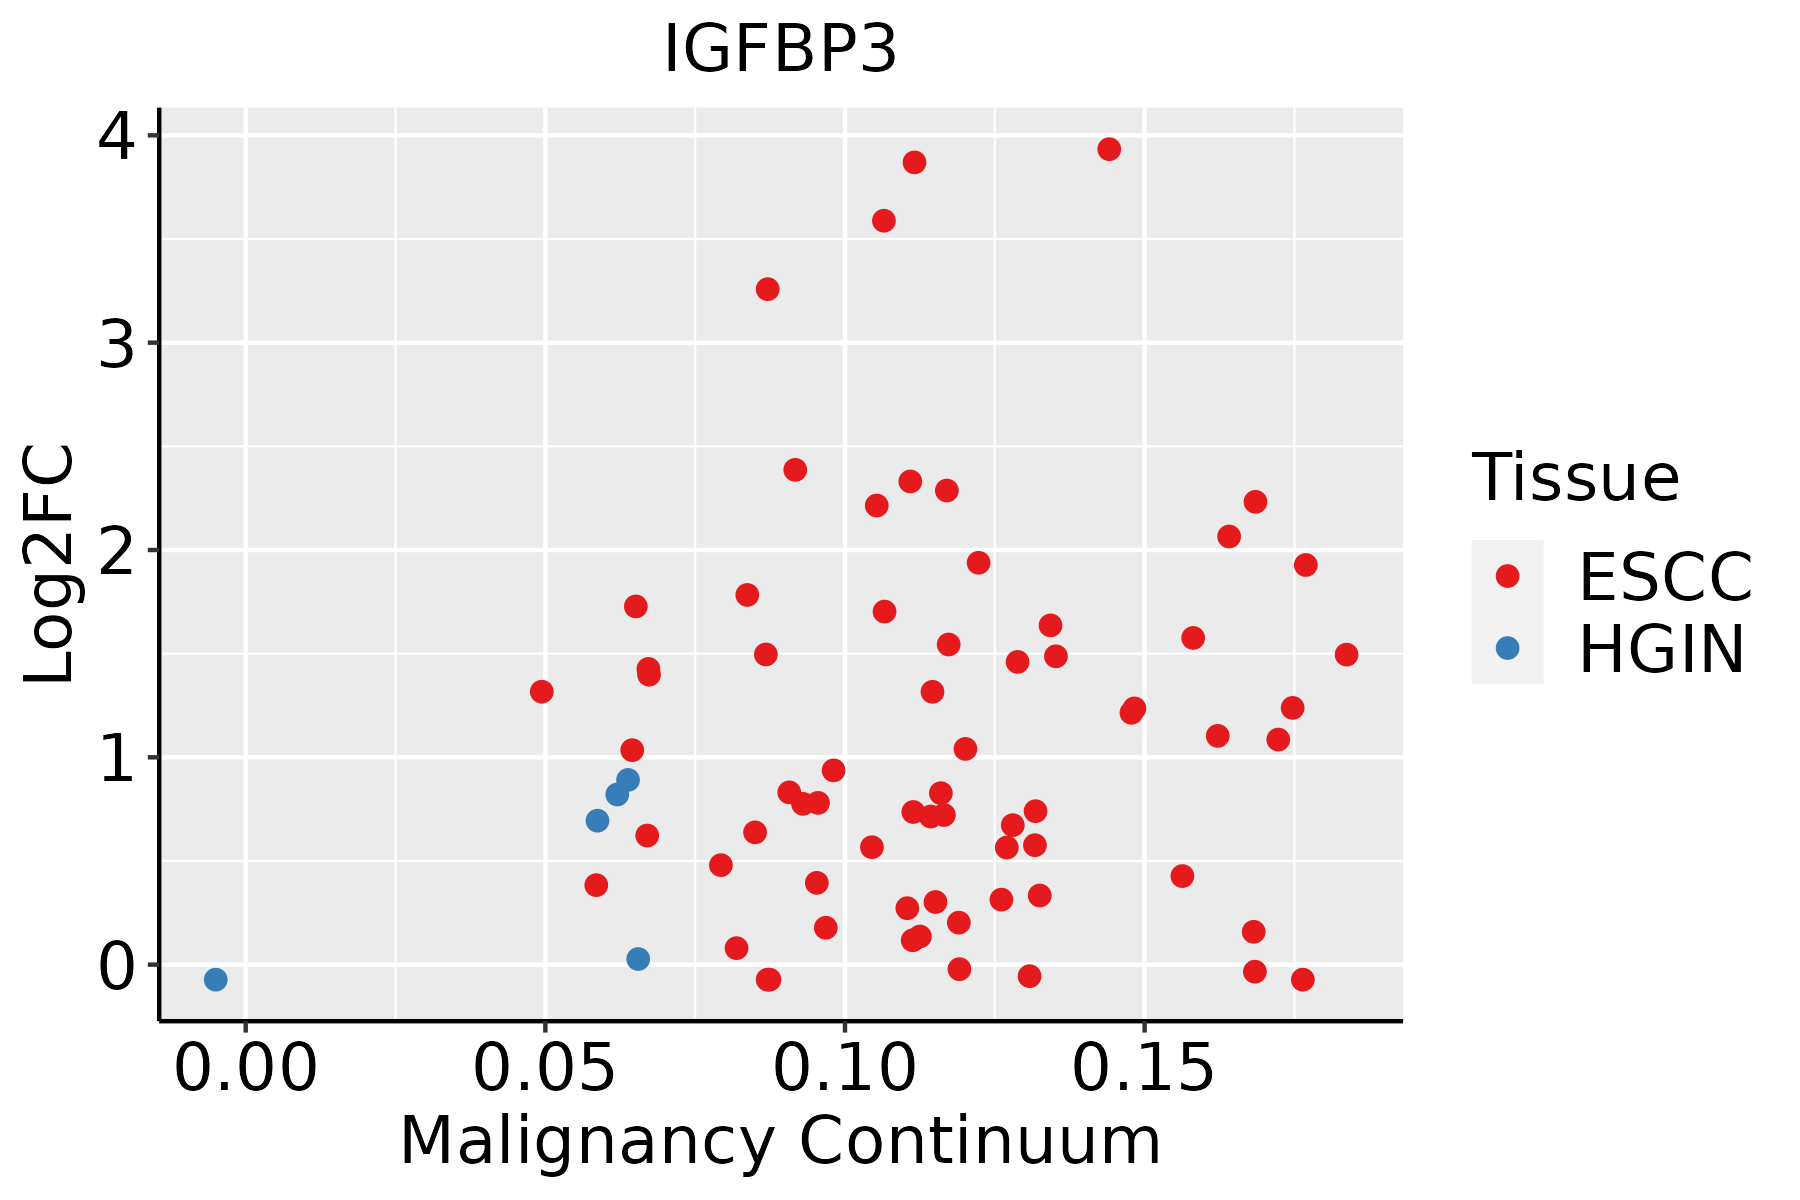 | ESCC: Esophageal squamous cell carcinoma |
| HGIN: High-grade intraepithelial neoplasias | ||
| LGIN: Low-grade intraepithelial neoplasias | ||
| Oral Cavity |  | EOLP: Erosive Oral lichen planus |
| LP: leukoplakia | ||
| NEOLP: Non-erosive oral lichen planus | ||
| OSCC: Oral squamous cell carcinoma | ||
| Prostate | 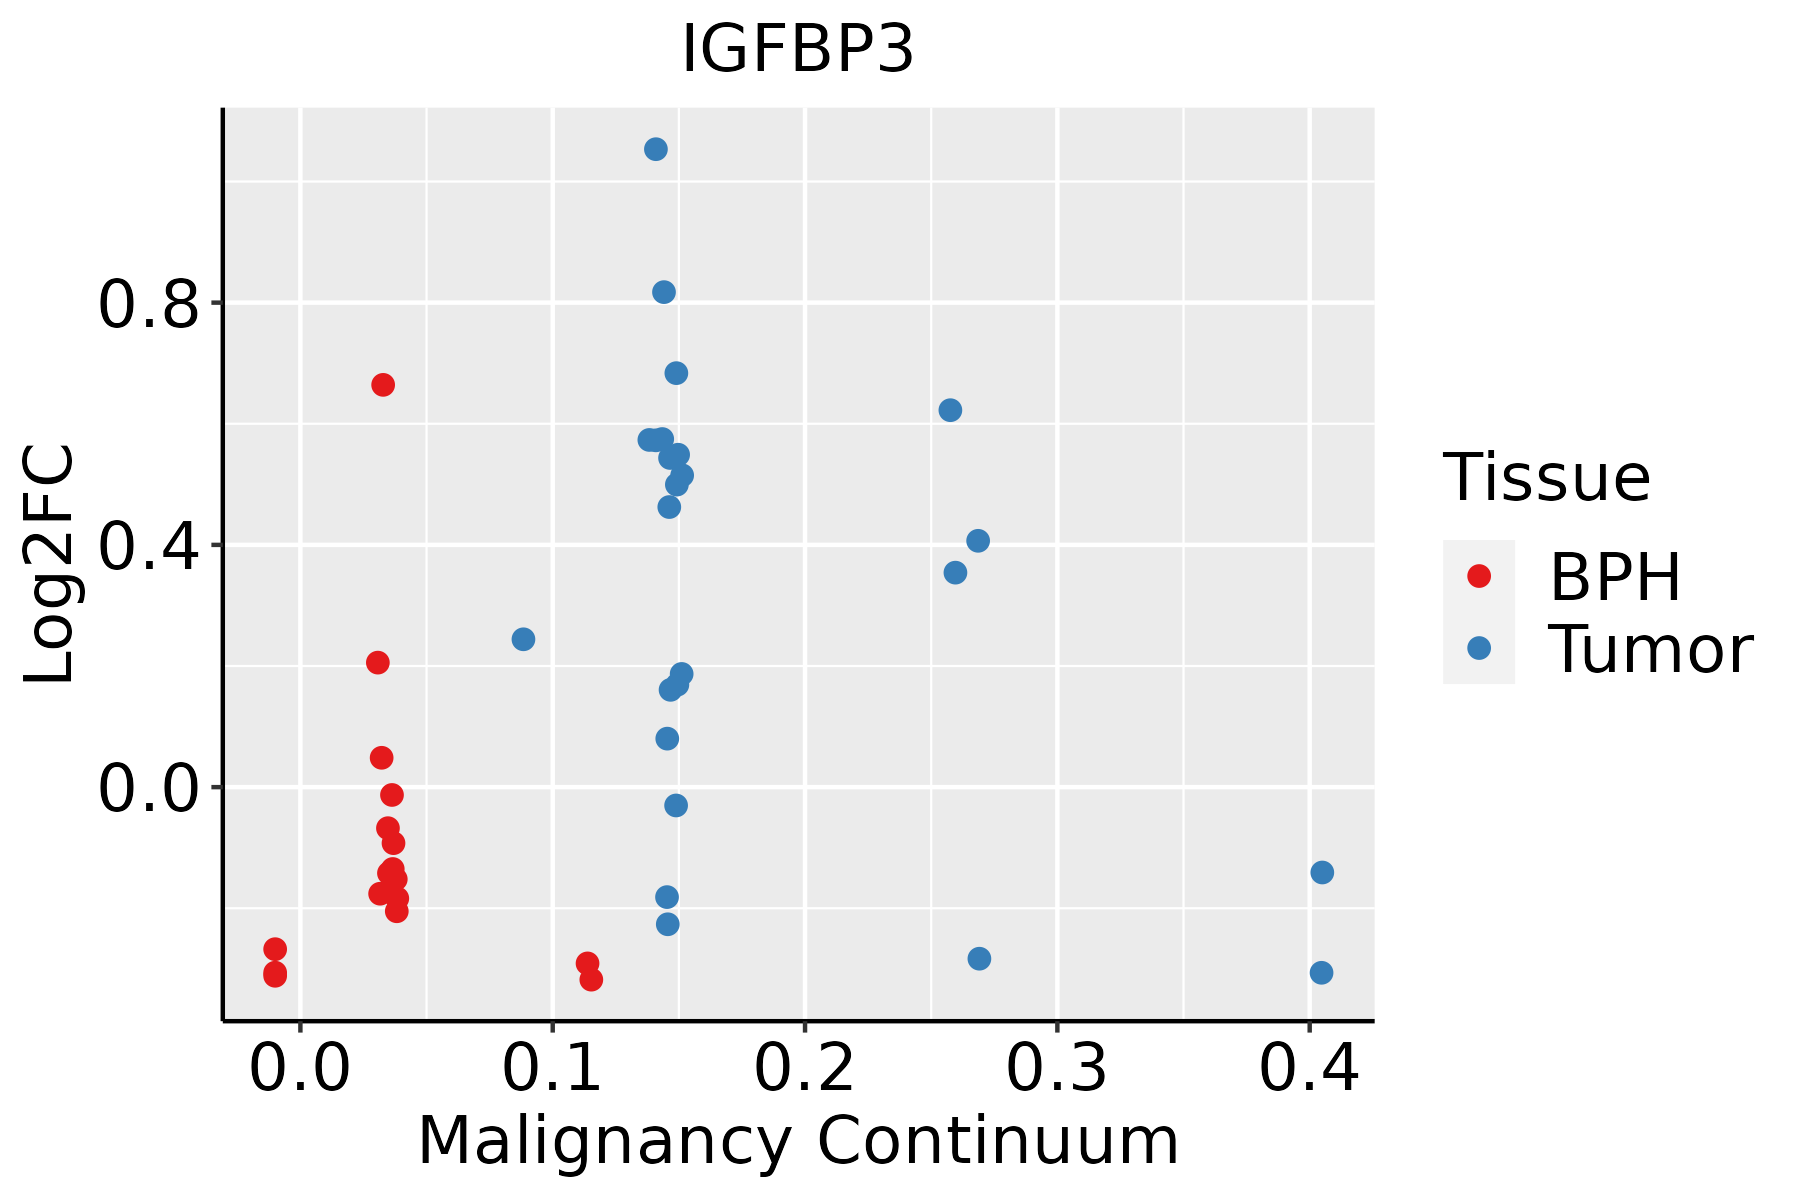 | BPH: Benign Prostatic Hyperplasia |
| Skin |  | AK: Actinic keratosis |
| cSCC: Cutaneous squamous cell carcinoma | ||
| SCCIS:squamous cell carcinoma in situ | ||
| Thyroid | 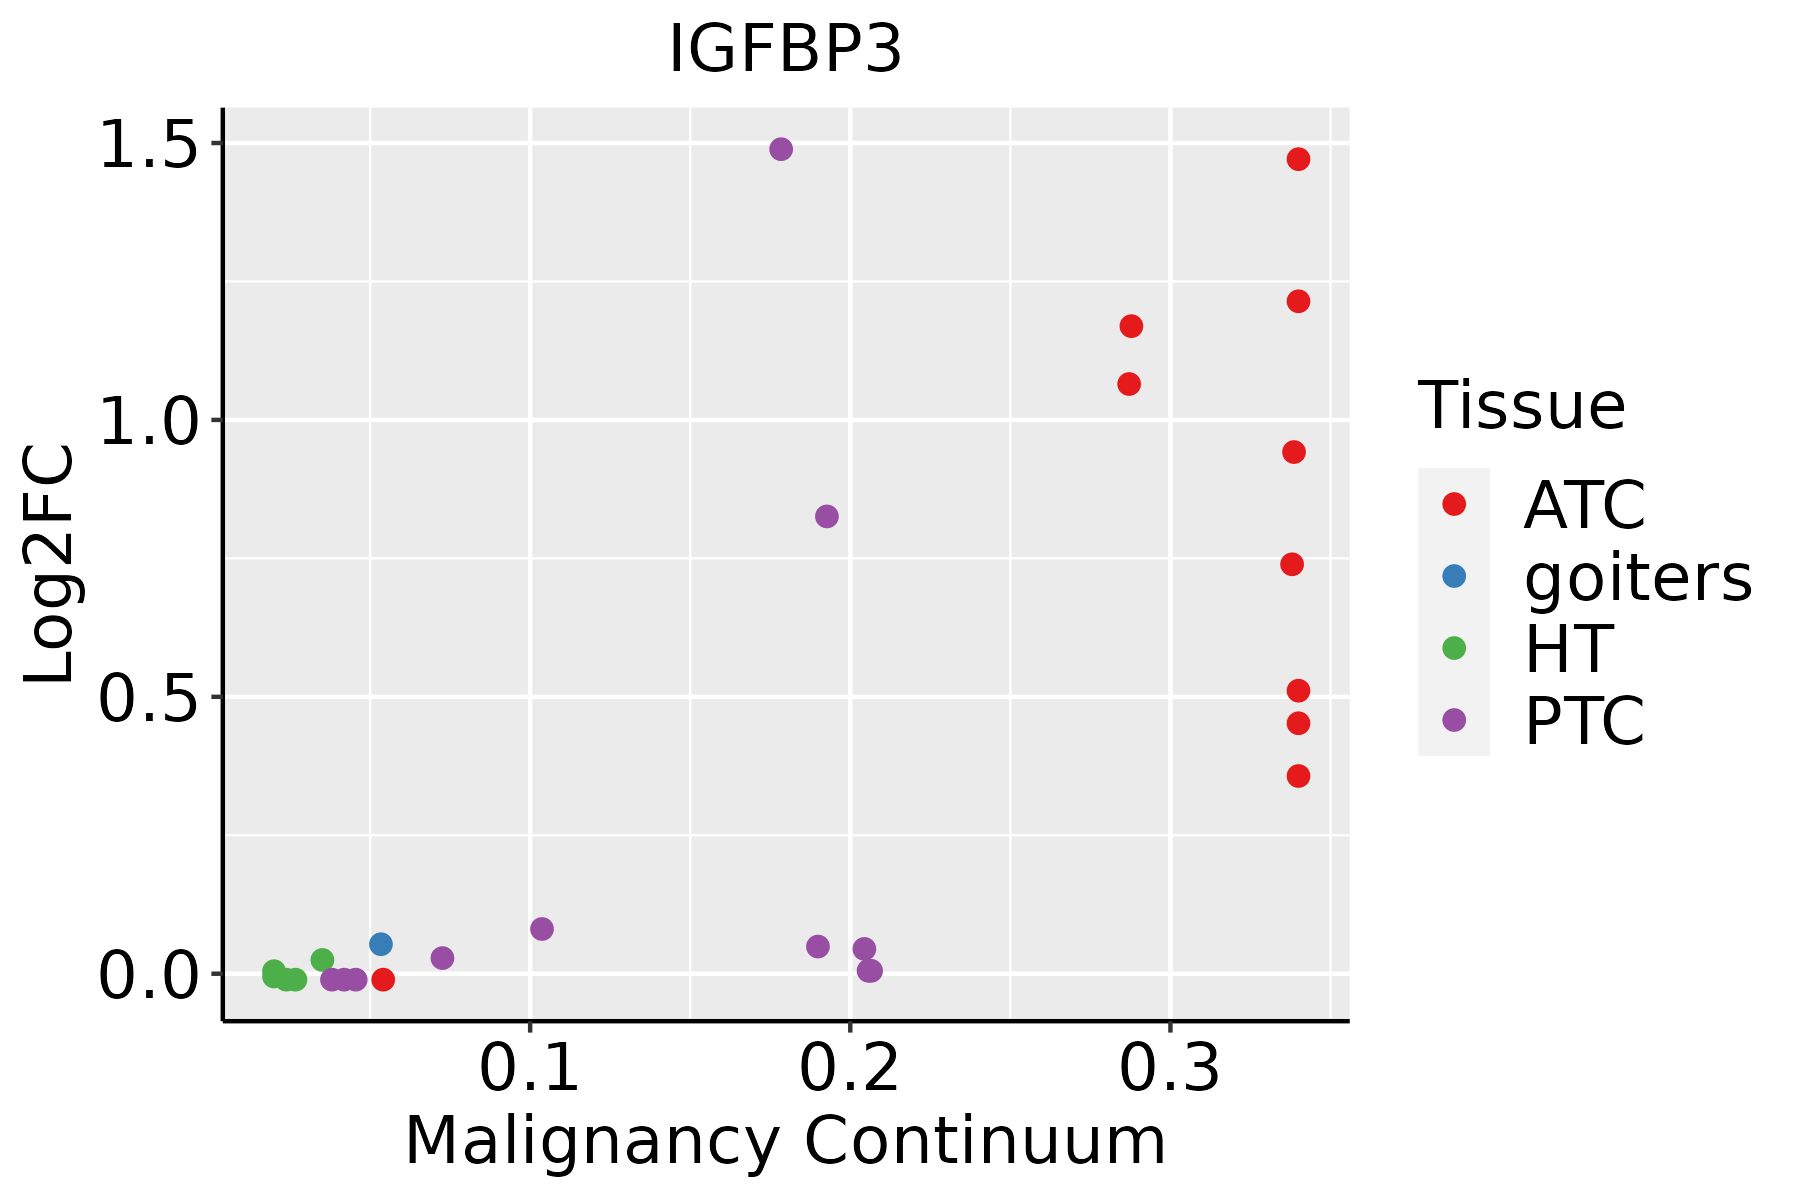 | ATC: Anaplastic thyroid cancer |
| HT: Hashimoto's thyroiditis | ||
| PTC: Papillary thyroid cancer |
| ∗log2FC in expression of this searched gene in stem-like cells from each diseased tissue sample relative to stem-like cells in normal samples in each tissue plotted against the malignancy continuum. Samples are colored based on if they are from different disease stage. |
Top |
Malignant transformation related pathway analysis |
| Find out the enriched GO biological processes and KEGG pathways involved in transition from healthy to precancer to cancer |
| Tissue | Disease Stage | Enriched GO biological Processes |
| Colorectum | AD |  |
| Colorectum | SER |  |
| Colorectum | MSS |  |
| Colorectum | MSI-H |  |
| Colorectum | FAP |  |
| ∗Top 15 enriched GO BP terms are showed in the bar plot of each disease state in each tissue. Each row represents a significant GO biological process which is colored according to the -log10(p.adjust). |
| Page: 1 2 3 4 5 6 7 8 9 |
| GO ID | Tissue | Disease Stage | Description | Gene Ratio | Bg Ratio | pvalue | p.adjust | Count |
| GO:0045936113 | Thyroid | PTC | negative regulation of phosphate metabolic process | 218/5968 | 441/18723 | 7.08e-15 | 4.75e-13 | 218 |
| GO:0001933113 | Thyroid | PTC | negative regulation of protein phosphorylation | 173/5968 | 342/18723 | 3.46e-13 | 1.75e-11 | 173 |
| GO:0042326113 | Thyroid | PTC | negative regulation of phosphorylation | 189/5968 | 385/18723 | 1.00e-12 | 4.64e-11 | 189 |
| GO:001481212 | Thyroid | PTC | muscle cell migration | 50/5968 | 110/18723 | 1.93e-03 | 1.04e-02 | 50 |
| GO:00149095 | Thyroid | PTC | smooth muscle cell migration | 44/5968 | 97/18723 | 3.65e-03 | 1.76e-02 | 44 |
| GO:00480095 | Thyroid | PTC | insulin-like growth factor receptor signaling pathway | 19/5968 | 37/18723 | 1.07e-02 | 4.29e-02 | 19 |
| GO:001056334 | Thyroid | ATC | negative regulation of phosphorus metabolic process | 234/6293 | 442/18723 | 2.30e-17 | 2.31e-15 | 234 |
| GO:004593634 | Thyroid | ATC | negative regulation of phosphate metabolic process | 233/6293 | 441/18723 | 3.68e-17 | 3.47e-15 | 233 |
| GO:000193333 | Thyroid | ATC | negative regulation of protein phosphorylation | 186/6293 | 342/18723 | 1.43e-15 | 1.08e-13 | 186 |
| GO:004232634 | Thyroid | ATC | negative regulation of phosphorylation | 203/6293 | 385/18723 | 5.30e-15 | 3.53e-13 | 203 |
| GO:001481221 | Thyroid | ATC | muscle cell migration | 54/6293 | 110/18723 | 5.47e-04 | 3.16e-03 | 54 |
| GO:001490914 | Thyroid | ATC | smooth muscle cell migration | 48/6293 | 97/18723 | 8.66e-04 | 4.71e-03 | 48 |
| GO:003300214 | Thyroid | ATC | muscle cell proliferation | 107/6293 | 248/18723 | 1.03e-03 | 5.47e-03 | 107 |
| GO:004001316 | Thyroid | ATC | negative regulation of locomotion | 160/6293 | 391/18723 | 1.36e-03 | 7.07e-03 | 160 |
| GO:003033616 | Thyroid | ATC | negative regulation of cell migration | 142/6293 | 344/18723 | 1.64e-03 | 8.22e-03 | 142 |
| GO:005127117 | Thyroid | ATC | negative regulation of cellular component movement | 150/6293 | 367/18723 | 1.99e-03 | 9.54e-03 | 150 |
| GO:200014617 | Thyroid | ATC | negative regulation of cell motility | 147/6293 | 359/18723 | 2.01e-03 | 9.60e-03 | 147 |
| GO:004865916 | Thyroid | ATC | smooth muscle cell proliferation | 81/6293 | 184/18723 | 2.02e-03 | 9.60e-03 | 81 |
| GO:004866016 | Thyroid | ATC | regulation of smooth muscle cell proliferation | 78/6293 | 180/18723 | 4.00e-03 | 1.73e-02 | 78 |
| GO:004800914 | Thyroid | ATC | insulin-like growth factor receptor signaling pathway | 20/6293 | 37/18723 | 8.24e-03 | 3.16e-02 | 20 |
| Page: 1 2 3 4 5 6 7 8 9 |
| Pathway ID | Tissue | Disease Stage | Description | Gene Ratio | Bg Ratio | pvalue | p.adjust | qvalue | Count |
| hsa042189 | Breast | Precancer | Cellular senescence | 29/684 | 156/8465 | 1.66e-05 | 1.69e-04 | 1.30e-04 | 29 |
| hsa0421814 | Breast | Precancer | Cellular senescence | 29/684 | 156/8465 | 1.66e-05 | 1.69e-04 | 1.30e-04 | 29 |
| hsa0421824 | Breast | IDC | Cellular senescence | 35/867 | 156/8465 | 5.49e-06 | 7.43e-05 | 5.56e-05 | 35 |
| hsa041157 | Breast | IDC | p53 signaling pathway | 16/867 | 74/8465 | 2.86e-03 | 1.86e-02 | 1.39e-02 | 16 |
| hsa0421834 | Breast | IDC | Cellular senescence | 35/867 | 156/8465 | 5.49e-06 | 7.43e-05 | 5.56e-05 | 35 |
| hsa0411512 | Breast | IDC | p53 signaling pathway | 16/867 | 74/8465 | 2.86e-03 | 1.86e-02 | 1.39e-02 | 16 |
| hsa0421844 | Breast | DCIS | Cellular senescence | 34/846 | 156/8465 | 8.53e-06 | 1.06e-04 | 7.80e-05 | 34 |
| hsa0411521 | Breast | DCIS | p53 signaling pathway | 16/846 | 74/8465 | 2.23e-03 | 1.47e-02 | 1.08e-02 | 16 |
| hsa0421854 | Breast | DCIS | Cellular senescence | 34/846 | 156/8465 | 8.53e-06 | 1.06e-04 | 7.80e-05 | 34 |
| hsa0411531 | Breast | DCIS | p53 signaling pathway | 16/846 | 74/8465 | 2.23e-03 | 1.47e-02 | 1.08e-02 | 16 |
| hsa0421810 | Cervix | CC | Cellular senescence | 49/1267 | 156/8465 | 1.30e-07 | 1.63e-06 | 9.61e-07 | 49 |
| hsa0421815 | Cervix | CC | Cellular senescence | 49/1267 | 156/8465 | 1.30e-07 | 1.63e-06 | 9.61e-07 | 49 |
| hsa0421816 | Endometrium | AEH | Cellular senescence | 37/1197 | 156/8465 | 8.49e-04 | 5.52e-03 | 4.04e-03 | 37 |
| hsa0421817 | Endometrium | AEH | Cellular senescence | 37/1197 | 156/8465 | 8.49e-04 | 5.52e-03 | 4.04e-03 | 37 |
| hsa0421825 | Endometrium | EEC | Cellular senescence | 40/1237 | 156/8465 | 1.89e-04 | 1.68e-03 | 1.25e-03 | 40 |
| hsa0421835 | Endometrium | EEC | Cellular senescence | 40/1237 | 156/8465 | 1.89e-04 | 1.68e-03 | 1.25e-03 | 40 |
| hsa0411524 | Esophagus | ESCC | p53 signaling pathway | 65/4205 | 74/8465 | 3.88e-12 | 6.50e-11 | 3.33e-11 | 65 |
| hsa0421829 | Esophagus | ESCC | Cellular senescence | 119/4205 | 156/8465 | 5.89e-12 | 9.40e-11 | 4.81e-11 | 119 |
| hsa052028 | Esophagus | ESCC | Transcriptional misregulation in cancer | 116/4205 | 193/8465 | 2.08e-03 | 5.95e-03 | 3.05e-03 | 116 |
| hsa0411534 | Esophagus | ESCC | p53 signaling pathway | 65/4205 | 74/8465 | 3.88e-12 | 6.50e-11 | 3.33e-11 | 65 |
| Page: 1 2 3 |
Top |
Cell-cell communication analysis |
| Identification of potential cell-cell interactions between two cell types and their ligand-receptor pairs for different disease states |
| Ligand | Receptor | LRpair | Pathway | Tissue | Disease Stage |
| Page: 1 |
Top |
Single-cell gene regulatory network inference analysis |
| Find out the significant the regulons (TFs) and the target genes of each regulon across cell types for different disease states |
| TF | Cell Type | Tissue | Disease Stage | Target Gene | RSS | Regulon Activity |
| ∗The dot plots of a searched regulon are shown for all cell subpopulations in each disease state of each tissue based on the regulon specific score inferred using pySCENIC and by calculating the average expression. |
| Page: 1 |
Top |
Somatic mutation of malignant transformation related genes |
| Annotation of somatic variants for genes involved in malignant transformation |
| Hugo Symbol | Variant Class | Variant Classification | dbSNP RS | HGVSc | HGVSp | HGVSp Short | SWISSPROT | BIOTYPE | SIFT | PolyPhen | Tumor Sample Barcode | Tissue | Histology | Sex | Age | Stage | Therapy Types | Drugs | Outcome |
| IGFBP3 | insertion | Frame_Shift_Ins | novel | c.438_439insAGAGGAGA | p.Glu147ArgfsTer35 | p.E147Rfs*35 | P17936 | protein_coding | TCGA-A8-A096-01 | Breast | breast invasive carcinoma | Female | >=65 | I/II | Unknown | Unknown | SD | ||
| IGFBP3 | SNV | Missense_Mutation | c.701A>G | p.Asn234Ser | p.N234S | P17936 | protein_coding | tolerated(0.2) | benign(0.125) | TCGA-A6-2677-01 | Colorectum | colon adenocarcinoma | Female | >=65 | III/IV | Ancillary | leucovorin | SD | |
| IGFBP3 | SNV | Missense_Mutation | c.764N>T | p.Lys255Met | p.K255M | P17936 | protein_coding | deleterious(0) | probably_damaging(0.998) | TCGA-AA-3966-01 | Colorectum | colon adenocarcinoma | Female | >=65 | I/II | Unknown | Unknown | SD | |
| IGFBP3 | SNV | Missense_Mutation | novel | c.618N>A | p.Phe206Leu | p.F206L | P17936 | protein_coding | deleterious(0.03) | benign(0.072) | TCGA-AZ-4315-01 | Colorectum | colon adenocarcinoma | Male | <65 | I/II | Unknown | Unknown | SD |
| IGFBP3 | SNV | Missense_Mutation | c.770N>A | p.Cys257Tyr | p.C257Y | P17936 | protein_coding | deleterious(0) | probably_damaging(0.998) | TCGA-CK-5916-01 | Colorectum | colon adenocarcinoma | Female | >=65 | I/II | Unknown | Unknown | PD | |
| IGFBP3 | SNV | Missense_Mutation | rs768974204 | c.637G>C | p.Glu213Gln | p.E213Q | P17936 | protein_coding | deleterious(0.04) | possibly_damaging(0.73) | TCGA-CM-5861-01 | Colorectum | colon adenocarcinoma | Female | <65 | I/II | Unknown | Unknown | PD |
| IGFBP3 | SNV | Missense_Mutation | c.572G>A | p.Arg191His | p.R191H | P17936 | protein_coding | tolerated(0.1) | benign(0.151) | TCGA-AG-4007-01 | Colorectum | rectum adenocarcinoma | Male | >=65 | III/IV | Unknown | Unknown | SD | |
| IGFBP3 | SNV | Missense_Mutation | novel | c.758A>C | p.Lys253Thr | p.K253T | P17936 | protein_coding | deleterious(0) | probably_damaging(0.996) | TCGA-F5-6814-01 | Colorectum | rectum adenocarcinoma | Male | <65 | I/II | Unknown | Unknown | SD |
| IGFBP3 | deletion | Frame_Shift_Del | c.719delG | p.Gly240ValfsTer65 | p.G240Vfs*65 | P17936 | protein_coding | TCGA-AA-3710-01 | Colorectum | colon adenocarcinoma | Female | >=65 | I/II | Unknown | Unknown | SD | |||
| IGFBP3 | SNV | Missense_Mutation | rs755080654 | c.830C>T | p.Pro277Leu | p.P277L | P17936 | protein_coding | deleterious(0) | probably_damaging(0.947) | TCGA-A5-A0G2-01 | Endometrium | uterine corpus endometrioid carcinoma | Female | <65 | III/IV | Unknown | Unknown | SD |
| Page: 1 2 3 4 |
Top |
Related drugs of malignant transformation related genes |
| Identification of chemicals and drugs interact with genes involved in malignant transfromation |
| (DGIdb 4.0) |
| Entrez ID | Symbol | Category | Interaction Types | Drug Claim Name | Drug Name | PMIDs |
| 3486 | IGFBP3 | DRUGGABLE GENOME | celecoxib | CELECOXIB | 22336956 | |
| 3486 | IGFBP3 | DRUGGABLE GENOME | fluorouracil | FLUOROURACIL | 20860465 |
| Page: 1 |

Copyright 2023-Present -The University of Texas Health Science Center at Houston |