| Tissue | Expression Dynamics | Abbreviation |
| Cervix |  | CC: Cervix cancer |
| HSIL_HPV: HPV-infected high-grade squamous intraepithelial lesions |
| N_HPV: HPV-infected normal cervix |
| Endometrium | 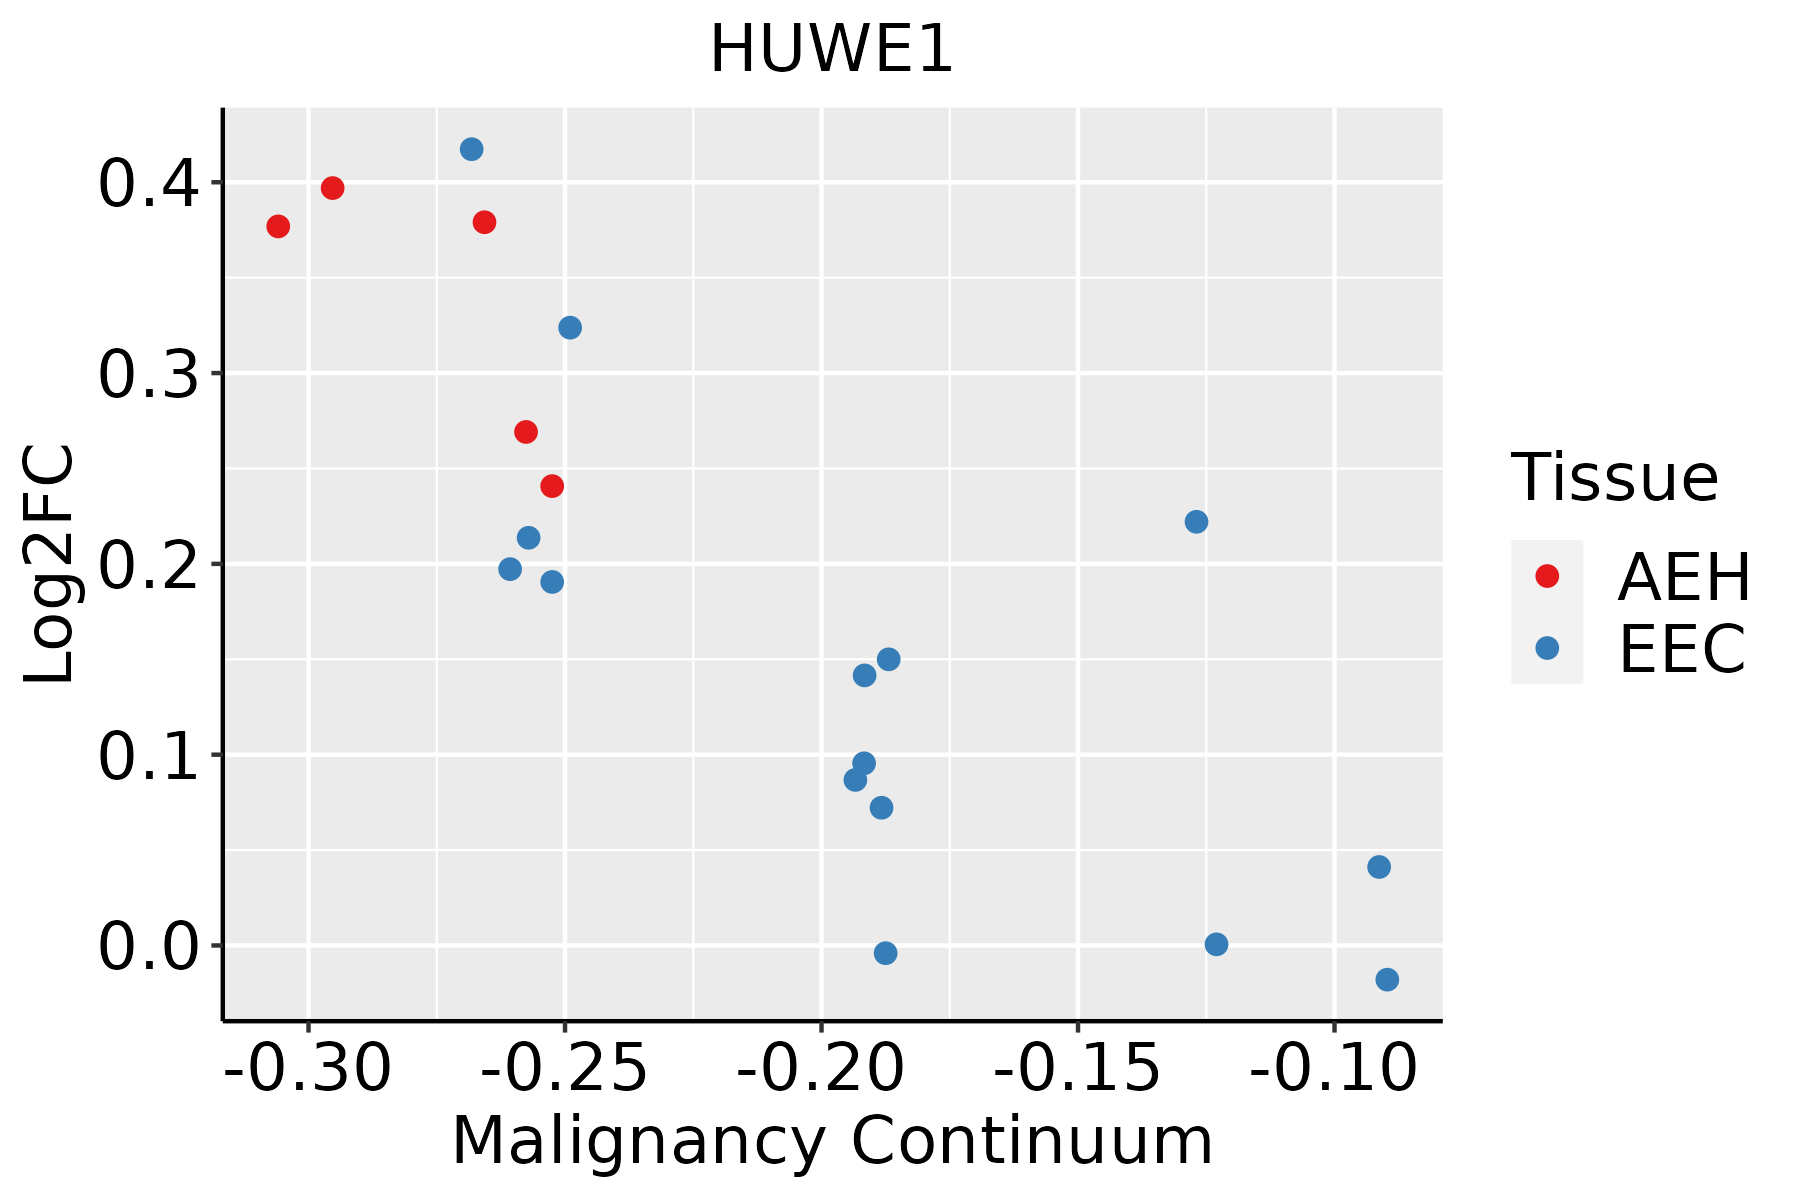 | AEH: Atypical endometrial hyperplasia |
| EEC: Endometrioid Cancer |
| Esophagus | 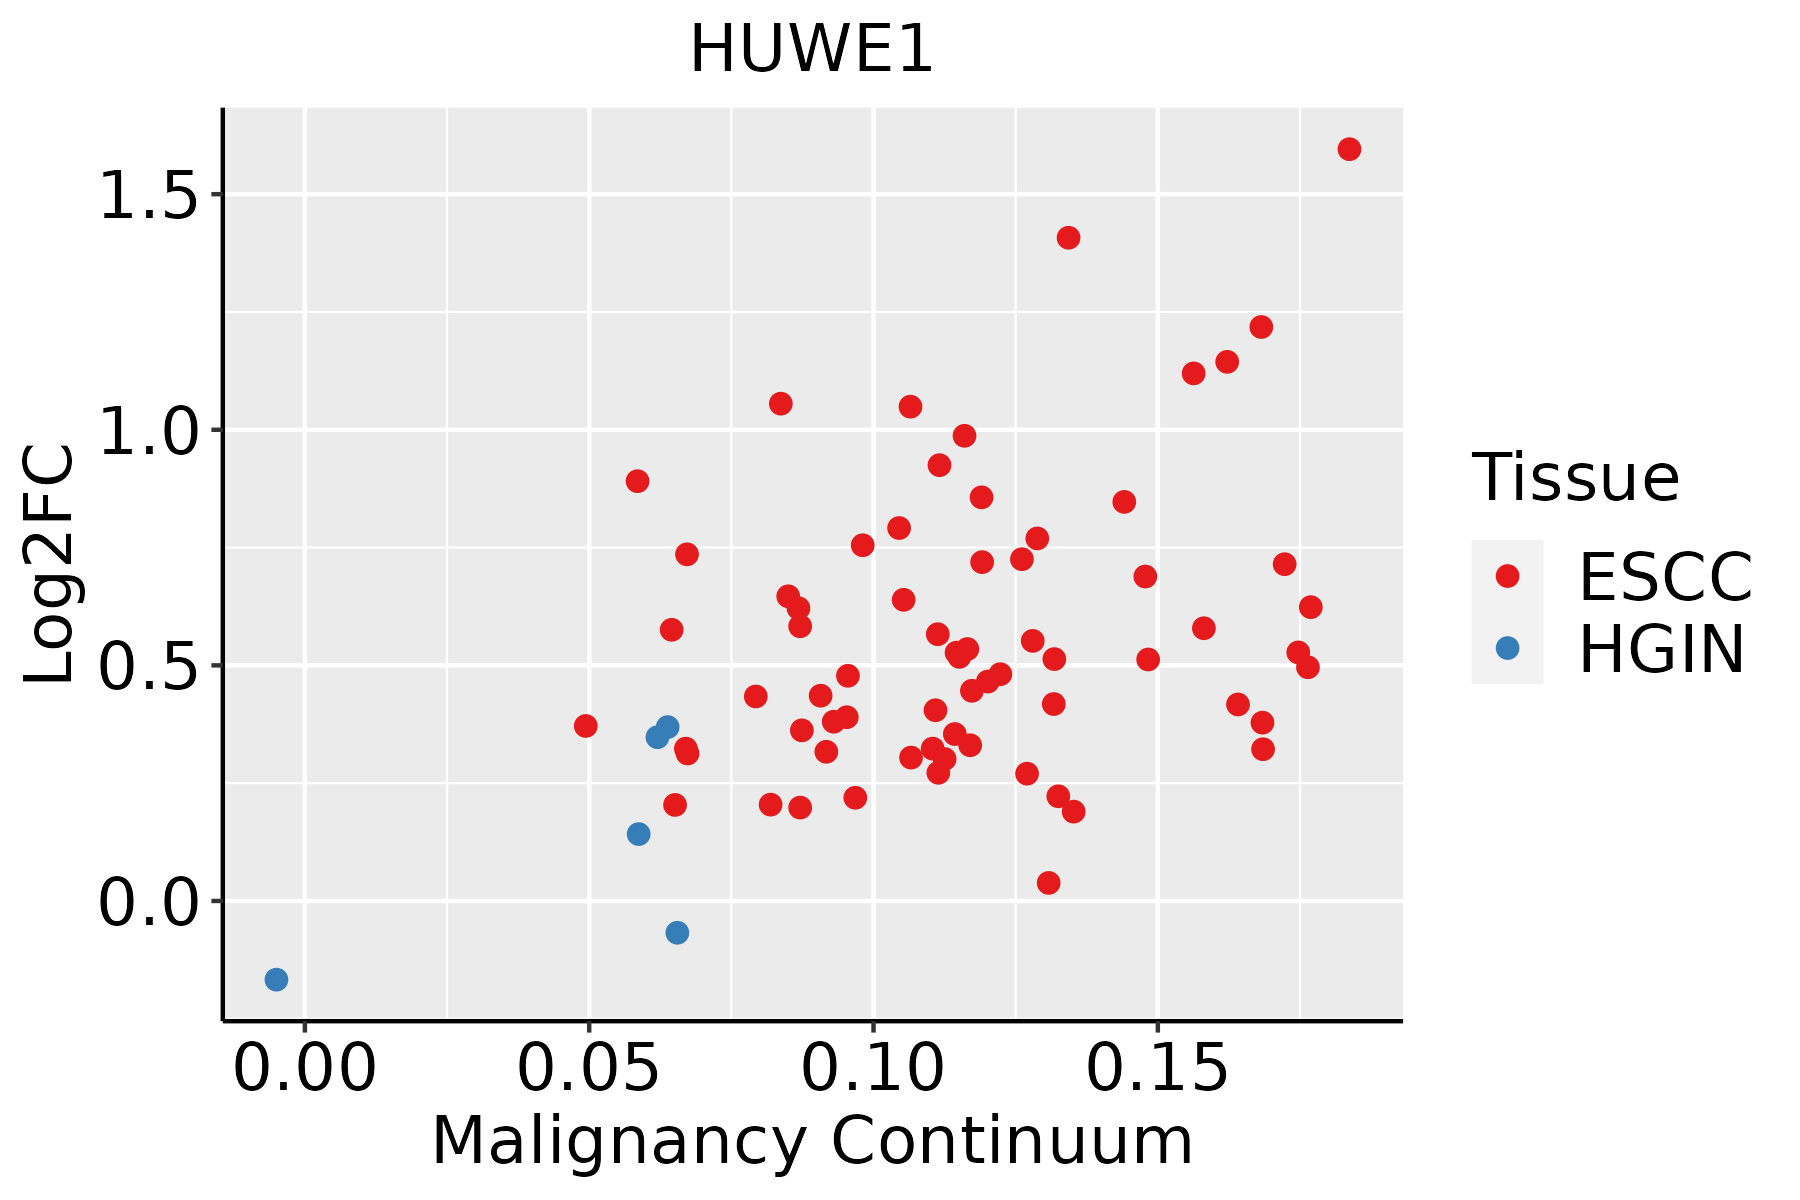 | ESCC: Esophageal squamous cell carcinoma |
| HGIN: High-grade intraepithelial neoplasias |
| LGIN: Low-grade intraepithelial neoplasias |
| Liver |  | HCC: Hepatocellular carcinoma |
| NAFLD: Non-alcoholic fatty liver disease |
| Lung | 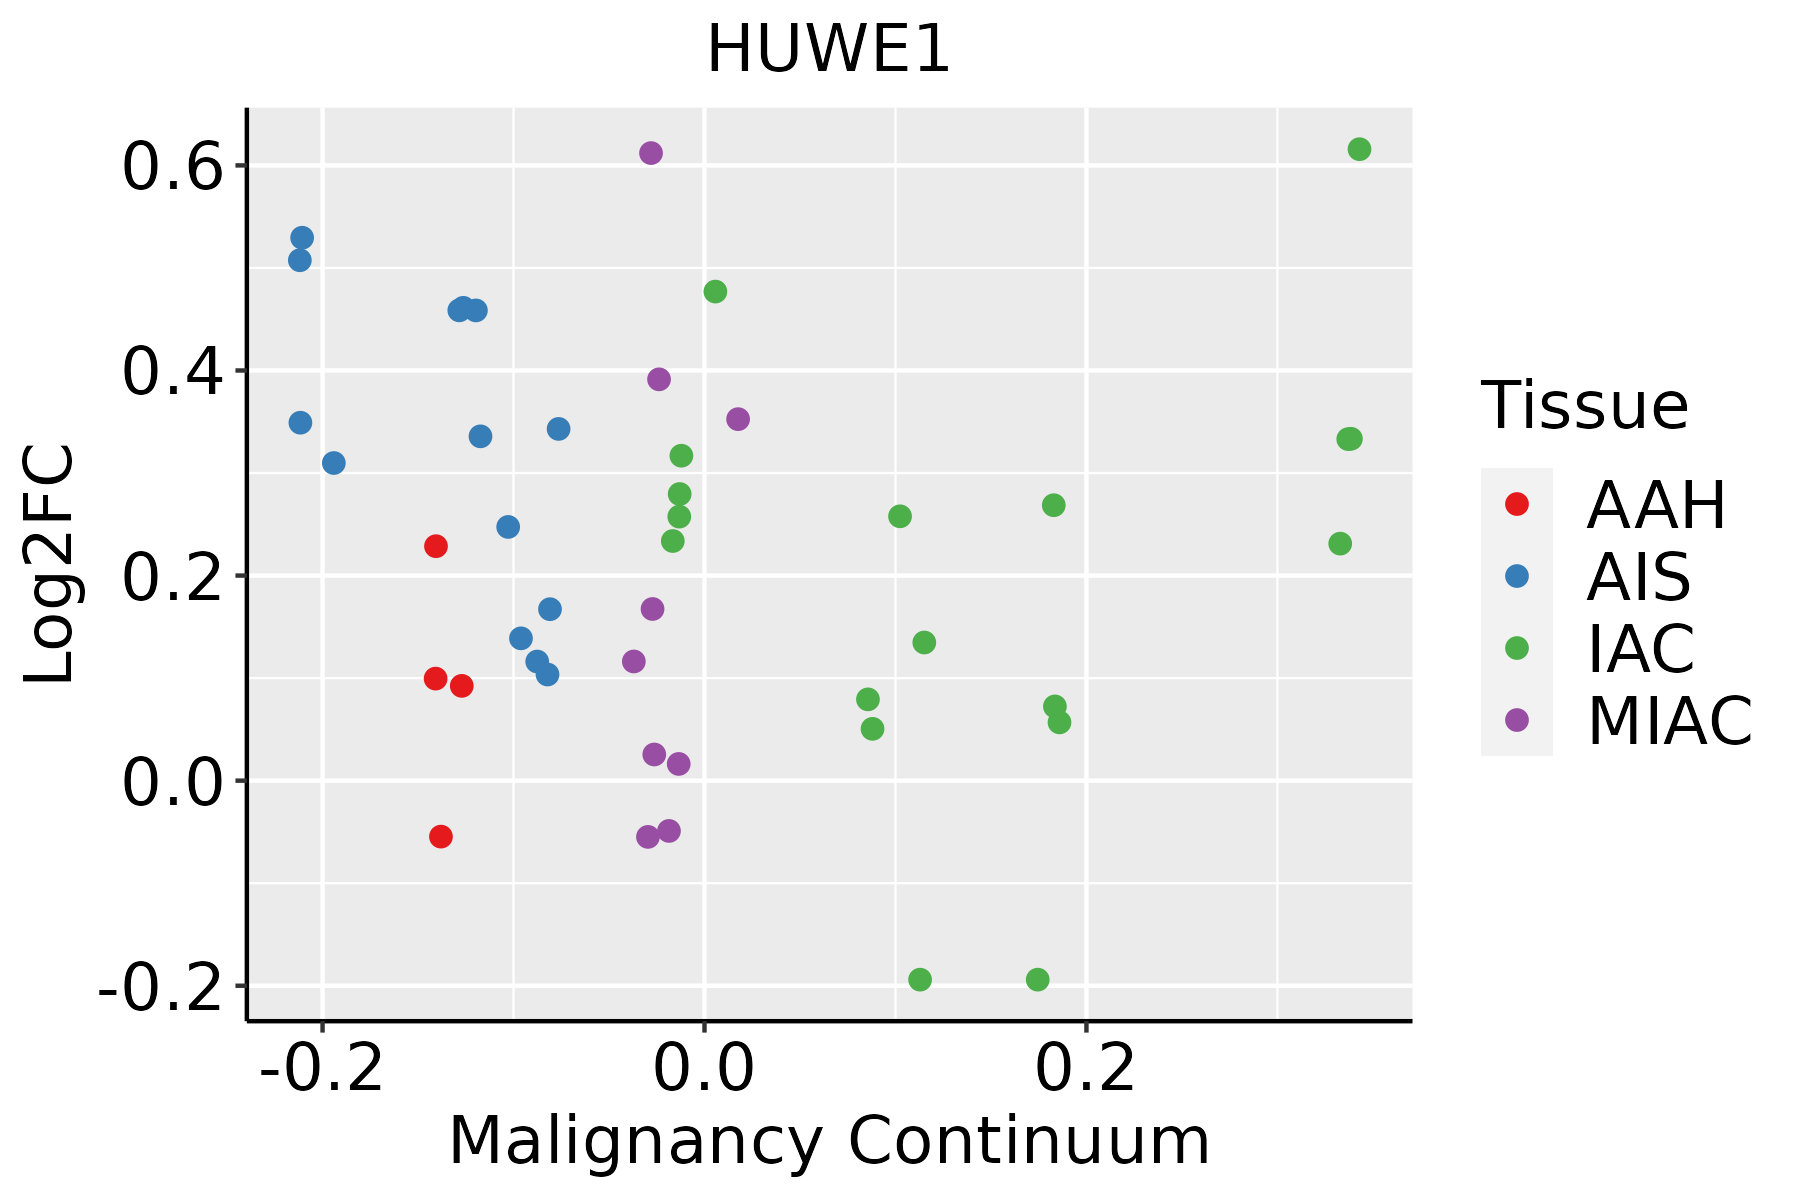 | AAH: Atypical adenomatous hyperplasia |
| AIS: Adenocarcinoma in situ |
| IAC: Invasive lung adenocarcinoma |
| MIA: Minimally invasive adenocarcinoma |
| Oral Cavity | 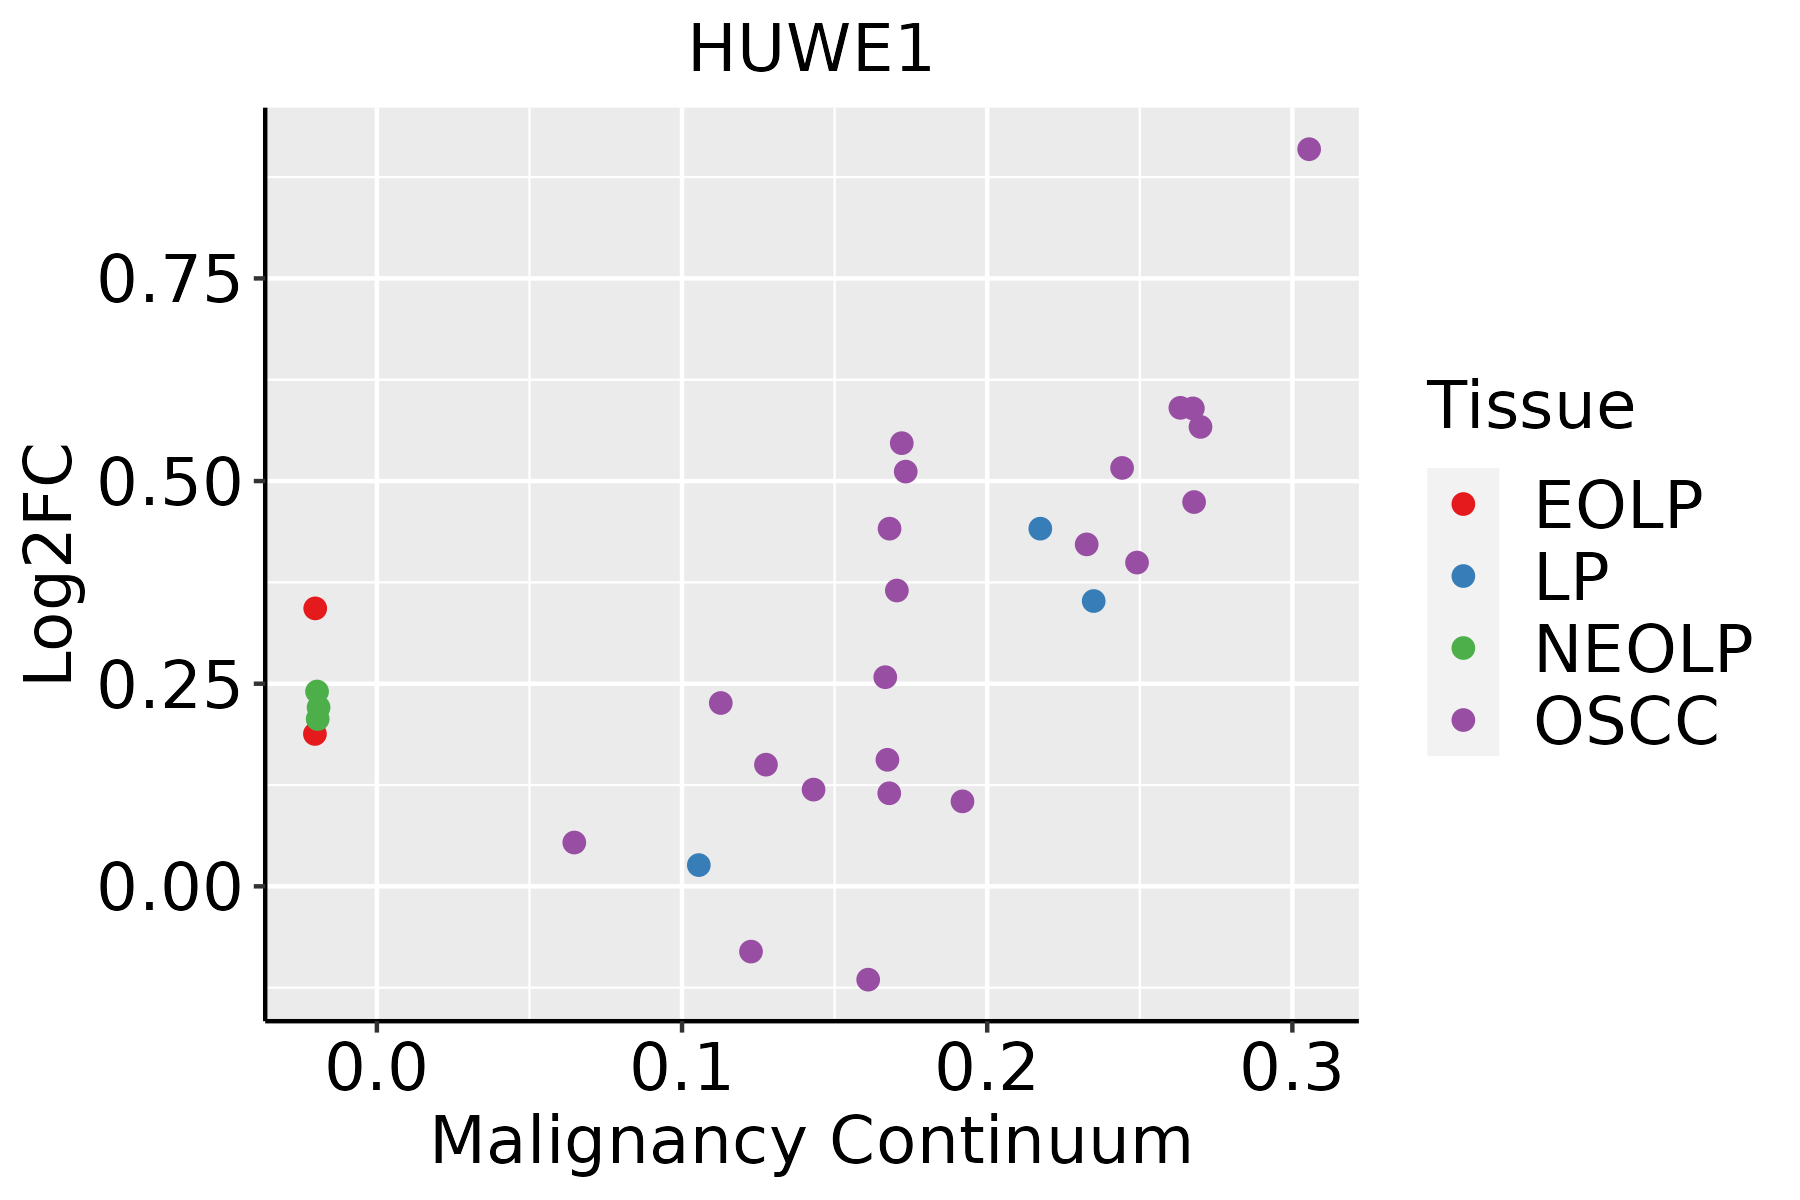 | EOLP: Erosive Oral lichen planus |
| LP: leukoplakia |
| NEOLP: Non-erosive oral lichen planus |
| OSCC: Oral squamous cell carcinoma |
| Prostate | 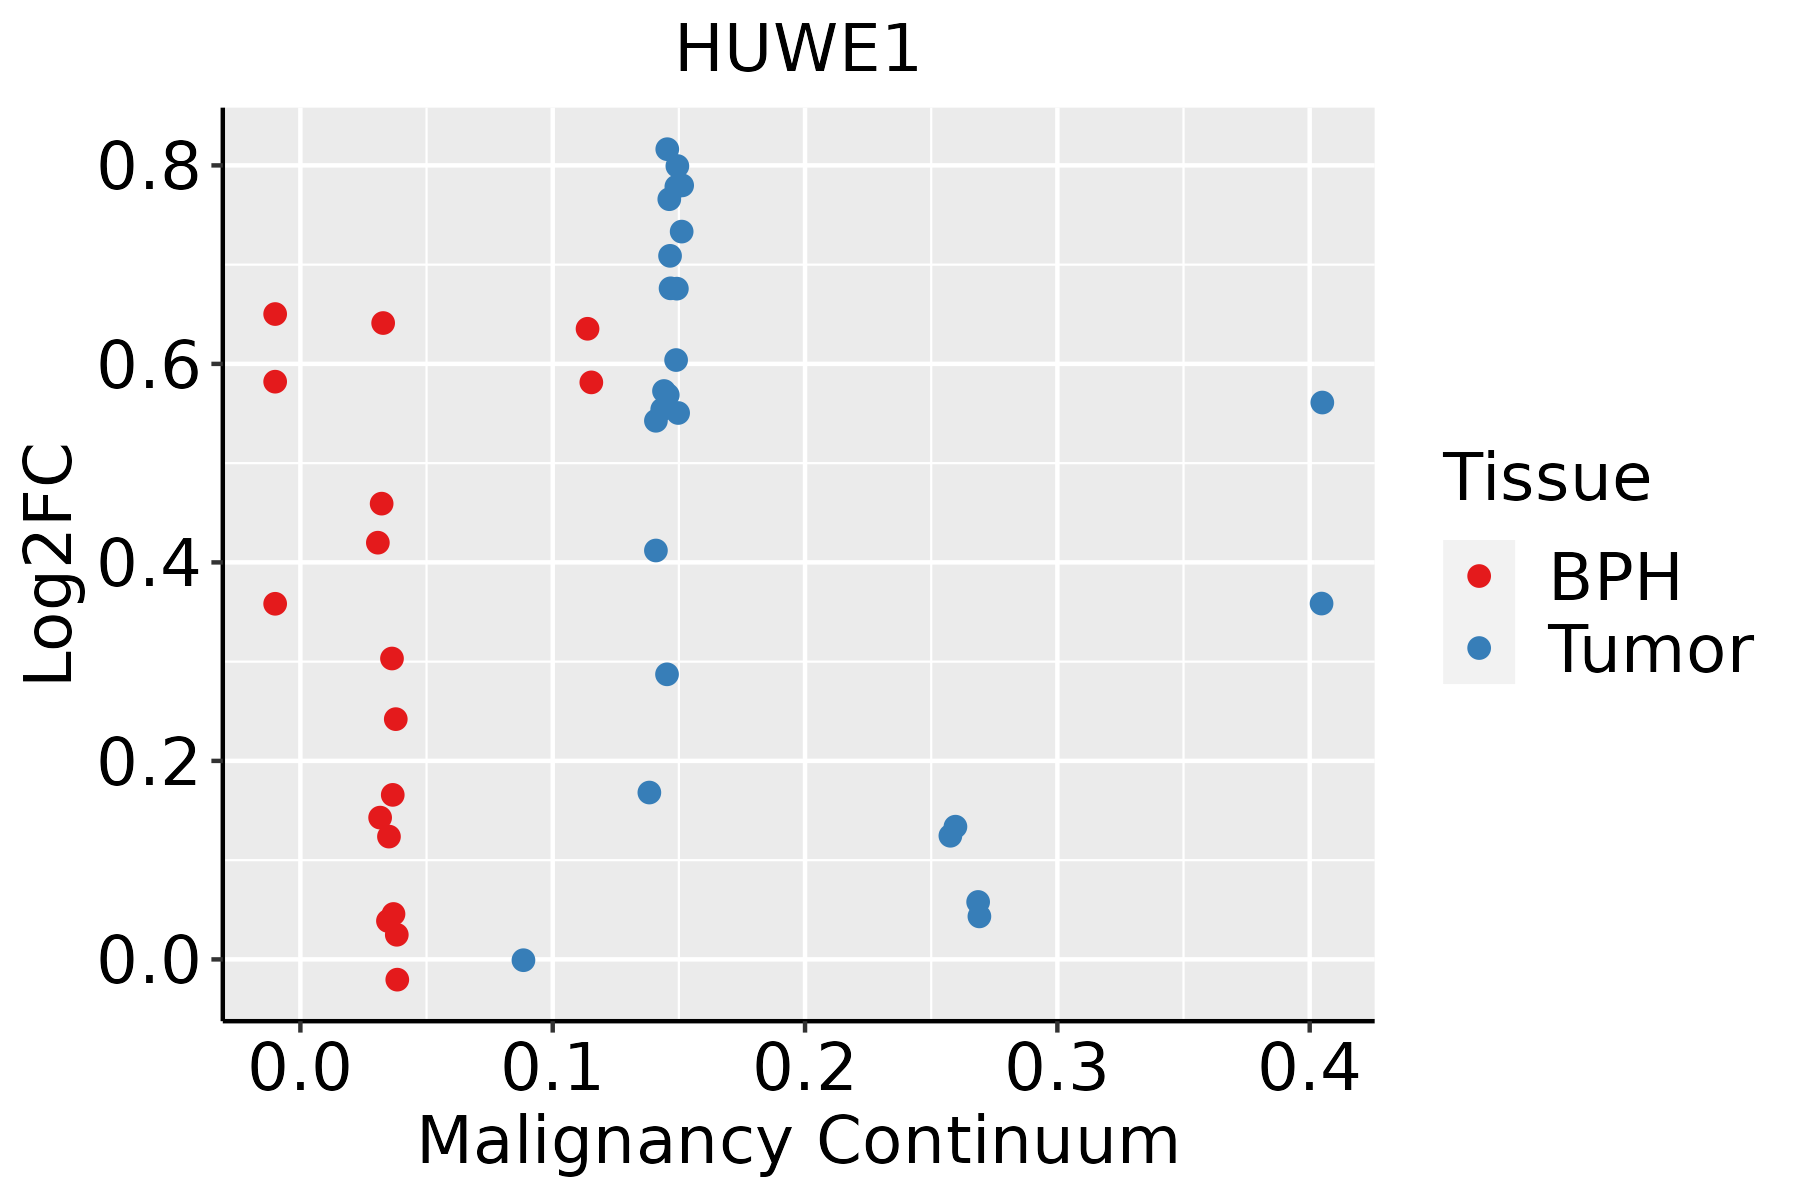 | BPH: Benign Prostatic Hyperplasia |
| Skin | 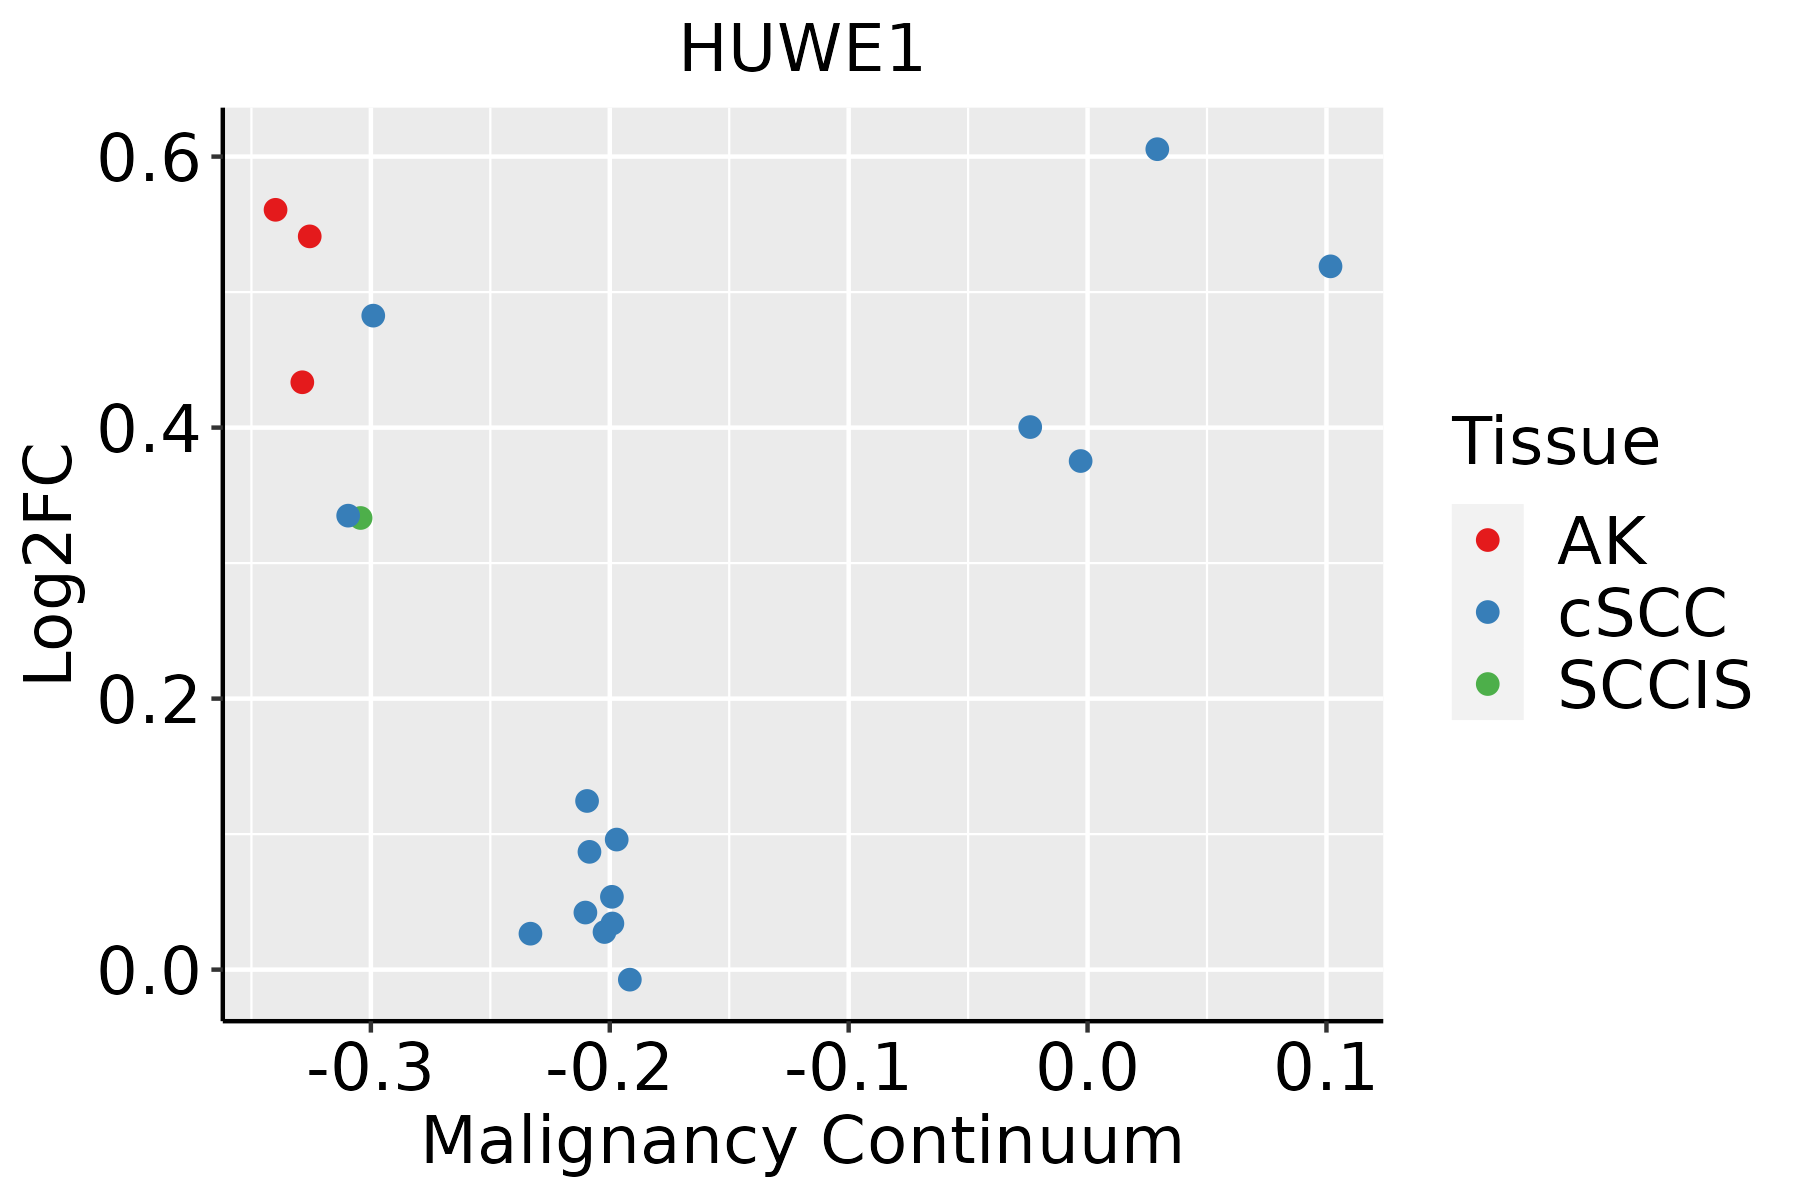 | AK: Actinic keratosis |
| cSCC: Cutaneous squamous cell carcinoma |
| SCCIS:squamous cell carcinoma in situ |
| Thyroid | 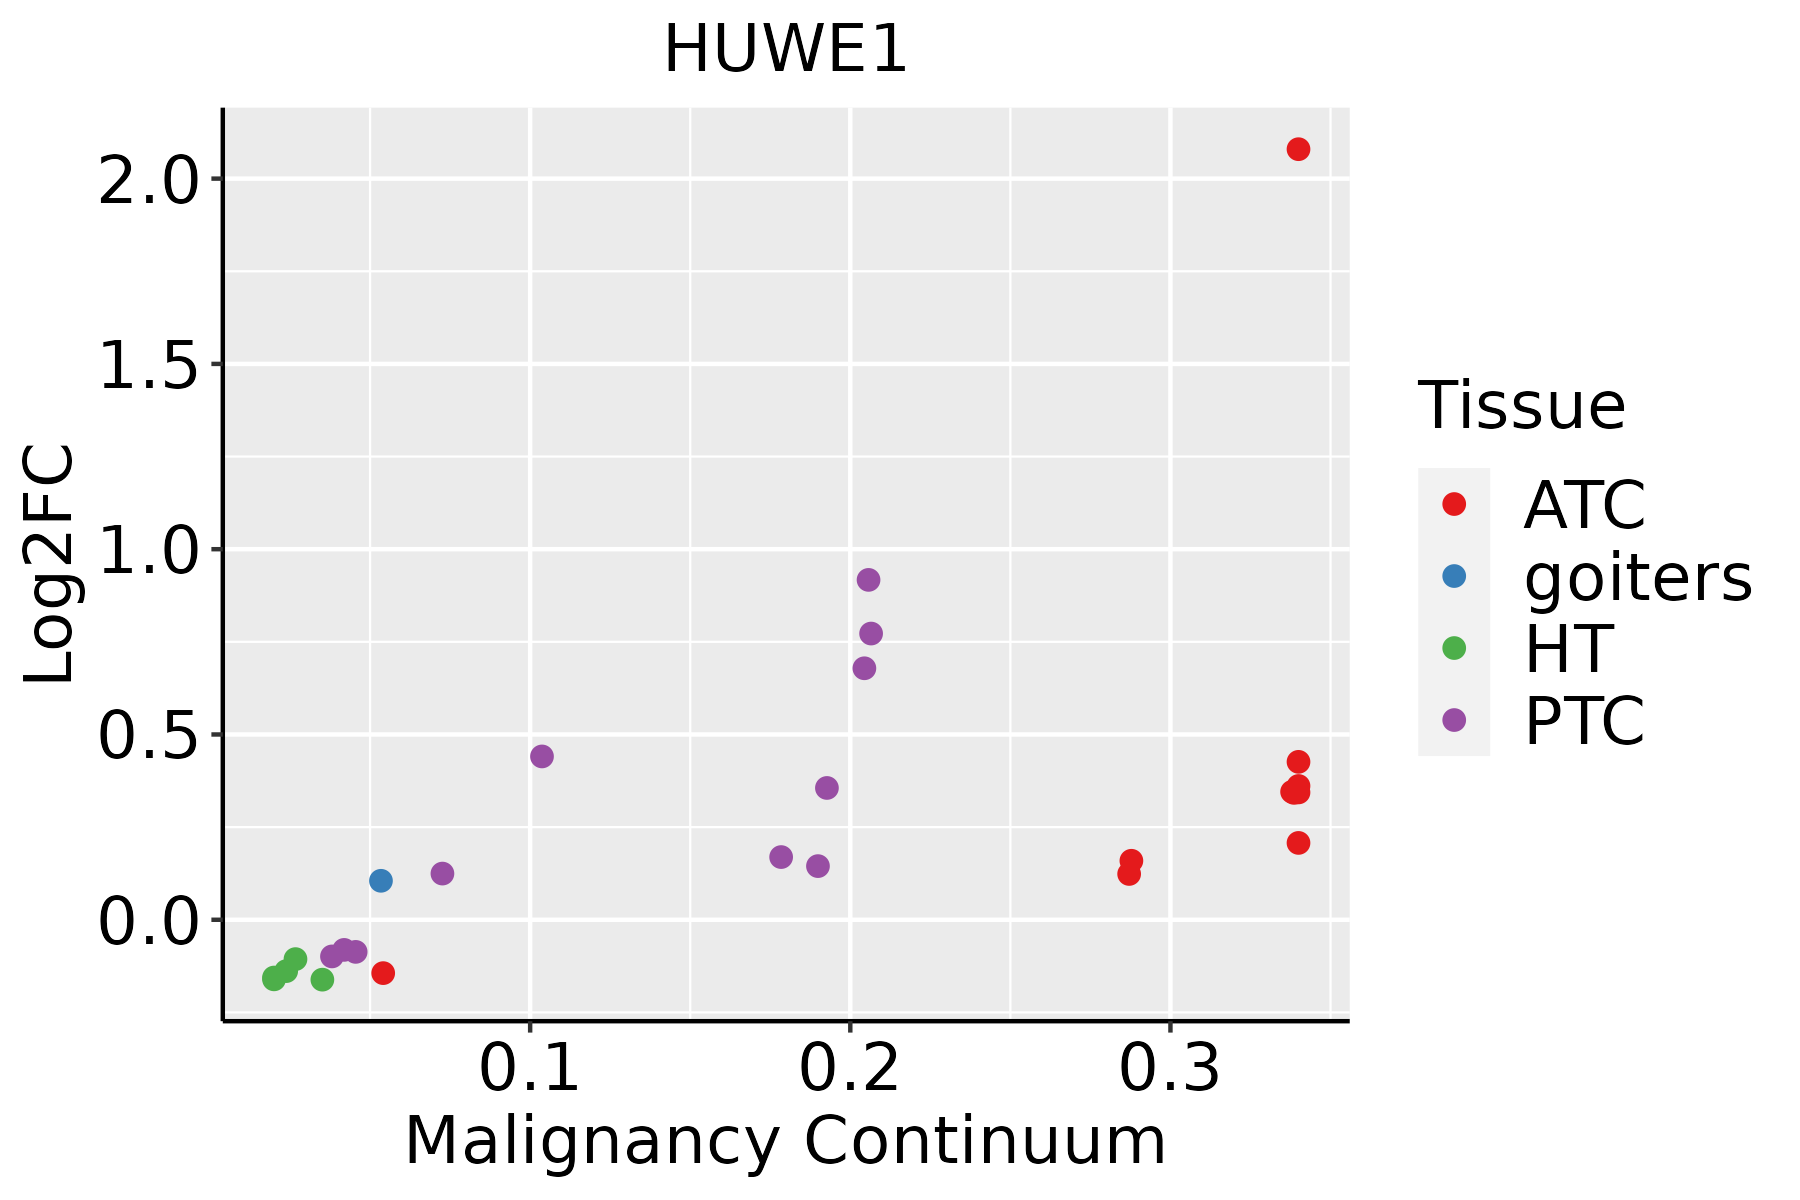 | ATC: Anaplastic thyroid cancer |
| HT: Hashimoto's thyroiditis |
| PTC: Papillary thyroid cancer |
| GO ID | Tissue | Disease Stage | Description | Gene Ratio | Bg Ratio | pvalue | p.adjust | Count |
| GO:19030089 | Esophagus | HGIN | organelle disassembly | 36/2587 | 114/18723 | 8.60e-07 | 3.58e-05 | 36 |
| GO:003238617 | Esophagus | HGIN | regulation of intracellular transport | 79/2587 | 337/18723 | 1.11e-06 | 4.36e-05 | 79 |
| GO:001082119 | Esophagus | HGIN | regulation of mitochondrion organization | 42/2587 | 144/18723 | 1.20e-06 | 4.68e-05 | 42 |
| GO:003315720 | Esophagus | HGIN | regulation of intracellular protein transport | 58/2587 | 229/18723 | 2.29e-06 | 8.29e-05 | 58 |
| GO:001063920 | Esophagus | HGIN | negative regulation of organelle organization | 79/2587 | 348/18723 | 4.12e-06 | 1.37e-04 | 79 |
| GO:000020916 | Esophagus | HGIN | protein polyubiquitination | 58/2587 | 236/18723 | 6.29e-06 | 1.97e-04 | 58 |
| GO:190495120 | Esophagus | HGIN | positive regulation of establishment of protein localization | 73/2587 | 319/18723 | 6.99e-06 | 2.14e-04 | 73 |
| GO:003238820 | Esophagus | HGIN | positive regulation of intracellular transport | 51/2587 | 202/18723 | 1.00e-05 | 2.92e-04 | 51 |
| GO:009031616 | Esophagus | HGIN | positive regulation of intracellular protein transport | 42/2587 | 160/18723 | 2.18e-05 | 5.78e-04 | 42 |
| GO:005122220 | Esophagus | HGIN | positive regulation of protein transport | 67/2587 | 303/18723 | 5.13e-05 | 1.22e-03 | 67 |
| GO:000042216 | Esophagus | HGIN | autophagy of mitochondrion | 25/2587 | 81/18723 | 5.95e-05 | 1.38e-03 | 25 |
| GO:006172616 | Esophagus | HGIN | mitochondrion disassembly | 25/2587 | 81/18723 | 5.95e-05 | 1.38e-03 | 25 |
| GO:00165708 | Esophagus | HGIN | histone modification | 92/2587 | 463/18723 | 1.70e-04 | 3.30e-03 | 92 |
| GO:19033228 | Esophagus | HGIN | positive regulation of protein modification by small protein conjugation or removal | 35/2587 | 138/18723 | 2.11e-04 | 3.88e-03 | 35 |
| GO:00165747 | Esophagus | HGIN | histone ubiquitination | 16/2587 | 47/18723 | 3.61e-04 | 5.68e-03 | 16 |
| GO:003292210 | Esophagus | HGIN | circadian regulation of gene expression | 20/2587 | 68/18723 | 6.35e-04 | 8.73e-03 | 20 |
| GO:19035338 | Esophagus | HGIN | regulation of protein targeting | 22/2587 | 81/18723 | 1.14e-03 | 1.39e-02 | 22 |
| GO:000762318 | Esophagus | HGIN | circadian rhythm | 45/2587 | 210/18723 | 1.60e-03 | 1.79e-02 | 45 |
| GO:00619128 | Esophagus | HGIN | selective autophagy | 19/2587 | 68/18723 | 1.68e-03 | 1.85e-02 | 19 |
| GO:19032148 | Esophagus | HGIN | regulation of protein targeting to mitochondrion | 14/2587 | 44/18723 | 1.75e-03 | 1.90e-02 | 14 |
| Pathway ID | Tissue | Disease Stage | Description | Gene Ratio | Bg Ratio | pvalue | p.adjust | qvalue | Count |
| hsa0412014 | Cervix | CC | Ubiquitin mediated proteolysis | 49/1267 | 142/8465 | 4.26e-09 | 7.68e-08 | 4.54e-08 | 49 |
| hsa0412015 | Cervix | CC | Ubiquitin mediated proteolysis | 49/1267 | 142/8465 | 4.26e-09 | 7.68e-08 | 4.54e-08 | 49 |
| hsa0412016 | Endometrium | AEH | Ubiquitin mediated proteolysis | 41/1197 | 142/8465 | 3.42e-06 | 4.27e-05 | 3.13e-05 | 41 |
| hsa0412017 | Endometrium | AEH | Ubiquitin mediated proteolysis | 41/1197 | 142/8465 | 3.42e-06 | 4.27e-05 | 3.13e-05 | 41 |
| hsa0412023 | Endometrium | EEC | Ubiquitin mediated proteolysis | 41/1237 | 142/8465 | 7.86e-06 | 9.58e-05 | 7.14e-05 | 41 |
| hsa0412033 | Endometrium | EEC | Ubiquitin mediated proteolysis | 41/1237 | 142/8465 | 7.86e-06 | 9.58e-05 | 7.14e-05 | 41 |
| hsa0412026 | Esophagus | HGIN | Ubiquitin mediated proteolysis | 49/1383 | 142/8465 | 7.78e-08 | 1.33e-06 | 1.06e-06 | 49 |
| hsa04120111 | Esophagus | HGIN | Ubiquitin mediated proteolysis | 49/1383 | 142/8465 | 7.78e-08 | 1.33e-06 | 1.06e-06 | 49 |
| hsa0412027 | Esophagus | ESCC | Ubiquitin mediated proteolysis | 122/4205 | 142/8465 | 6.53e-20 | 7.29e-18 | 3.74e-18 | 122 |
| hsa0412036 | Esophagus | ESCC | Ubiquitin mediated proteolysis | 122/4205 | 142/8465 | 6.53e-20 | 7.29e-18 | 3.74e-18 | 122 |
| hsa0412010 | Liver | NAFLD | Ubiquitin mediated proteolysis | 44/1043 | 142/8465 | 2.59e-09 | 1.70e-07 | 1.37e-07 | 44 |
| hsa0412011 | Liver | NAFLD | Ubiquitin mediated proteolysis | 44/1043 | 142/8465 | 2.59e-09 | 1.70e-07 | 1.37e-07 | 44 |
| hsa0412021 | Liver | Cirrhotic | Ubiquitin mediated proteolysis | 72/2530 | 142/8465 | 1.32e-07 | 1.97e-06 | 1.21e-06 | 72 |
| hsa0412031 | Liver | Cirrhotic | Ubiquitin mediated proteolysis | 72/2530 | 142/8465 | 1.32e-07 | 1.97e-06 | 1.21e-06 | 72 |
| hsa0412041 | Liver | HCC | Ubiquitin mediated proteolysis | 110/4020 | 142/8465 | 1.67e-13 | 3.74e-12 | 2.08e-12 | 110 |
| hsa0412051 | Liver | HCC | Ubiquitin mediated proteolysis | 110/4020 | 142/8465 | 1.67e-13 | 3.74e-12 | 2.08e-12 | 110 |
| hsa0412012 | Lung | IAC | Ubiquitin mediated proteolysis | 40/1053 | 142/8465 | 3.24e-07 | 1.76e-05 | 1.17e-05 | 40 |
| hsa0412013 | Lung | IAC | Ubiquitin mediated proteolysis | 40/1053 | 142/8465 | 3.24e-07 | 1.76e-05 | 1.17e-05 | 40 |
| hsa0412022 | Lung | AIS | Ubiquitin mediated proteolysis | 41/961 | 142/8465 | 8.01e-09 | 4.33e-07 | 2.77e-07 | 41 |
| hsa0412032 | Lung | AIS | Ubiquitin mediated proteolysis | 41/961 | 142/8465 | 8.01e-09 | 4.33e-07 | 2.77e-07 | 41 |
| Hugo Symbol | Variant Class | Variant Classification | dbSNP RS | HGVSc | HGVSp | HGVSp Short | SWISSPROT | BIOTYPE | SIFT | PolyPhen | Tumor Sample Barcode | Tissue | Histology | Sex | Age | Stage | Therapy Types | Drugs | Outcome |
| HUWE1 | SNV | Missense_Mutation | novel | c.9365N>T | p.Ser3122Phe | p.S3122F | Q7Z6Z7 | protein_coding | deleterious(0) | probably_damaging(0.974) | TCGA-3C-AALI-01 | Breast | breast invasive carcinoma | Female | <65 | I/II | Unspecific | Poly E | Complete Response |
| HUWE1 | SNV | Missense_Mutation | novel | c.2665N>A | p.Ala889Thr | p.A889T | Q7Z6Z7 | protein_coding | tolerated(0.24) | benign(0.014) | TCGA-3C-AALK-01 | Breast | breast invasive carcinoma | Female | <65 | I/II | Chemotherapy | docetaxel | SD |
| HUWE1 | SNV | Missense_Mutation | | c.9521N>A | p.Arg3174His | p.R3174H | Q7Z6Z7 | protein_coding | deleterious(0.01) | probably_damaging(0.976) | TCGA-4H-AAAK-01 | Breast | breast invasive carcinoma | Female | <65 | III/IV | Chemotherapy | cyclophosphamide | CR |
| HUWE1 | SNV | Missense_Mutation | | c.2644N>A | p.Asp882Asn | p.D882N | Q7Z6Z7 | protein_coding | tolerated(0.2) | benign(0.003) | TCGA-A1-A0SO-01 | Breast | breast invasive carcinoma | Female | >=65 | I/II | Chemotherapy | | SD |
| HUWE1 | SNV | Missense_Mutation | novel | c.10606N>C | p.Thr3536Pro | p.T3536P | Q7Z6Z7 | protein_coding | tolerated(0.27) | benign(0.044) | TCGA-A2-A0D0-01 | Breast | breast invasive carcinoma | Female | <65 | I/II | Chemotherapy | cytoxan | SD |
| HUWE1 | SNV | Missense_Mutation | | c.11357N>A | p.Arg3786Gln | p.R3786Q | Q7Z6Z7 | protein_coding | tolerated(0.24) | benign(0.039) | TCGA-A2-A0ER-01 | Breast | breast invasive carcinoma | Female | <65 | I/II | Chemotherapy | cytoxan | SD |
| HUWE1 | SNV | Missense_Mutation | | c.1583N>C | p.Ile528Thr | p.I528T | Q7Z6Z7 | protein_coding | deleterious(0) | possibly_damaging(0.892) | TCGA-A2-A1FW-01 | Breast | breast invasive carcinoma | Female | <65 | III/IV | Chemotherapy | cytoxan | SD |
| HUWE1 | SNV | Missense_Mutation | rs782714213 | c.9964N>A | p.Val3322Ile | p.V3322I | Q7Z6Z7 | protein_coding | tolerated(0.39) | possibly_damaging(0.854) | TCGA-A2-A3XT-01 | Breast | breast invasive carcinoma | Female | <65 | I/II | Chemotherapy | cyclophosphamide | PR |
| HUWE1 | SNV | Missense_Mutation | rs398124423 | c.12671N>T | p.Ala4224Val | p.A4224V | Q7Z6Z7 | protein_coding | tolerated(0.1) | possibly_damaging(0.688) | TCGA-A2-A3XY-01 | Breast | breast invasive carcinoma | Female | <65 | I/II | Chemotherapy | adriamycin | PD |
| HUWE1 | SNV | Missense_Mutation | rs782477771 | c.6008C>T | p.Thr2003Met | p.T2003M | Q7Z6Z7 | protein_coding | deleterious_low_confidence(0.02) | benign(0.197) | TCGA-A7-A3J1-01 | Breast | breast invasive carcinoma | Female | <65 | I/II | Hormone Therapy | anastrazole | SD |


