Schematic overview of the cellular and molecular mechanisms involved in the cancer progression, including the proposed cellular and molecular mechanisms in cancer cells trajectory. AT1: alveolar type 1 cells; AT2: alveolar type 2 cells; AAH: atypical adenomatous hyperplasia; AIS: adenocarcinoma in situ; MIA: minimally invasive adenocarcinoma; IA: invasive adenocarcinoma; EMT: epithelial-mesenchymal transition

Home

Download

Statistics

Help

Contact

Center for Computational Systems Medicine
leaf

Gene summary

leaf

Malignant transformation analysis

leaf

Malignant transformation related pathway analysis

leaf

Cell-cell communication analysis

leaf

Single-cell gene regulatory network inference analysis

leaf

Somatic mutation of malignant transformation related genes

leaf

Related drugs of malignant transformation related genes

Gene: HOOK2

Gene summary for HOOK2

check button Gene summary.

Gene informationSpeciesHuman
Gene symbol

HOOK2

Gene ID

29911

Gene namehook microtubule tethering protein 2
Gene AliasHK2
Cytomap19p13.13
Gene Typeprotein-coding
GO ID

GO:0000226

UniProtAcc

Q96ED9


Top

Malignant transformation analysis

check button Identification of the aberrant gene expression in precancerous and cancerous lesions by comparing the gene expression of stem-like cells in diseased tissues with normal stem cells
check button Malignant transformation involving gene list.
Entrez IDSymbolReplicatesSpeciesOrganTissueAdj P-valueLog2FCMalignancy
29911HOOK2HTA11_3410_2000001011HumanColorectumAD8.37e-031.54e-010.0155
29911HOOK2HTA11_2487_2000001011HumanColorectumSER7.15e-077.29e-01-0.1808
29911HOOK2HTA11_1938_2000001011HumanColorectumAD2.71e-096.50e-01-0.0811
29911HOOK2HTA11_78_2000001011HumanColorectumAD1.25e-045.02e-01-0.1088
29911HOOK2HTA11_347_2000001011HumanColorectumAD1.09e-237.45e-01-0.1954
29911HOOK2HTA11_3361_2000001011HumanColorectumAD2.81e-044.71e-01-0.1207
29911HOOK2HTA11_83_2000001011HumanColorectumSER5.86e-086.78e-01-0.1526
29911HOOK2HTA11_696_2000001011HumanColorectumAD4.59e-157.30e-01-0.1464
29911HOOK2HTA11_866_2000001011HumanColorectumAD2.67e-105.50e-01-0.1001
29911HOOK2HTA11_1391_2000001011HumanColorectumAD3.01e-158.74e-01-0.059
29911HOOK2HTA11_546_2000001011HumanColorectumAD3.04e-035.97e-01-0.0842
29911HOOK2HTA11_866_3004761011HumanColorectumAD7.88e-207.05e-010.096
29911HOOK2HTA11_4255_2000001011HumanColorectumSER4.57e-026.36e-010.0446
29911HOOK2HTA11_8622_2000001021HumanColorectumSER3.72e-046.76e-010.0528
29911HOOK2HTA11_10623_2000001011HumanColorectumAD6.75e-035.69e-01-0.0177
29911HOOK2HTA11_10711_2000001011HumanColorectumAD2.35e-117.24e-010.0338
29911HOOK2HTA11_7696_3000711011HumanColorectumAD1.55e-269.64e-010.0674
29911HOOK2HTA11_6818_2000001011HumanColorectumAD4.93e-067.08e-010.0112
29911HOOK2HTA11_6818_2000001021HumanColorectumAD8.64e-096.81e-010.0588
29911HOOK2HTA11_99999970781_79442HumanColorectumMSS1.24e-189.62e-010.294
Page: 1 2 3 4 5 6 7 8 9 10 

check button Transcriptomic changes along malignancy continuum.
TissueExpression DynamicsAbbreviation
Colorectum (GSE201348)The image shows the transcriptomic changes along malignancy continuum.log2FC in expression of this searched gene in stem-like cells from each diseased tissue sample relative to stem-like cells in normal samples in each tissue plotted against the malignancy continuum. Samples are colored based on if they are from different disease stage.FAP: Familial adenomatous polyposis
CRC: Colorectal cancer
Colorectum (HTA11)The image shows the transcriptomic changes along malignancy continuum.log2FC in expression of this searched gene in stem-like cells from each diseased tissue sample relative to stem-like cells in normal samples in each tissue plotted against the malignancy continuum. Samples are colored based on if they are from different disease stage.AD: Adenomas
SER: Sessile serrated lesions
MSI-H: Microsatellite-high colorectal cancer
MSS: Microsatellite stable colorectal cancer
EsophagusThe image shows the transcriptomic changes along malignancy continuum.log2FC in expression of this searched gene in stem-like cells from each diseased tissue sample relative to stem-like cells in normal samples in each tissue plotted against the malignancy continuum. Samples are colored based on if they are from different disease stage.
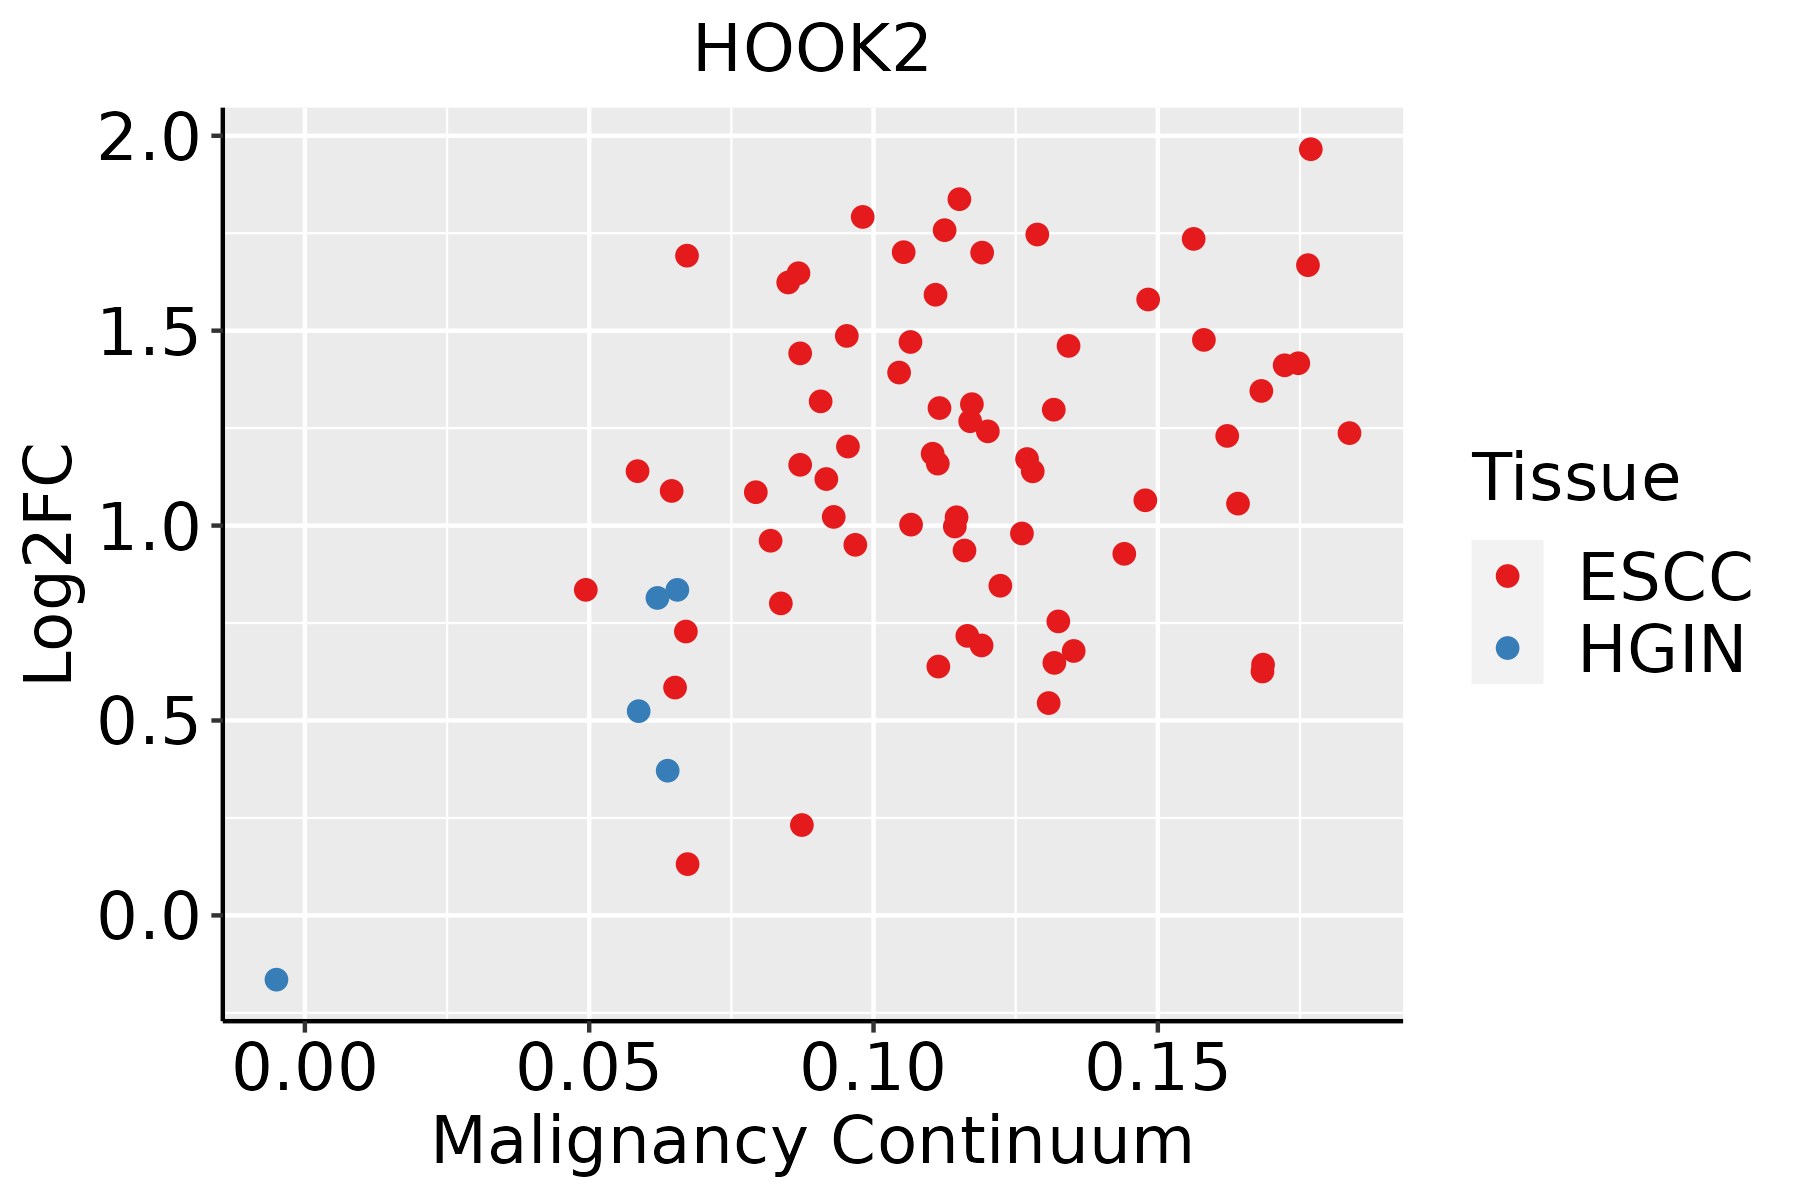
ESCC: Esophageal squamous cell carcinoma
HGIN: High-grade intraepithelial neoplasias
LGIN: Low-grade intraepithelial neoplasias
GCThe image shows the transcriptomic changes along malignancy continuum.log2FC in expression of this searched gene in stem-like cells from each diseased tissue sample relative to stem-like cells in normal samples in each tissue plotted against the malignancy continuum. Samples are colored based on if they are from different disease stage.
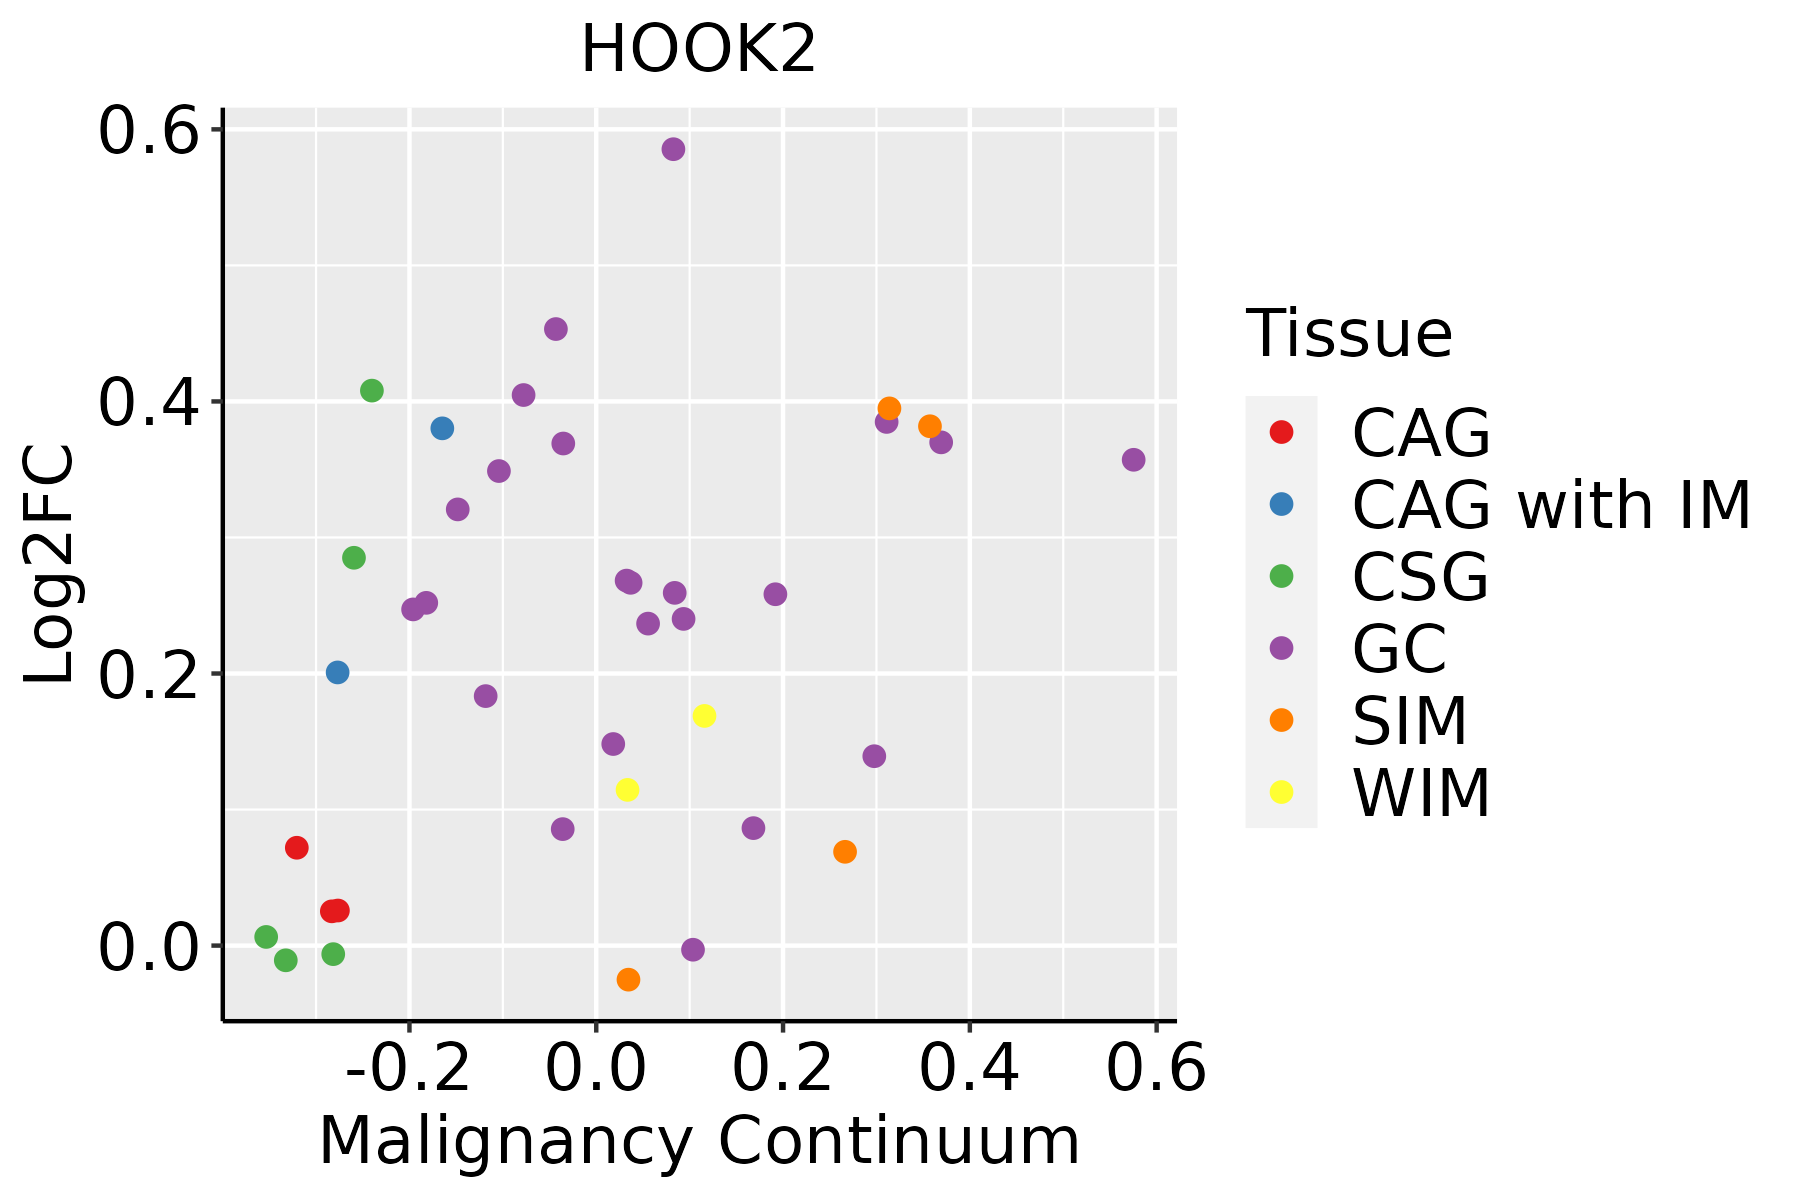
CAG: Chronic atrophic gastritis
CAG with IM: Chronic atrophic gastritis with intestinal metaplasia
CSG: Chronic superficial gastritis
GC: Gastric cancer
SIM: Severe intestinal metaplasia
WIM: Wild intestinal metaplasia
LungThe image shows the transcriptomic changes along malignancy continuum.log2FC in expression of this searched gene in stem-like cells from each diseased tissue sample relative to stem-like cells in normal samples in each tissue plotted against the malignancy continuum. Samples are colored based on if they are from different disease stage.
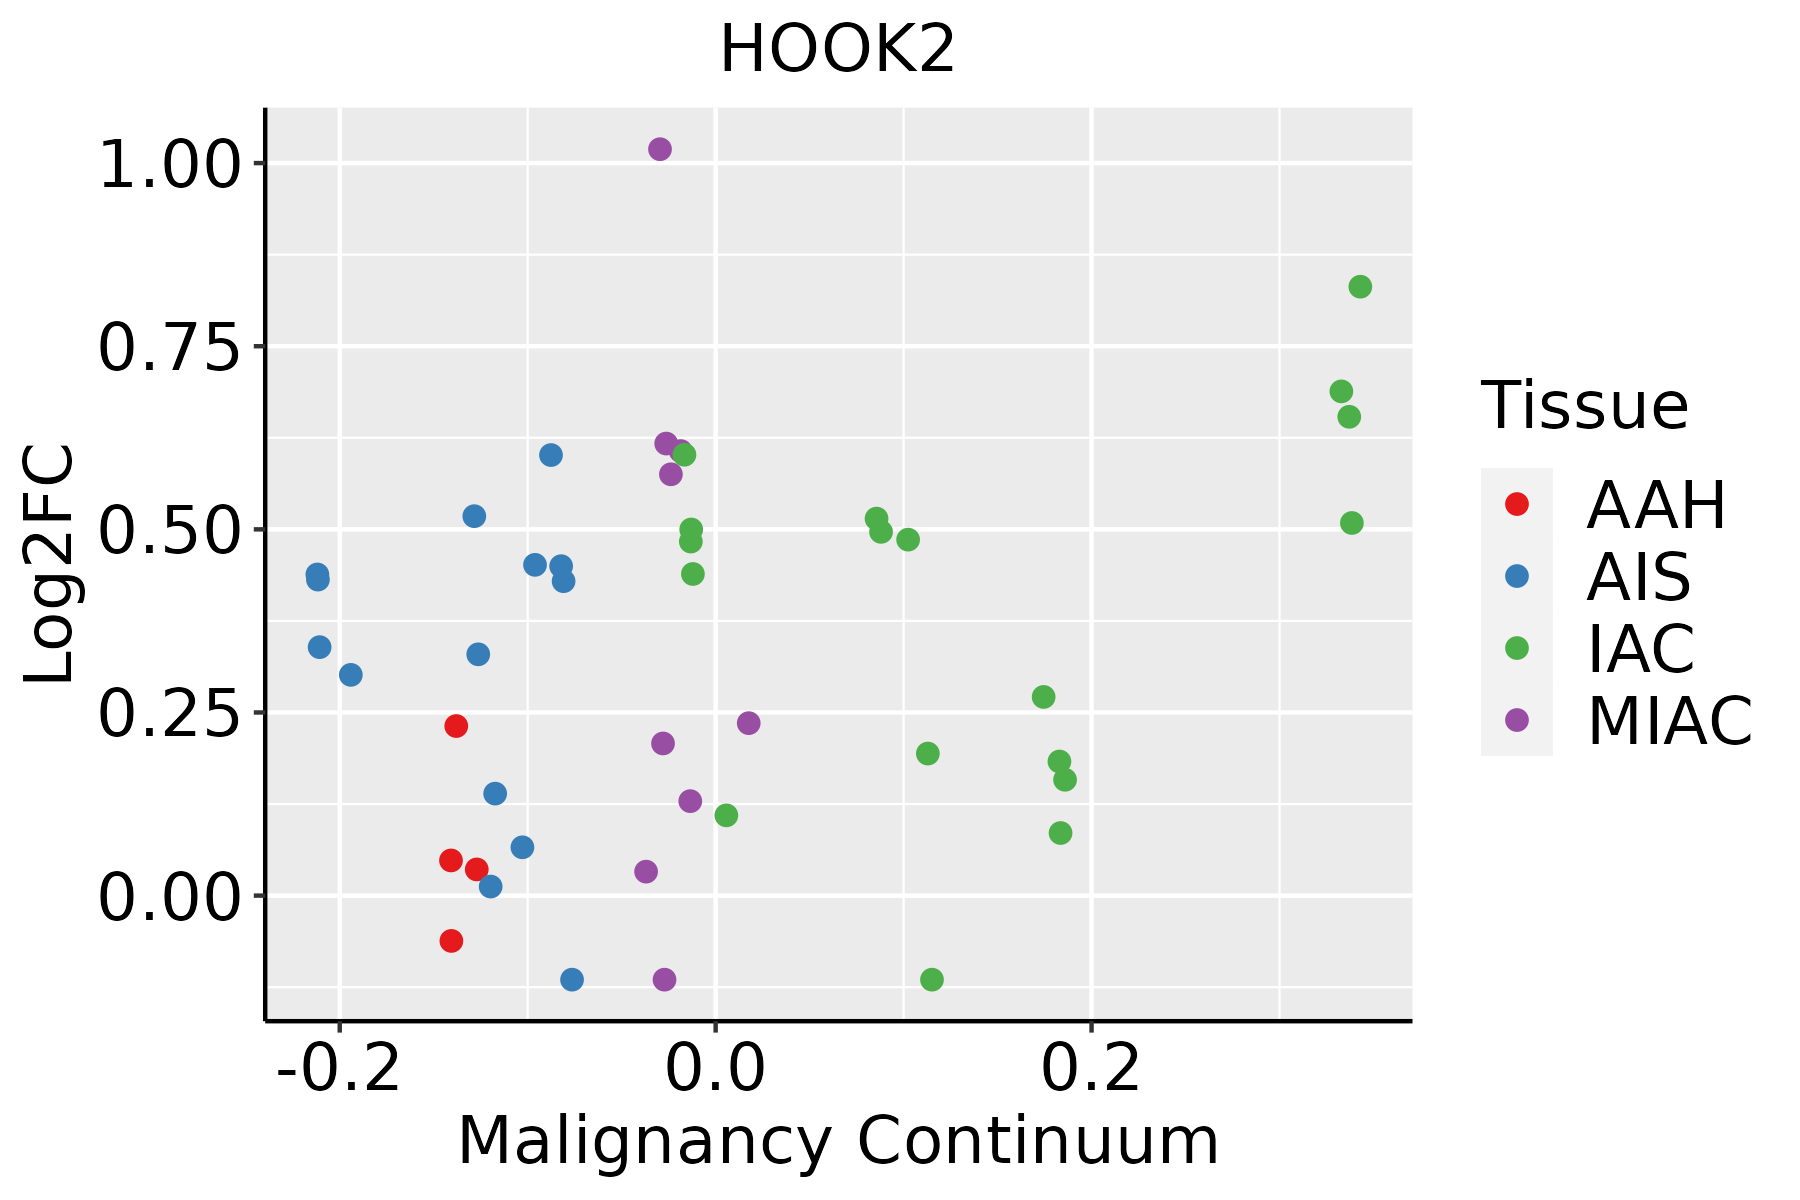
AAH: Atypical adenomatous hyperplasia
AIS: Adenocarcinoma in situ
IAC: Invasive lung adenocarcinoma
MIA: Minimally invasive adenocarcinoma
Oral CavityThe image shows the transcriptomic changes along malignancy continuum.log2FC in expression of this searched gene in stem-like cells from each diseased tissue sample relative to stem-like cells in normal samples in each tissue plotted against the malignancy continuum. Samples are colored based on if they are from different disease stage.
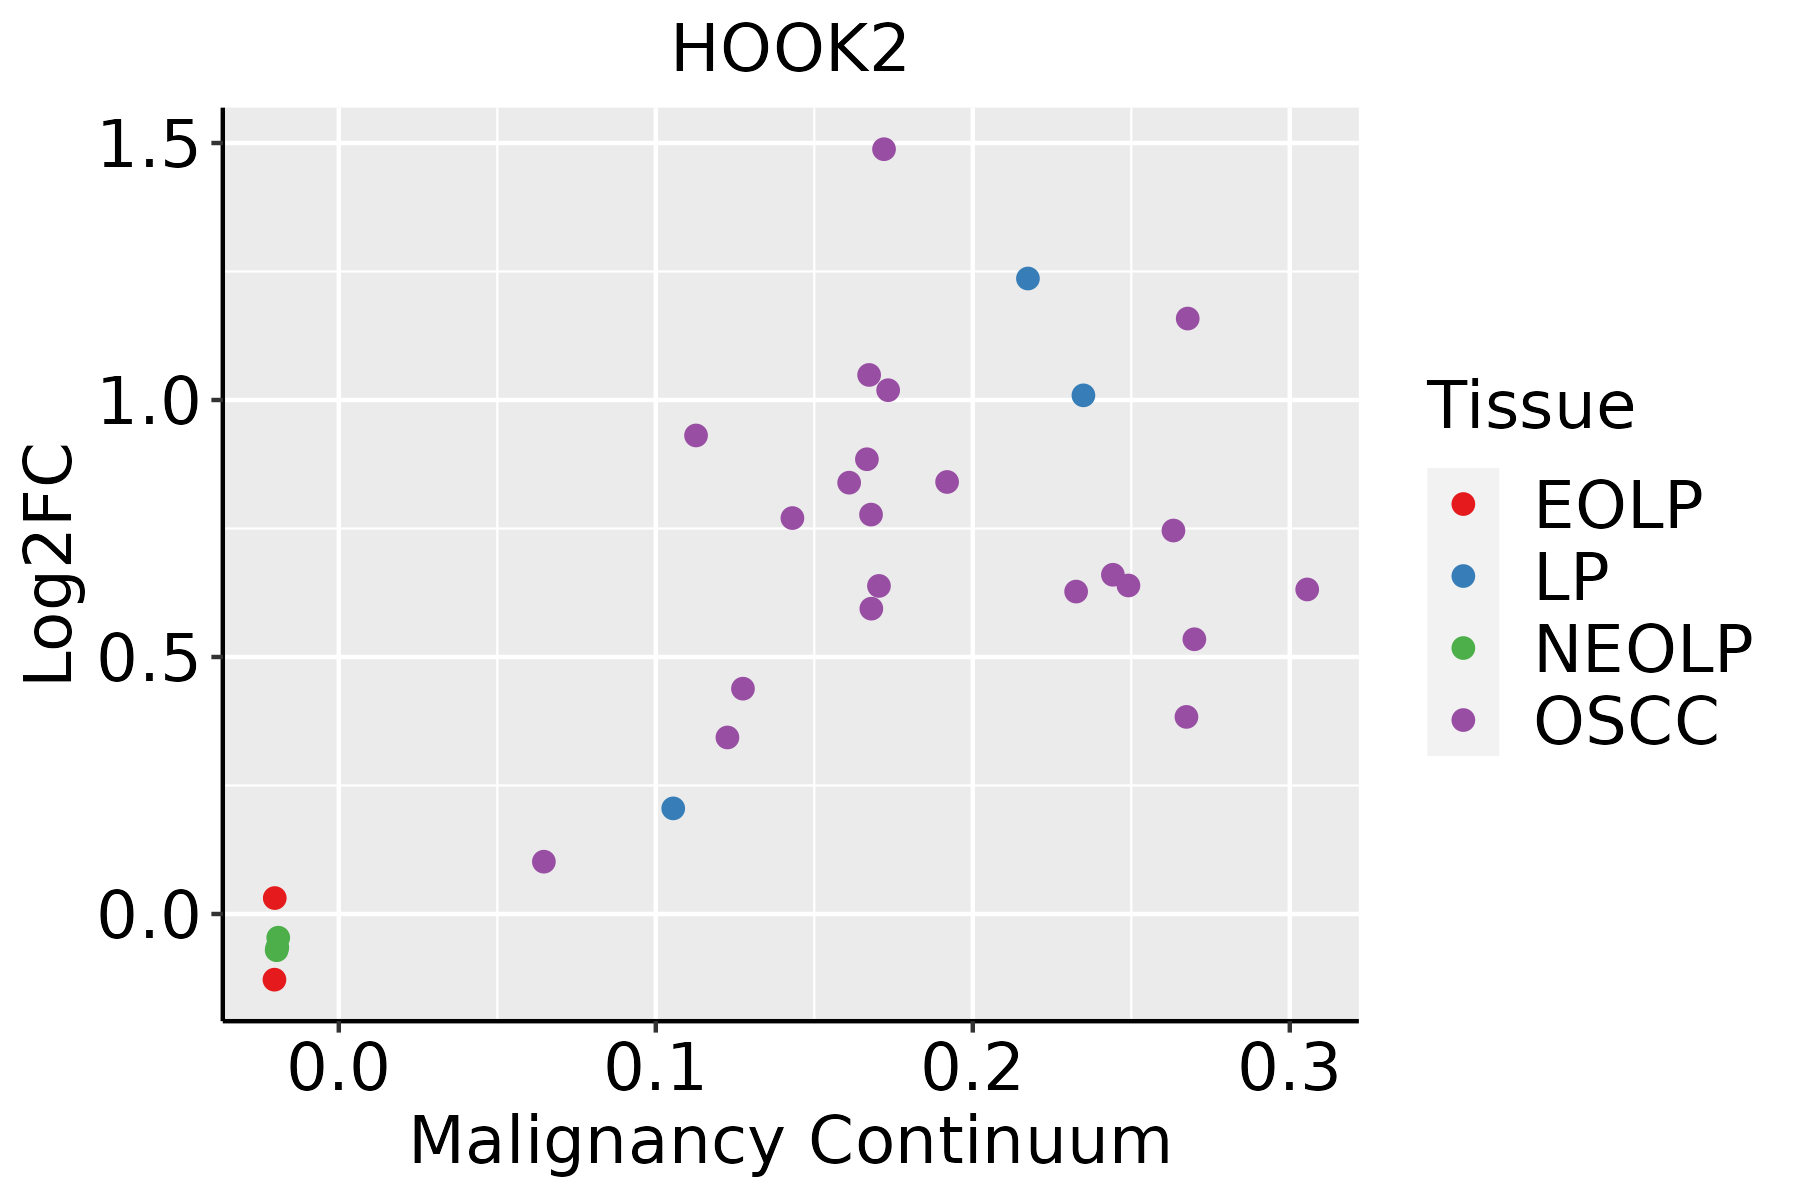
EOLP: Erosive Oral lichen planus
LP: leukoplakia
NEOLP: Non-erosive oral lichen planus
OSCC: Oral squamous cell carcinoma
ProstateThe image shows the transcriptomic changes along malignancy continuum.log2FC in expression of this searched gene in stem-like cells from each diseased tissue sample relative to stem-like cells in normal samples in each tissue plotted against the malignancy continuum. Samples are colored based on if they are from different disease stage.
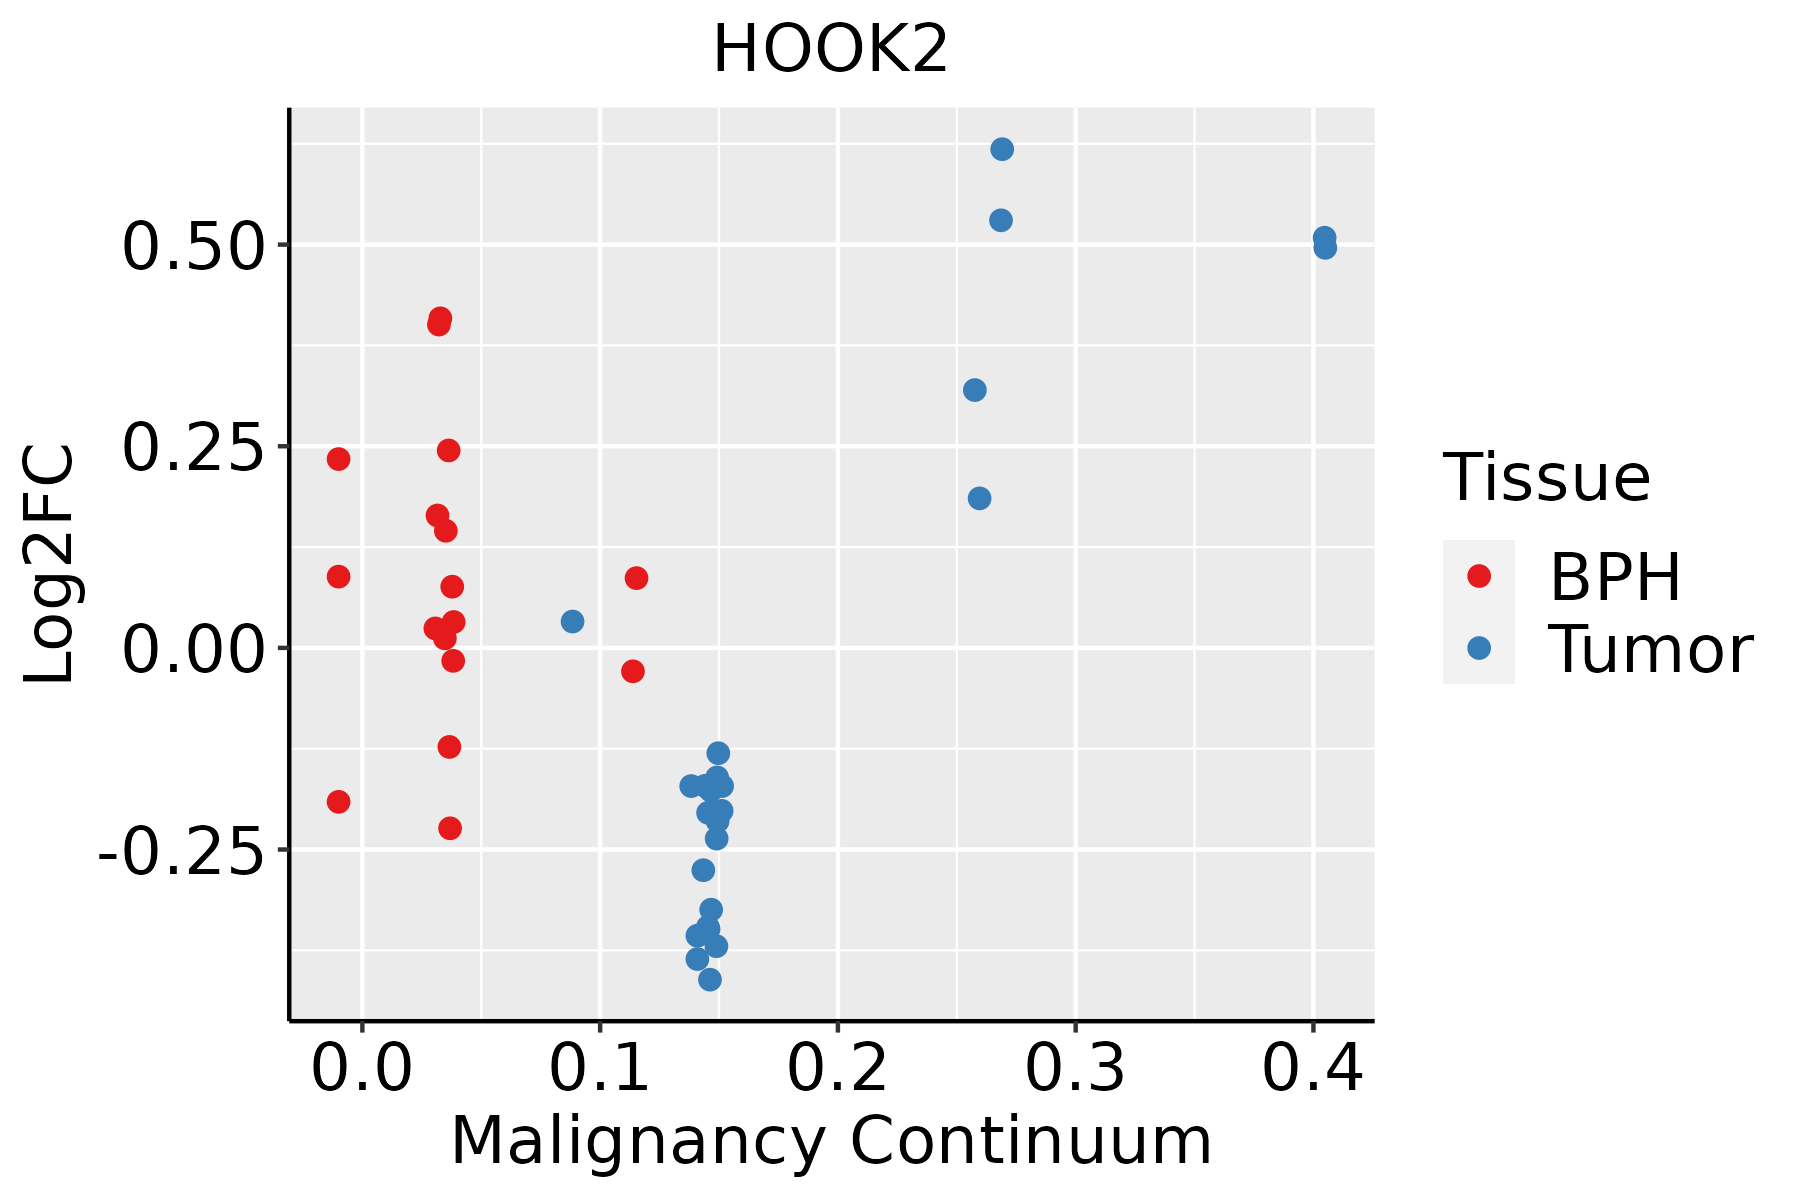
BPH: Benign Prostatic Hyperplasia
SkinThe image shows the transcriptomic changes along malignancy continuum.log2FC in expression of this searched gene in stem-like cells from each diseased tissue sample relative to stem-like cells in normal samples in each tissue plotted against the malignancy continuum. Samples are colored based on if they are from different disease stage.
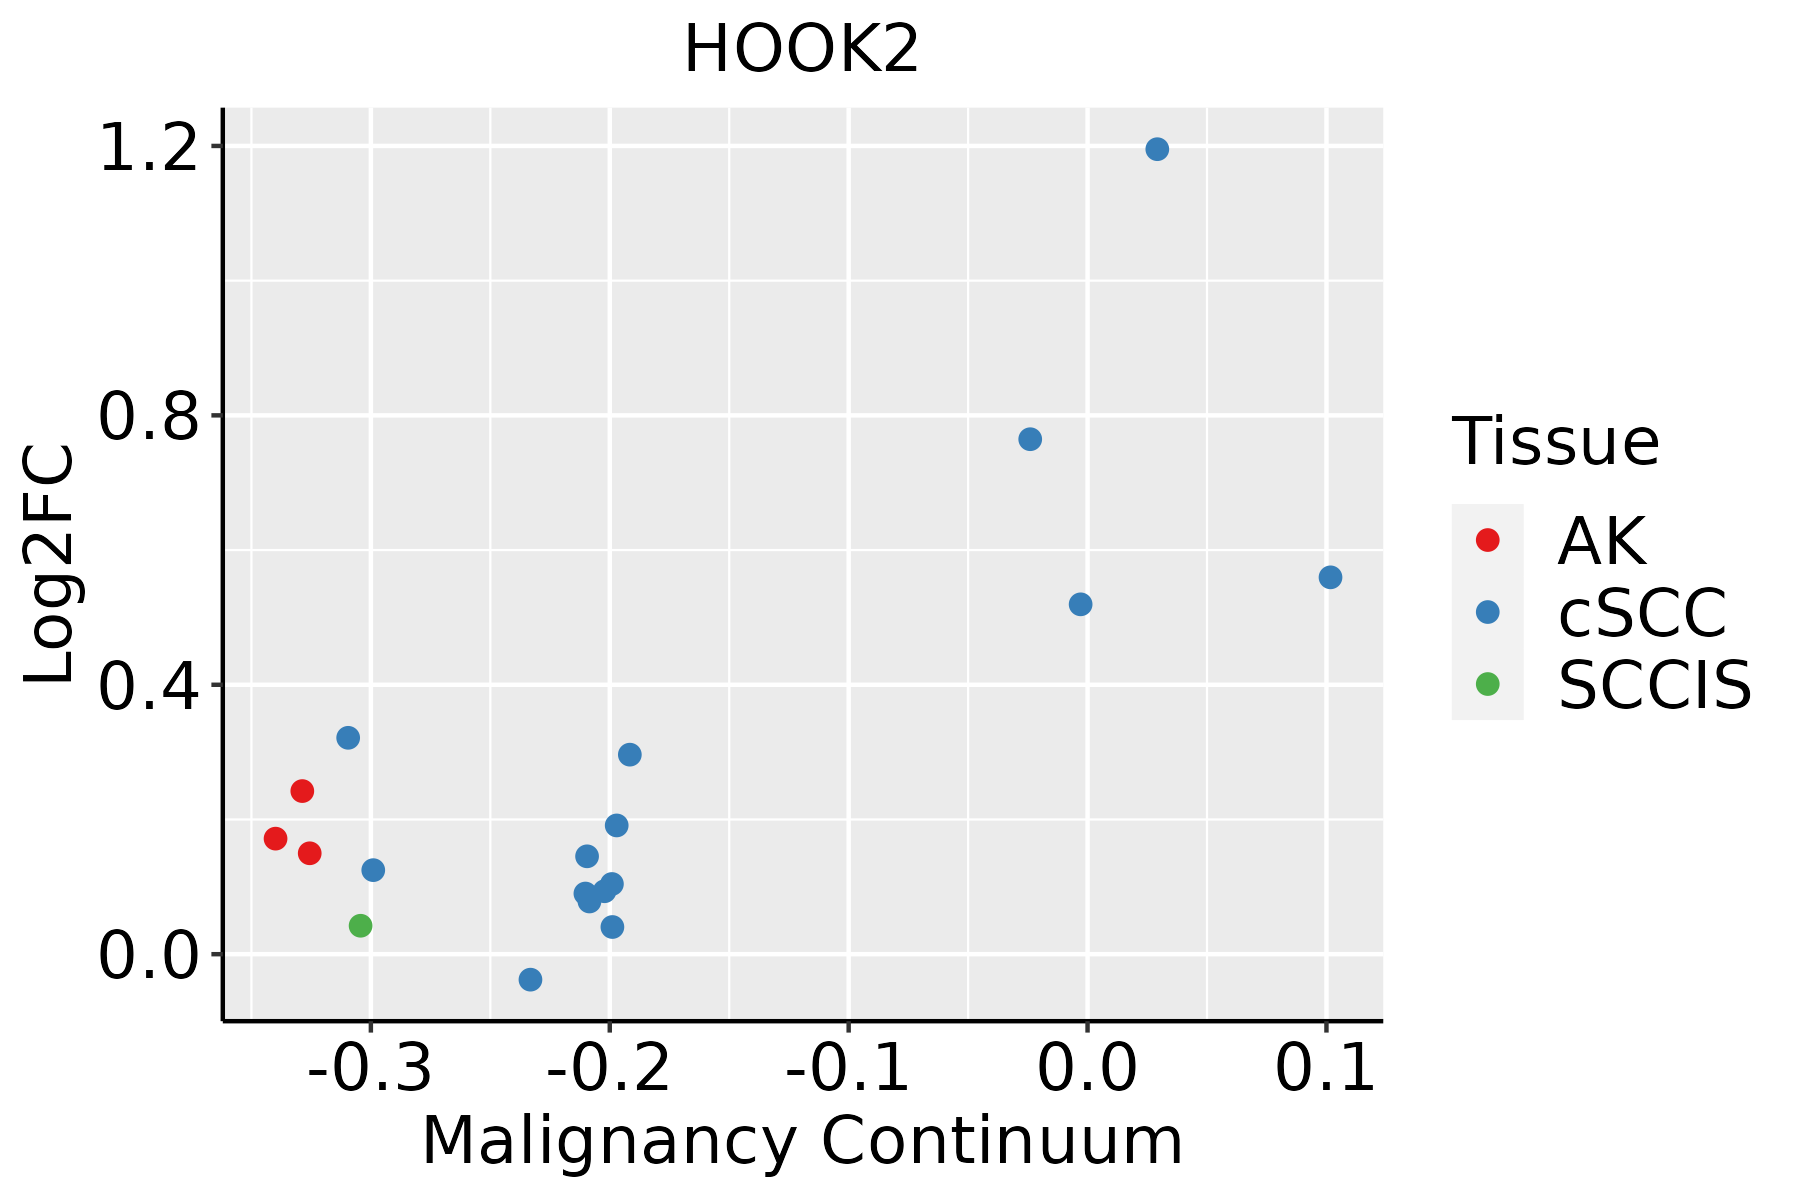
AK: Actinic keratosis
cSCC: Cutaneous squamous cell carcinoma
SCCIS:squamous cell carcinoma in situ
ThyroidThe image shows the transcriptomic changes along malignancy continuum.log2FC in expression of this searched gene in stem-like cells from each diseased tissue sample relative to stem-like cells in normal samples in each tissue plotted against the malignancy continuum. Samples are colored based on if they are from different disease stage.
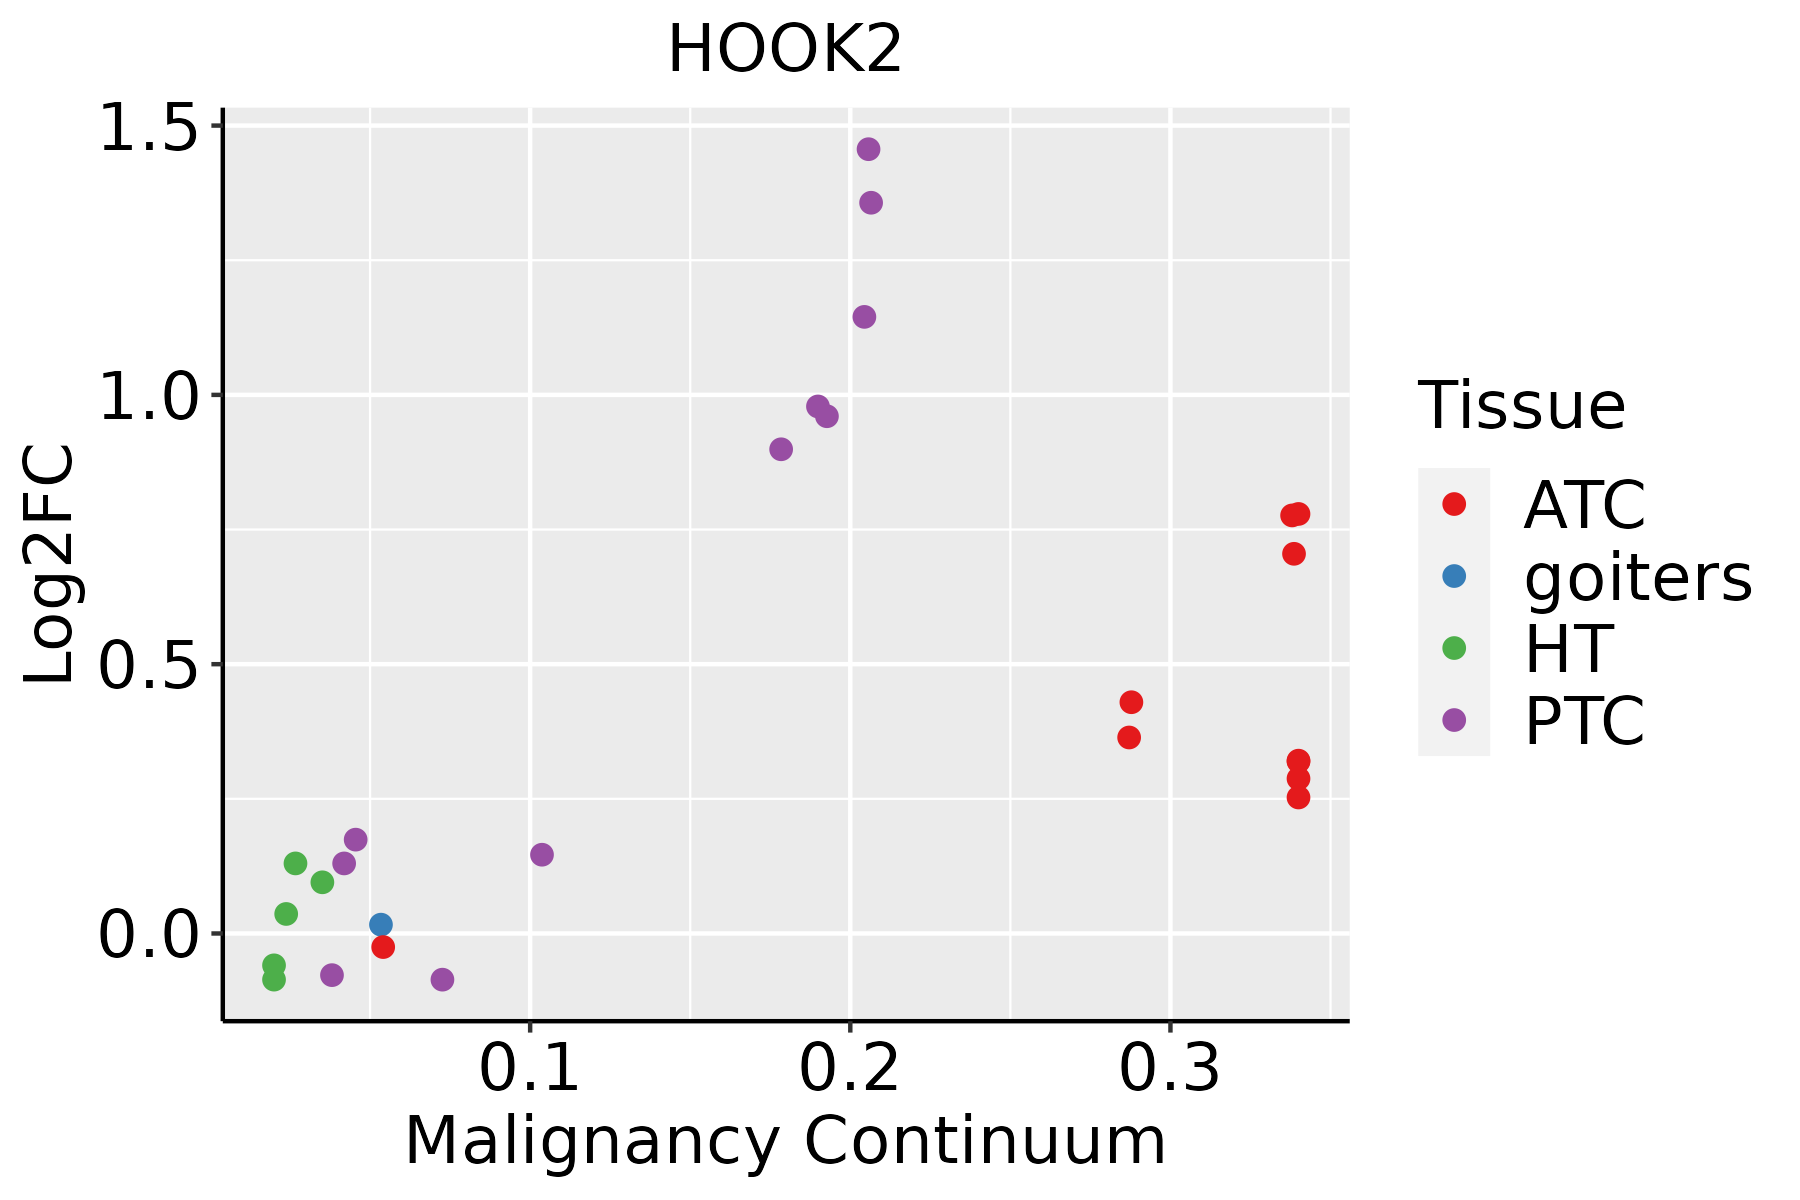
ATC: Anaplastic thyroid cancer
HT: Hashimoto's thyroiditis
PTC: Papillary thyroid cancer
∗log2FC in expression of this searched gene in stem-like cells from each diseased tissue sample relative to stem-like cells in normal samples in each tissue plotted against the malignancy continuum. Samples are colored based on if they are from different disease stage.

Top

Malignant transformation related pathway analysis

check buttonFind out the enriched GO biological processes and KEGG pathways involved in transition from healthy to precancer to cancer
check button Figure of enriched GO biological processes.
TissueDisease StageEnriched GO biological Processes
ColorectumADGO analysis - Figure of enriched GO biological processes: Top 15 enriched GO BP terms are showed in the bar plot of each disease state in each tissue. Each row represents a significant GO biological process which is colored according to the -log10(p.adjust).
ColorectumSERGO analysis - Figure of enriched GO biological processes: Top 15 enriched GO BP terms are showed in the bar plot of each disease state in each tissue. Each row represents a significant GO biological process which is colored according to the -log10(p.adjust).
ColorectumMSSGO analysis - Figure of enriched GO biological processes: Top 15 enriched GO BP terms are showed in the bar plot of each disease state in each tissue. Each row represents a significant GO biological process which is colored according to the -log10(p.adjust).
ColorectumMSI-HGO analysis - Figure of enriched GO biological processes: Top 15 enriched GO BP terms are showed in the bar plot of each disease state in each tissue. Each row represents a significant GO biological process which is colored according to the -log10(p.adjust).
ColorectumFAPGO analysis - Figure of enriched GO biological processes: Top 15 enriched GO BP terms are showed in the bar plot of each disease state in each tissue. Each row represents a significant GO biological process which is colored according to the -log10(p.adjust).
∗Top 15 enriched GO BP terms are showed in the bar plot of each disease state in each tissue. Each row represents a significant GO biological process which is colored according to the -log10(p.adjust).
Page: 1 2 3 4 5 6 7 8 9 

check button Enriched GO biological processes.
GO IDTissueDisease StageDescriptionGene RatioBg Ratiopvaluep.adjustCount
GO:00083335ThyroidPTCendosome to lysosome transport29/596855/187231.06e-036.28e-0329
GO:00450228ThyroidPTCearly endosome to late endosome transport22/596840/187232.05e-031.09e-0222
GO:009892710ThyroidPTCvesicle-mediated transport between endosomal compartments23/596843/187232.66e-031.35e-0223
GO:001605023ThyroidATCvesicle organization166/6293300/187236.14e-153.92e-13166
GO:000703322ThyroidATCvacuole organization100/6293180/187231.07e-092.71e-08100
GO:000703423ThyroidATCvacuolar transport89/6293157/187232.26e-095.40e-0889
GO:003070532ThyroidATCcytoskeleton-dependent intracellular transport105/6293195/187234.31e-099.70e-08105
GO:001648218ThyroidATCcytosolic transport93/6293168/187235.19e-091.15e-0793
GO:000704116ThyroidATClysosomal transport63/6293114/187231.58e-061.93e-0563
GO:000703216ThyroidATCendosome organization48/629382/187233.13e-063.56e-0548
GO:003112215ThyroidATCcytoplasmic microtubule organization34/629356/187232.92e-052.45e-0434
GO:000704012ThyroidATClysosome organization39/629374/187235.41e-043.13e-0339
GO:008017112ThyroidATClytic vacuole organization39/629374/187235.41e-043.13e-0339
GO:000833311ThyroidATCendosome to lysosome transport29/629355/187232.65e-031.22e-0229
GO:004502215ThyroidATCearly endosome to late endosome transport22/629340/187234.32e-031.80e-0222
GO:009892716ThyroidATCvesicle-mediated transport between endosomal compartments23/629343/187235.64e-032.29e-0223
Page: 1 2 3 4 5 6 7 8 

check button Enriched KEGG pathways.
Pathway IDTissueDisease StageDescriptionGene RatioBg Ratiopvaluep.adjustqvalueCount
Page: 1 

Top

Cell-cell communication analysis

check buttonIdentification of potential cell-cell interactions between two cell types and their ligand-receptor pairs for different disease states
LigandReceptorLRpairPathwayTissueDisease Stage
Page: 1 

Top

Single-cell gene regulatory network inference analysis

check buttonFind out the significant the regulons (TFs) and the target genes of each regulon across cell types for different disease states
TFCell TypeTissueDisease StageTarget GeneRSSRegulon Activity
∗The dot plots of a searched regulon are shown for all cell subpopulations in each disease state of each tissue based on the regulon specific score inferred using pySCENIC and by calculating the average expression.
Page: 1 

Top

Somatic mutation of malignant transformation related genes

check buttonAnnotation of somatic variants for genes involved in malignant transformation
Hugo SymbolVariant ClassVariant ClassificationdbSNP RSHGVScHGVSpHGVSp ShortSWISSPROTBIOTYPESIFTPolyPhenTumor Sample BarcodeTissueHistologySexAgeStageTherapy TypesDrugsOutcome
HOOK2SNVMissense_Mutationnovelc.2017G>Tp.Ala673Serp.A673SQ96ED9protein_codingtolerated(0.13)probably_damaging(0.953)TCGA-A7-A6VY-01Breastbreast invasive carcinomaFemale<65I/IIChemotherapycyclophosphamideCR
HOOK2SNVMissense_Mutationnovelc.2016G>Tp.Met672Ilep.M672IQ96ED9protein_codingdeleterious(0.03)benign(0.055)TCGA-A7-A6VY-01Breastbreast invasive carcinomaFemale<65I/IIChemotherapycyclophosphamideCR
HOOK2SNVMissense_Mutationrs750079184c.1283C>Tp.Pro428Leup.P428LQ96ED9protein_codingdeleterious(0.02)possibly_damaging(0.691)TCGA-AO-A128-01Breastbreast invasive carcinomaFemale<65I/IIChemotherapydoxorubicinSD
HOOK2SNVMissense_Mutationrs560204067c.422C>Tp.Ser141Leup.S141LQ96ED9protein_codingdeleterious(0.01)probably_damaging(0.983)TCGA-BH-A0W7-01Breastbreast invasive carcinomaFemale<65I/IIChemotherapytaxotereCR
HOOK2SNVMissense_Mutationc.151G>Ap.Glu51Lysp.E51KQ96ED9protein_codingdeleterious(0.04)benign(0.374)TCGA-C8-A12Q-01Breastbreast invasive carcinomaFemale>=65III/IVUnknownUnknownPD
HOOK2SNVMissense_Mutationc.886G>Ap.Glu296Lysp.E296KQ96ED9protein_codingdeleterious(0)probably_damaging(0.966)TCGA-D8-A1J8-01Breastbreast invasive carcinomaFemale>=65I/IIHormone TherapynolvadexSD
HOOK2insertionFrame_Shift_Insnovelc.1708_1709insATGGp.Pro570HisfsTer4p.P570Hfs*4Q96ED9protein_codingTCGA-A2-A0CU-01Breastbreast invasive carcinomaFemale>=65I/IIHormone TherapytamoxiphenSD
HOOK2insertionIn_Frame_Insnovelc.1707_1708insGCCTGGGCTCCACCCACCCTGGCTTCCTCCAGCTCAp.Pro569_Pro570insAlaTrpAlaProProThrLeuAlaSerSerSerSerp.P569_P570insAWAPPTLASSSSQ96ED9protein_codingTCGA-A2-A0CU-01Breastbreast invasive carcinomaFemale>=65I/IIHormone TherapytamoxiphenSD
HOOK2insertionNonsense_Mutationnovelc.1870_1871insACCAATAGCACp.Ala624AspfsTer3p.A624Dfs*3Q96ED9protein_codingTCGA-A8-A0A9-01Breastbreast invasive carcinomaFemale>=65I/IIHormone TherapyanastrozoleSD
HOOK2SNVMissense_Mutationnovelc.1955N>Tp.Ser652Ilep.S652IQ96ED9protein_codingtolerated(0.1)possibly_damaging(0.506)TCGA-2W-A8YY-01Cervixcervical & endocervical cancerFemale<65I/IIChemotherapycisplatinCR
Page: 1 2 3 4 5 6 7 

Top

Related drugs of malignant transformation related genes

check buttonIdentification of chemicals and drugs interact with genes involved in malignant transfromation
(DGIdb 4.0)
Entrez IDSymbolCategoryInteraction TypesDrug Claim NameDrug NamePMIDs
Page: 1