
|
|||||
|
 | |
| |
| |
| |
| |
| |
|
Gene: HLA-DMA |
Gene summary for HLA-DMA |
| Gene information | Species | Human | Gene symbol | HLA-DMA | Gene ID | 3108 |
| Gene name | major histocompatibility complex, class II, DM alpha | |
| Gene Alias | D6S222E | |
| Cytomap | 6p21.32 | |
| Gene Type | protein-coding | GO ID | GO:0001775 | UniProtAcc | Q31604 |
Top |
Malignant transformation analysis |
| Identification of the aberrant gene expression in precancerous and cancerous lesions by comparing the gene expression of stem-like cells in diseased tissues with normal stem cells |
| Entrez ID | Symbol | Replicates | Species | Organ | Tissue | Adj P-value | Log2FC | Malignancy |
| 3108 | HLA-DMA | CCI_1 | Human | Cervix | CC | 1.12e-04 | -6.48e-01 | 0.528 |
| 3108 | HLA-DMA | CCI_3 | Human | Cervix | CC | 7.76e-05 | -5.96e-01 | 0.516 |
| 3108 | HLA-DMA | CCII_1 | Human | Cervix | CC | 3.65e-15 | -6.89e-01 | 0.3249 |
| 3108 | HLA-DMA | Tumor | Human | Cervix | CC | 6.92e-08 | -2.66e-01 | 0.1241 |
| 3108 | HLA-DMA | sample3 | Human | Cervix | CC | 8.65e-10 | -3.15e-01 | 0.1387 |
| 3108 | HLA-DMA | H2 | Human | Cervix | HSIL_HPV | 1.27e-03 | -1.70e-01 | 0.0632 |
| 3108 | HLA-DMA | L1 | Human | Cervix | CC | 1.33e-05 | -4.84e-01 | 0.0802 |
| 3108 | HLA-DMA | T1 | Human | Cervix | CC | 3.34e-02 | 2.17e-01 | 0.0918 |
| 3108 | HLA-DMA | T3 | Human | Cervix | CC | 1.11e-10 | -3.17e-01 | 0.1389 |
| 3108 | HLA-DMA | EEC-subject4 | Human | Endometrium | EEC | 9.87e-04 | 2.52e-01 | -0.2571 |
| 3108 | HLA-DMA | GSM6177620_NYU_UCEC1_lib1_lib1 | Human | Endometrium | EEC | 2.41e-14 | 6.00e-01 | -0.1869 |
| 3108 | HLA-DMA | GSM6177620_NYU_UCEC1_lib2_lib2 | Human | Endometrium | EEC | 1.80e-12 | 5.31e-01 | -0.1875 |
| 3108 | HLA-DMA | GSM6177620_NYU_UCEC1_lib3_lib3 | Human | Endometrium | EEC | 9.83e-13 | 4.48e-01 | -0.1883 |
| 3108 | HLA-DMA | GSM6177621_NYU_UCEC2_lib1_lib1 | Human | Endometrium | EEC | 3.17e-05 | -4.34e-02 | -0.1934 |
| 3108 | HLA-DMA | GSM6177622_NYU_UCEC3_lib1_lib1 | Human | Endometrium | EEC | 4.42e-08 | 8.68e-02 | -0.1917 |
| 3108 | HLA-DMA | GSM6177622_NYU_UCEC3_lib2_lib2 | Human | Endometrium | EEC | 2.72e-05 | 1.71e-01 | -0.1916 |
| 3108 | HLA-DMA | LZE8T | Human | Esophagus | ESCC | 2.33e-31 | 1.38e+00 | 0.067 |
| 3108 | HLA-DMA | LZE24T | Human | Esophagus | ESCC | 4.16e-04 | 3.24e-01 | 0.0596 |
| 3108 | HLA-DMA | LZE6T | Human | Esophagus | ESCC | 2.51e-23 | 1.55e+00 | 0.0845 |
| 3108 | HLA-DMA | P1T-E | Human | Esophagus | ESCC | 2.69e-02 | 1.10e+00 | 0.0875 |
| Page: 1 2 3 4 5 |
| Tissue | Expression Dynamics | Abbreviation |
| Cervix | 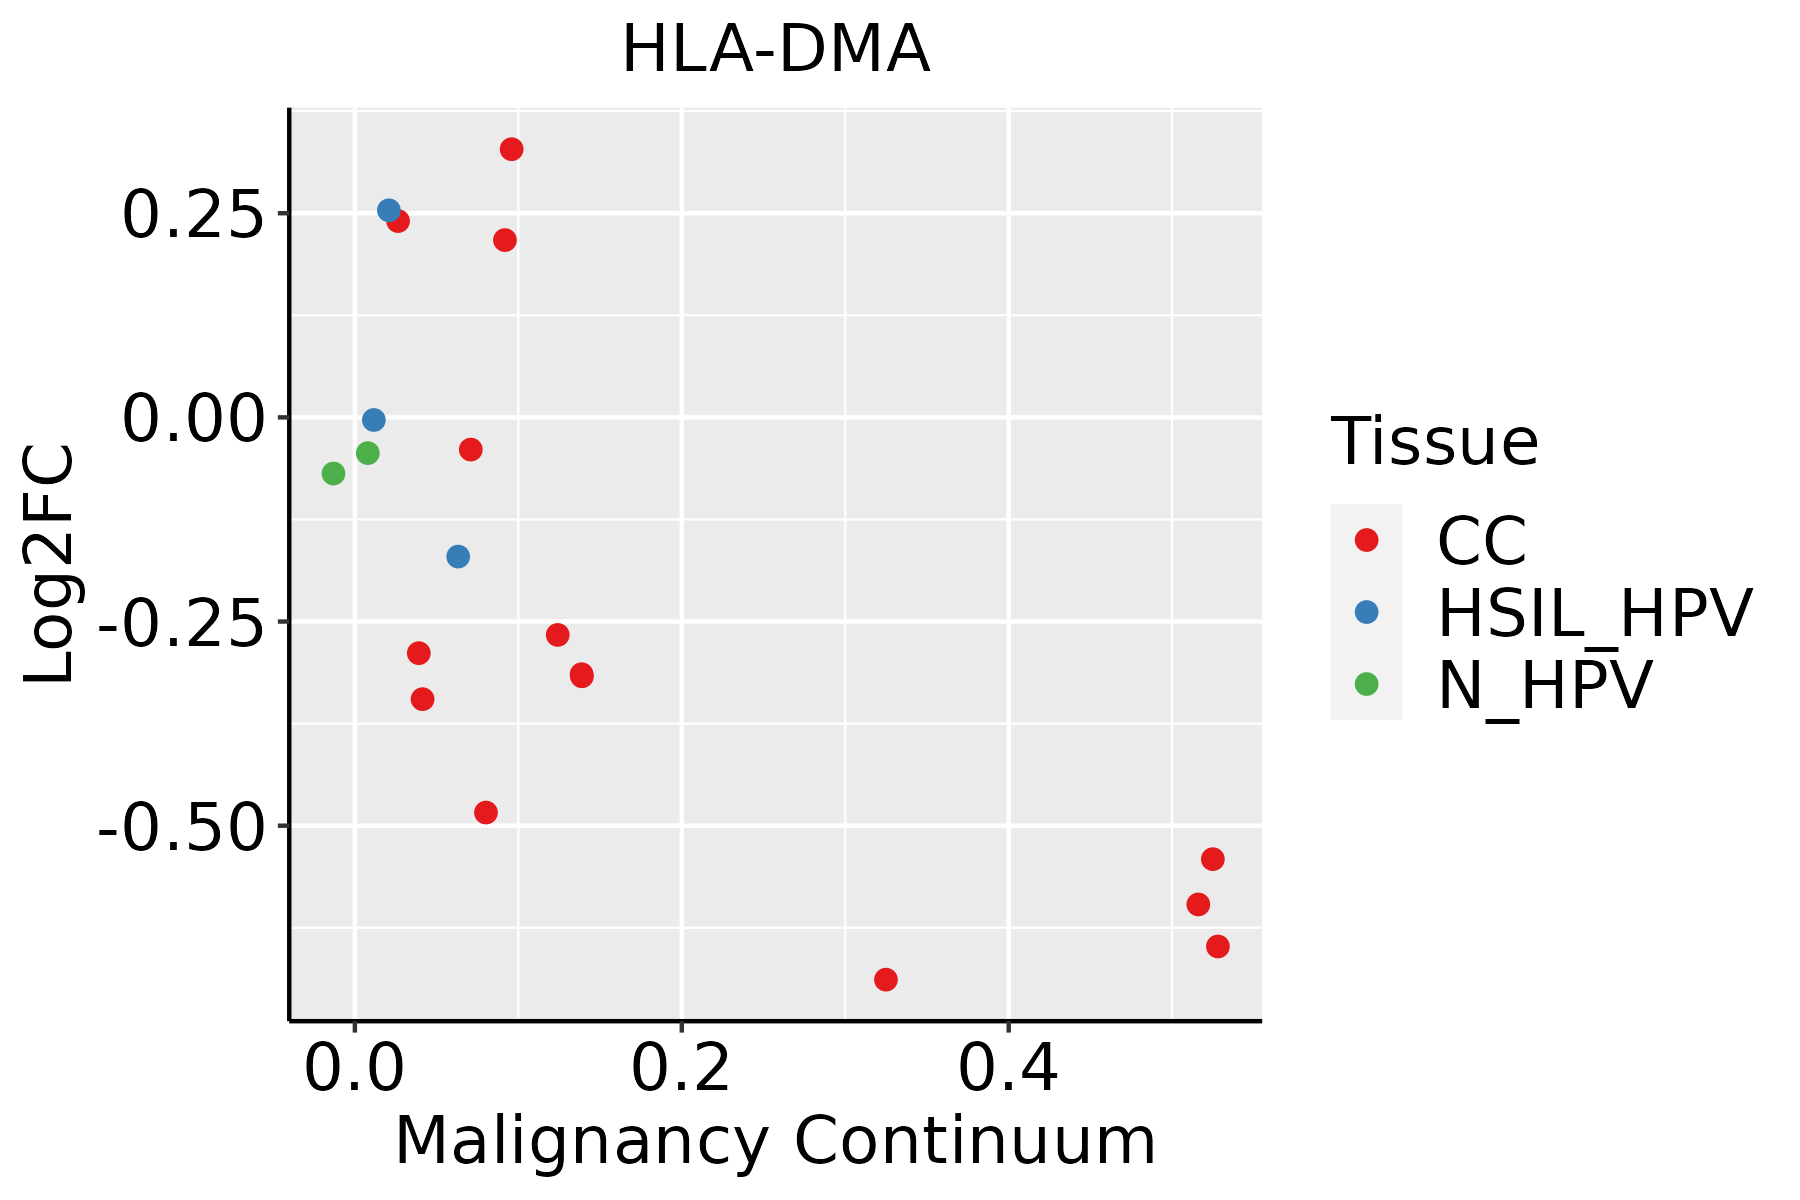 | CC: Cervix cancer |
| HSIL_HPV: HPV-infected high-grade squamous intraepithelial lesions | ||
| N_HPV: HPV-infected normal cervix | ||
| Endometrium |  | AEH: Atypical endometrial hyperplasia |
| EEC: Endometrioid Cancer | ||
| Esophagus | 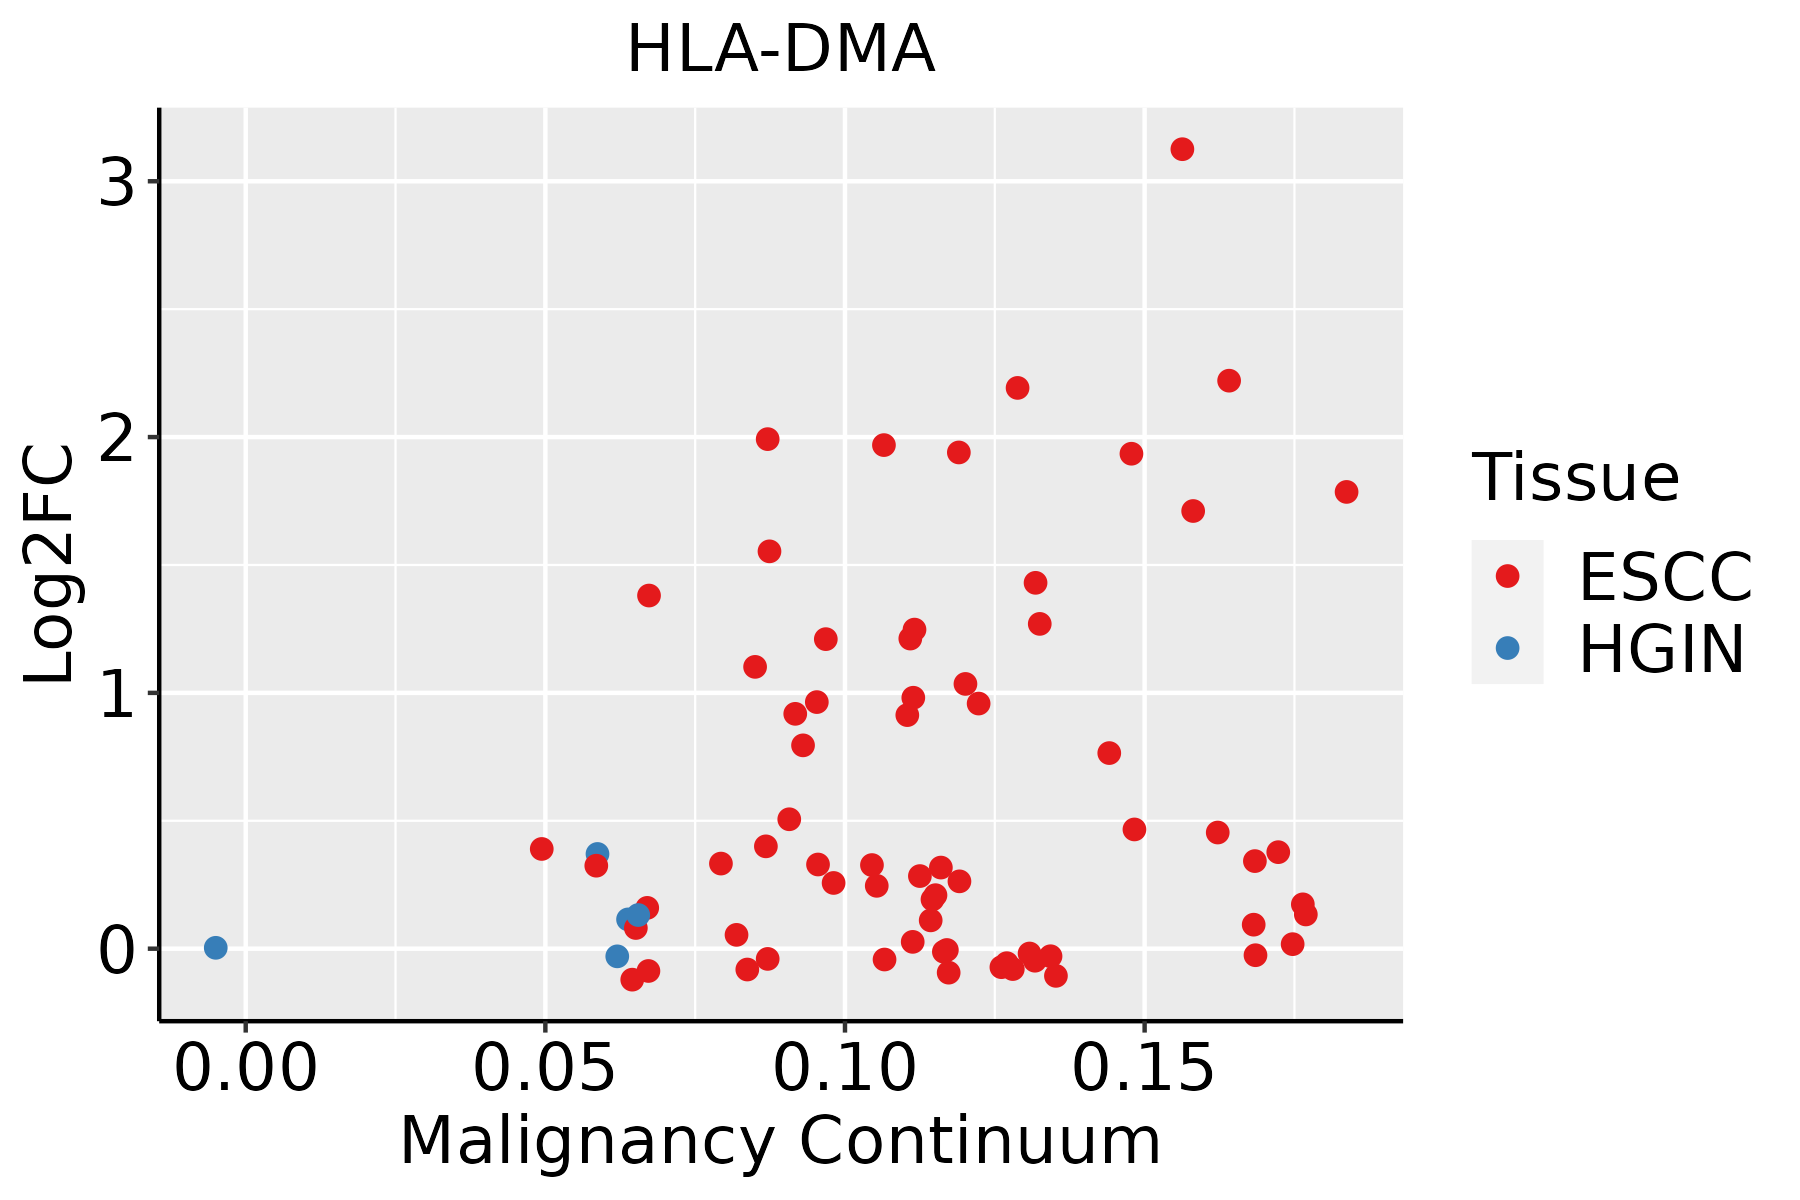 | ESCC: Esophageal squamous cell carcinoma |
| HGIN: High-grade intraepithelial neoplasias | ||
| LGIN: Low-grade intraepithelial neoplasias | ||
| Liver | 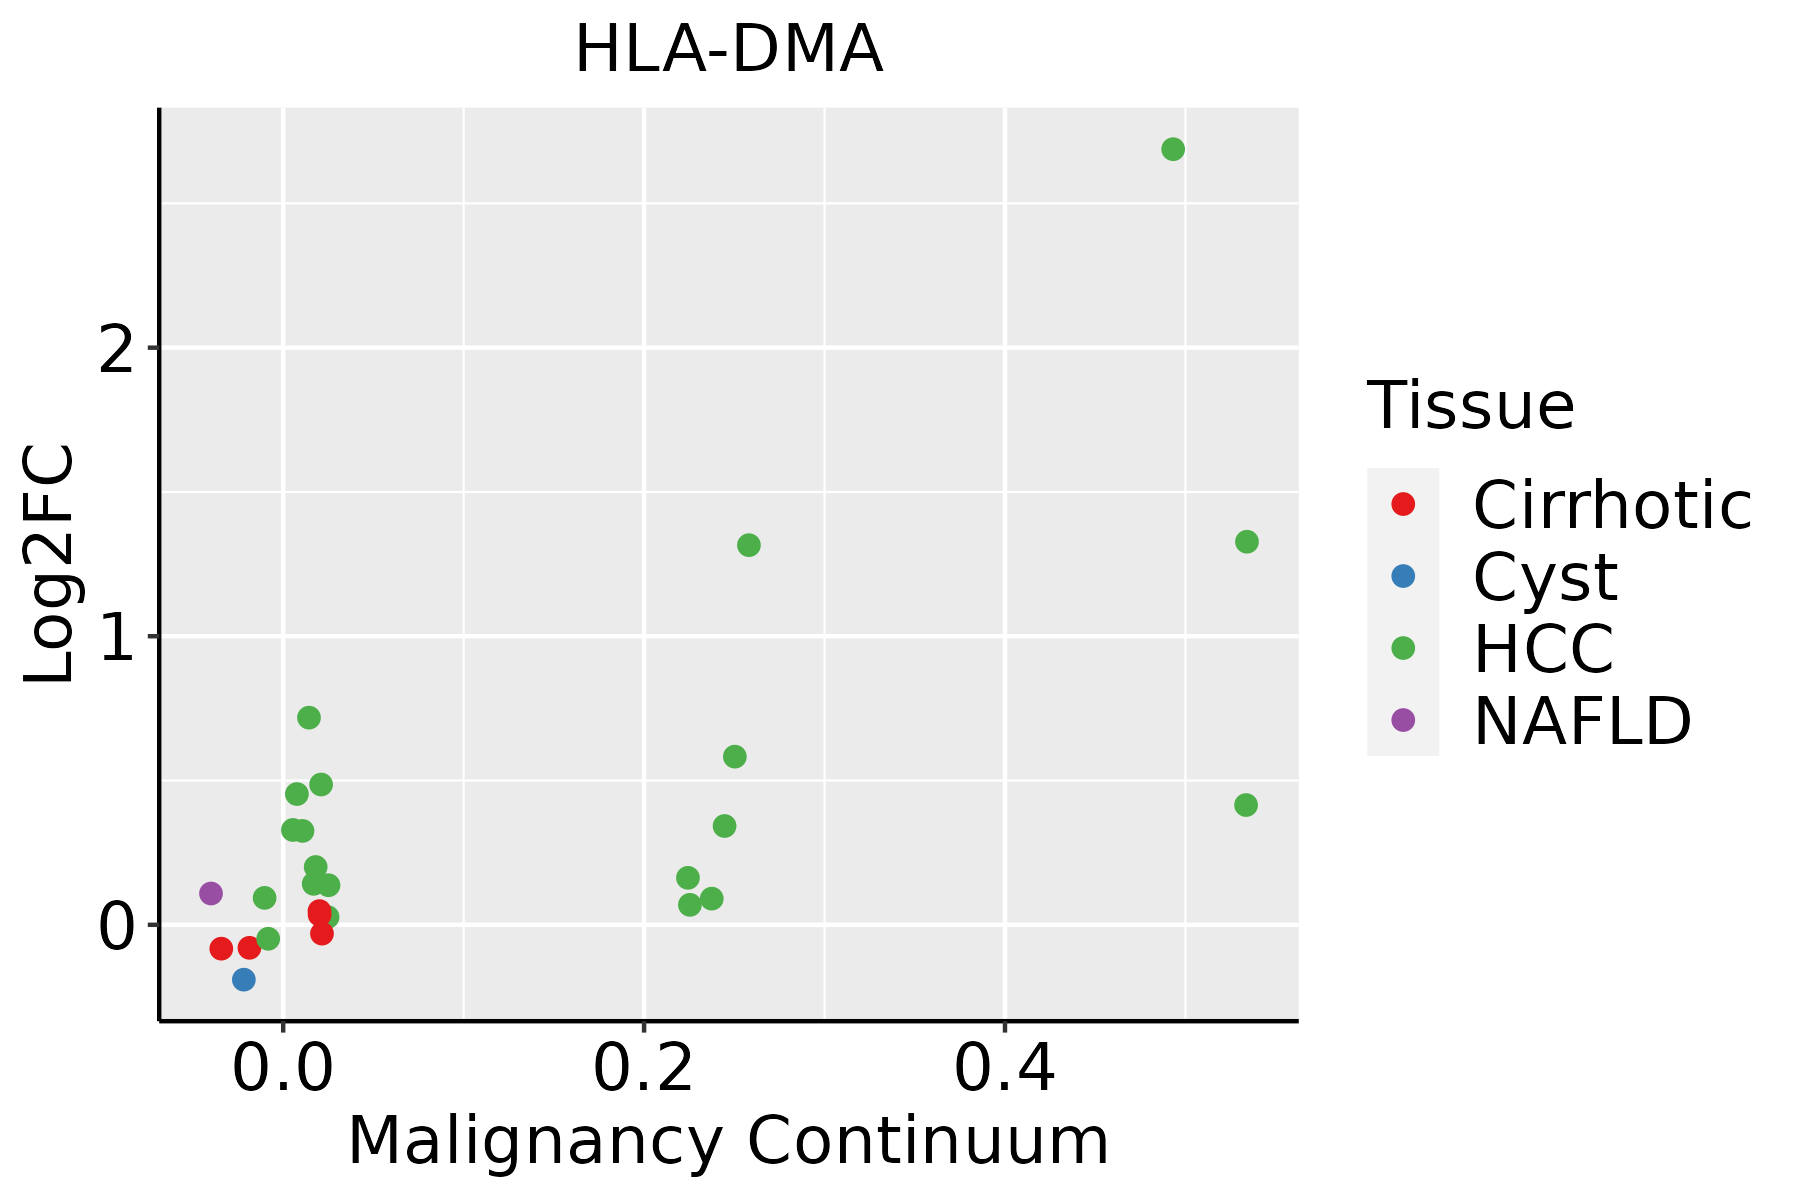 | HCC: Hepatocellular carcinoma |
| NAFLD: Non-alcoholic fatty liver disease | ||
| Oral Cavity |  | EOLP: Erosive Oral lichen planus |
| LP: leukoplakia | ||
| NEOLP: Non-erosive oral lichen planus | ||
| OSCC: Oral squamous cell carcinoma | ||
| Skin |  | AK: Actinic keratosis |
| cSCC: Cutaneous squamous cell carcinoma | ||
| SCCIS:squamous cell carcinoma in situ | ||
| Thyroid | 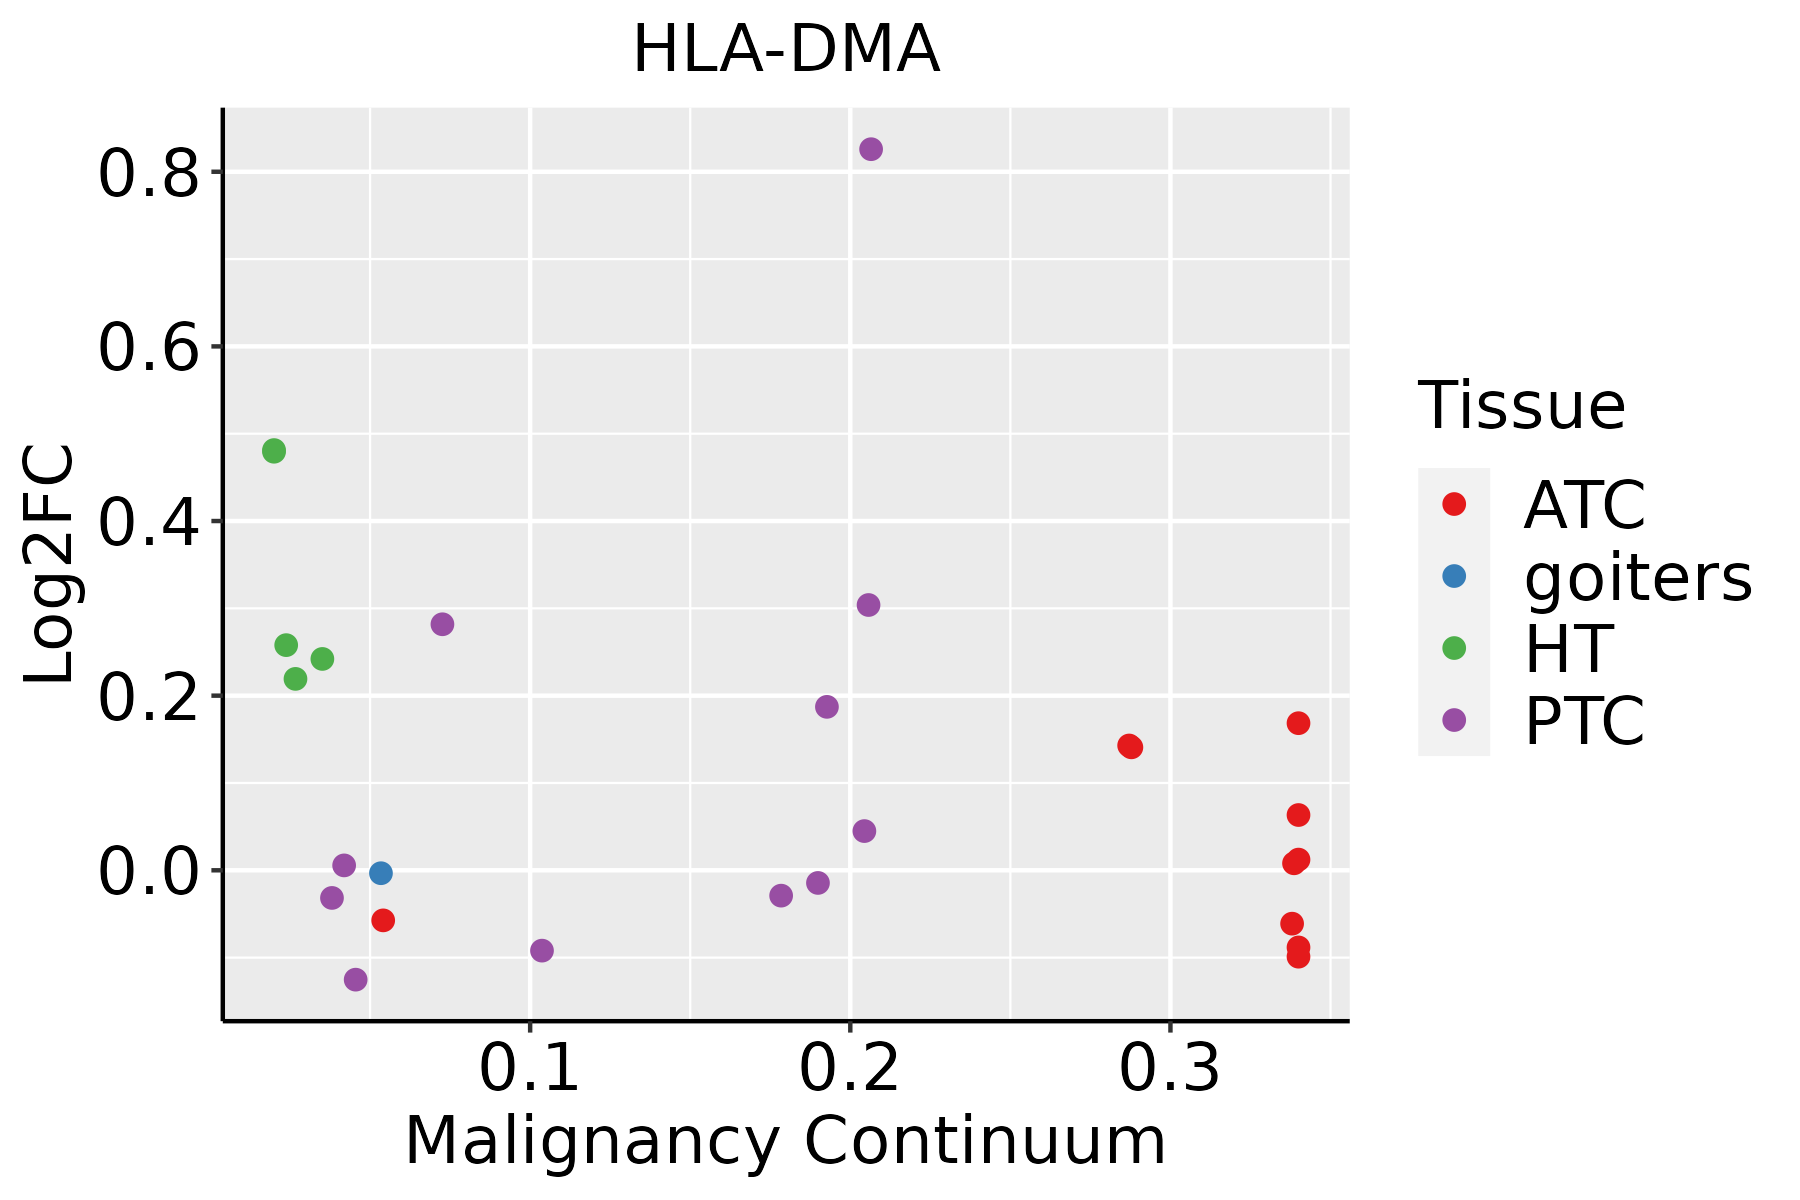 | ATC: Anaplastic thyroid cancer |
| HT: Hashimoto's thyroiditis | ||
| PTC: Papillary thyroid cancer |
| ∗log2FC in expression of this searched gene in stem-like cells from each diseased tissue sample relative to stem-like cells in normal samples in each tissue plotted against the malignancy continuum. Samples are colored based on if they are from different disease stage. |
Top |
Malignant transformation related pathway analysis |
| Find out the enriched GO biological processes and KEGG pathways involved in transition from healthy to precancer to cancer |
| Tissue | Disease Stage | Enriched GO biological Processes |
| Colorectum | AD |  |
| Colorectum | SER |  |
| Colorectum | MSS |  |
| Colorectum | MSI-H |  |
| Colorectum | FAP |  |
| ∗Top 15 enriched GO BP terms are showed in the bar plot of each disease state in each tissue. Each row represents a significant GO biological process which is colored according to the -log10(p.adjust). |
| Page: 1 2 3 4 5 6 7 8 9 |
| GO ID | Tissue | Disease Stage | Description | Gene Ratio | Bg Ratio | pvalue | p.adjust | Count |
| GO:000250416 | Oral cavity | LP | antigen processing and presentation of peptide or polysaccharide antigen via MHC class II | 16/4623 | 36/18723 | 7.52e-03 | 4.15e-02 | 16 |
| GO:004578528 | Skin | AK | positive regulation of cell adhesion | 85/1910 | 437/18723 | 3.40e-09 | 2.79e-07 | 85 |
| GO:004211019 | Skin | AK | T cell activation | 85/1910 | 487/18723 | 5.16e-07 | 1.85e-05 | 85 |
| GO:002240725 | Skin | AK | regulation of cell-cell adhesion | 79/1910 | 448/18723 | 8.55e-07 | 2.81e-05 | 79 |
| GO:000239915 | Skin | AK | MHC class II protein complex assembly | 9/1910 | 16/18723 | 6.89e-06 | 1.55e-04 | 9 |
| GO:000250315 | Skin | AK | peptide antigen assembly with MHC class II protein complex | 9/1910 | 16/18723 | 6.89e-06 | 1.55e-04 | 9 |
| GO:005086317 | Skin | AK | regulation of T cell activation | 59/1910 | 329/18723 | 1.20e-05 | 2.46e-04 | 59 |
| GO:000715919 | Skin | AK | leukocyte cell-cell adhesion | 64/1910 | 371/18723 | 1.87e-05 | 3.52e-04 | 64 |
| GO:000250117 | Skin | AK | peptide antigen assembly with MHC protein complex | 9/1910 | 18/18723 | 2.42e-05 | 4.39e-04 | 9 |
| GO:000239619 | Skin | AK | MHC protein complex assembly | 9/1910 | 19/18723 | 4.19e-05 | 6.70e-04 | 9 |
| GO:190303718 | Skin | AK | regulation of leukocyte cell-cell adhesion | 57/1910 | 336/18723 | 8.41e-05 | 1.15e-03 | 57 |
| GO:001988619 | Skin | AK | antigen processing and presentation of exogenous peptide antigen via MHC class II | 11/1910 | 30/18723 | 1.05e-04 | 1.38e-03 | 11 |
| GO:000250418 | Skin | AK | antigen processing and presentation of peptide or polysaccharide antigen via MHC class II | 12/1910 | 36/18723 | 1.48e-04 | 1.77e-03 | 12 |
| GO:002240920 | Skin | AK | positive regulation of cell-cell adhesion | 49/1910 | 284/18723 | 1.69e-04 | 1.96e-03 | 49 |
| GO:000247825 | Skin | AK | antigen processing and presentation of exogenous peptide antigen | 12/1910 | 38/18723 | 2.64e-04 | 2.85e-03 | 12 |
| GO:005087016 | Skin | AK | positive regulation of T cell activation | 39/1910 | 216/18723 | 2.94e-04 | 3.06e-03 | 39 |
| GO:000249518 | Skin | AK | antigen processing and presentation of peptide antigen via MHC class II | 11/1910 | 34/18723 | 3.75e-04 | 3.63e-03 | 11 |
| GO:190303917 | Skin | AK | positive regulation of leukocyte cell-cell adhesion | 41/1910 | 239/18723 | 6.22e-04 | 5.45e-03 | 41 |
| GO:001988425 | Skin | AK | antigen processing and presentation of exogenous antigen | 13/1910 | 47/18723 | 6.29e-04 | 5.48e-03 | 13 |
| GO:001988226 | Skin | AK | antigen processing and presentation | 22/1910 | 106/18723 | 9.13e-04 | 7.49e-03 | 22 |
| Page: 1 2 3 4 5 6 7 8 9 10 11 |
| Pathway ID | Tissue | Disease Stage | Description | Gene Ratio | Bg Ratio | pvalue | p.adjust | qvalue | Count |
| hsa0461220 | Cervix | CC | Antigen processing and presentation | 34/1267 | 78/8465 | 1.06e-09 | 2.14e-08 | 1.26e-08 | 34 |
| hsa0541620 | Cervix | CC | Viral myocarditis | 27/1267 | 60/8465 | 2.43e-08 | 3.57e-07 | 2.11e-07 | 27 |
| hsa0414520 | Cervix | CC | Phagosome | 47/1267 | 152/8465 | 3.95e-07 | 4.26e-06 | 2.52e-06 | 47 |
| hsa0516920 | Cervix | CC | Epstein-Barr virus infection | 57/1267 | 202/8465 | 7.30e-07 | 7.39e-06 | 4.37e-06 | 57 |
| hsa0516620 | Cervix | CC | Human T-cell leukemia virus 1 infection | 61/1267 | 222/8465 | 8.13e-07 | 7.98e-06 | 4.72e-06 | 61 |
| hsa0514514 | Cervix | CC | Toxoplasmosis | 34/1267 | 112/8465 | 2.42e-05 | 1.82e-04 | 1.08e-04 | 34 |
| hsa0494016 | Cervix | CC | Type I diabetes mellitus | 17/1267 | 43/8465 | 7.47e-05 | 5.04e-04 | 2.98e-04 | 17 |
| hsa0533014 | Cervix | CC | Allograft rejection | 15/1267 | 38/8465 | 2.01e-04 | 1.14e-03 | 6.75e-04 | 15 |
| hsa0516414 | Cervix | CC | Influenza A | 43/1267 | 171/8465 | 3.03e-04 | 1.64e-03 | 9.68e-04 | 43 |
| hsa0532314 | Cervix | CC | Rheumatoid arthritis | 27/1267 | 93/8465 | 3.64e-04 | 1.82e-03 | 1.07e-03 | 27 |
| hsa0533212 | Cervix | CC | Graft-versus-host disease | 15/1267 | 42/8465 | 7.12e-04 | 3.25e-03 | 1.92e-03 | 15 |
| hsa05152 | Cervix | CC | Tuberculosis | 42/1267 | 180/8465 | 1.78e-03 | 7.21e-03 | 4.26e-03 | 42 |
| hsa046596 | Cervix | CC | Th17 cell differentiation | 28/1267 | 108/8465 | 1.99e-03 | 7.98e-03 | 4.72e-03 | 28 |
| hsa0514014 | Cervix | CC | Leishmaniasis | 21/1267 | 77/8465 | 3.65e-03 | 1.34e-02 | 7.91e-03 | 21 |
| hsa04658 | Cervix | CC | Th1 and Th2 cell differentiation | 24/1267 | 92/8465 | 3.71e-03 | 1.34e-02 | 7.91e-03 | 24 |
| hsa045147 | Cervix | CC | Cell adhesion molecules | 36/1267 | 157/8465 | 4.94e-03 | 1.67e-02 | 9.86e-03 | 36 |
| hsa0532012 | Cervix | CC | Autoimmune thyroid disease | 15/1267 | 53/8465 | 9.08e-03 | 2.85e-02 | 1.69e-02 | 15 |
| hsa04612110 | Cervix | CC | Antigen processing and presentation | 34/1267 | 78/8465 | 1.06e-09 | 2.14e-08 | 1.26e-08 | 34 |
| hsa05416110 | Cervix | CC | Viral myocarditis | 27/1267 | 60/8465 | 2.43e-08 | 3.57e-07 | 2.11e-07 | 27 |
| hsa04145110 | Cervix | CC | Phagosome | 47/1267 | 152/8465 | 3.95e-07 | 4.26e-06 | 2.52e-06 | 47 |
| Page: 1 2 3 4 5 6 7 8 9 10 |
Top |
Cell-cell communication analysis |
| Identification of potential cell-cell interactions between two cell types and their ligand-receptor pairs for different disease states |
| Ligand | Receptor | LRpair | Pathway | Tissue | Disease Stage |
| HLA-DMA | CD4 | HLA-DMA_CD4 | MHC-II | Breast | DCIS |
| HLA-DMA | CD4 | HLA-DMA_CD4 | MHC-II | Breast | Healthy |
| HLA-DMA | CD4 | HLA-DMA_CD4 | MHC-II | Breast | IDC |
| HLA-DMA | CD4 | HLA-DMA_CD4 | MHC-II | Cervix | ADJ |
| HLA-DMA | CD4 | HLA-DMA_CD4 | MHC-II | Cervix | CC |
| HLA-DMA | CD4 | HLA-DMA_CD4 | MHC-II | Cervix | Healthy |
| HLA-DMA | CD4 | HLA-DMA_CD4 | MHC-II | Cervix | Precancer |
| HLA-DMA | CD4 | HLA-DMA_CD4 | MHC-II | CRC | AD |
| HLA-DMA | CD4 | HLA-DMA_CD4 | MHC-II | CRC | ADJ |
| HLA-DMA | CD4 | HLA-DMA_CD4 | MHC-II | CRC | SER |
| HLA-DMA | CD4 | HLA-DMA_CD4 | MHC-II | Endometrium | ADJ |
| HLA-DMA | CD4 | HLA-DMA_CD4 | MHC-II | Endometrium | AEH |
| HLA-DMA | CD4 | HLA-DMA_CD4 | MHC-II | Endometrium | EEC |
| HLA-DMA | CD4 | HLA-DMA_CD4 | MHC-II | Endometrium | Healthy |
| HLA-DMA | CD4 | HLA-DMA_CD4 | MHC-II | HNSCC | ADJ |
| HLA-DMA | CD4 | HLA-DMA_CD4 | MHC-II | HNSCC | Healthy |
| HLA-DMA | CD4 | HLA-DMA_CD4 | MHC-II | HNSCC | OSCC |
| HLA-DMA | CD4 | HLA-DMA_CD4 | MHC-II | HNSCC | Precancer |
| HLA-DMA | CD4 | HLA-DMA_CD4 | MHC-II | Liver | HCC |
| HLA-DMA | CD4 | HLA-DMA_CD4 | MHC-II | Liver | Healthy |
| Page: 1 2 |
Top |
Single-cell gene regulatory network inference analysis |
| Find out the significant the regulons (TFs) and the target genes of each regulon across cell types for different disease states |
| TF | Cell Type | Tissue | Disease Stage | Target Gene | RSS | Regulon Activity |
| ∗The dot plots of a searched regulon are shown for all cell subpopulations in each disease state of each tissue based on the regulon specific score inferred using pySCENIC and by calculating the average expression. |
| Page: 1 |
Top |
Somatic mutation of malignant transformation related genes |
| Annotation of somatic variants for genes involved in malignant transformation |
| Hugo Symbol | Variant Class | Variant Classification | dbSNP RS | HGVSc | HGVSp | HGVSp Short | SWISSPROT | BIOTYPE | SIFT | PolyPhen | Tumor Sample Barcode | Tissue | Histology | Sex | Age | Stage | Therapy Types | Drugs | Outcome |
| HLA-DMA | SNV | Missense_Mutation | novel | c.631N>C | p.Tyr211His | p.Y211H | P28067 | protein_coding | tolerated(0.15) | benign(0.023) | TCGA-A8-A07U-01 | Breast | breast invasive carcinoma | Female | >=65 | III/IV | Chemotherapy | 5-fluorouracil | SD |
| HLA-DMA | SNV | Missense_Mutation | rs368160706 | c.214G>A | p.Asp72Asn | p.D72N | P28067 | protein_coding | tolerated(0.25) | benign(0.026) | TCGA-2W-A8YY-01 | Cervix | cervical & endocervical cancer | Female | <65 | I/II | Chemotherapy | cisplatin | CR |
| HLA-DMA | SNV | Missense_Mutation | novel | c.29C>T | p.Ala10Val | p.A10V | P28067 | protein_coding | tolerated_low_confidence(0.25) | benign(0.003) | TCGA-2W-A8YY-01 | Cervix | cervical & endocervical cancer | Female | <65 | I/II | Chemotherapy | cisplatin | CR |
| HLA-DMA | SNV | Missense_Mutation | c.653T>C | p.Val218Ala | p.V218A | P28067 | protein_coding | deleterious(0.01) | benign(0.427) | TCGA-DG-A2KL-01 | Cervix | cervical & endocervical cancer | Female | <65 | I/II | Chemotherapy | cisplatin | SD | |
| HLA-DMA | SNV | Missense_Mutation | novel | c.326T>A | p.Ile109Asn | p.I109N | P28067 | protein_coding | deleterious(0.03) | possibly_damaging(0.849) | TCGA-AM-5820-01 | Colorectum | colon adenocarcinoma | Female | <65 | I/II | Unknown | Unknown | SD |
| HLA-DMA | SNV | Missense_Mutation | rs779711764 | c.763N>T | p.Arg255Trp | p.R255W | P28067 | protein_coding | deleterious(0.02) | possibly_damaging(0.791) | TCGA-AZ-4313-01 | Colorectum | colon adenocarcinoma | Female | <65 | I/II | Unknown | Unknown | SD |
| HLA-DMA | SNV | Missense_Mutation | rs768509769 | c.736N>A | p.Val246Met | p.V246M | P28067 | protein_coding | tolerated(0.06) | benign(0.074) | TCGA-CK-5916-01 | Colorectum | colon adenocarcinoma | Female | >=65 | I/II | Unknown | Unknown | PD |
| HLA-DMA | insertion | Frame_Shift_Ins | novel | c.549_550insCAGAA | p.Phe184GlnfsTer9 | p.F184Qfs*9 | P28067 | protein_coding | TCGA-AM-5820-01 | Colorectum | colon adenocarcinoma | Female | <65 | I/II | Unknown | Unknown | SD | ||
| HLA-DMA | insertion | Frame_Shift_Ins | novel | c.326_327insGAGAA | p.Ile109MetfsTer6 | p.I109Mfs*6 | P28067 | protein_coding | TCGA-AM-5820-01 | Colorectum | colon adenocarcinoma | Female | <65 | I/II | Unknown | Unknown | SD | ||
| HLA-DMA | SNV | Missense_Mutation | rs779711764 | c.763N>T | p.Arg255Trp | p.R255W | P28067 | protein_coding | deleterious(0.02) | possibly_damaging(0.791) | TCGA-A5-A0G2-01 | Endometrium | uterine corpus endometrioid carcinoma | Female | <65 | III/IV | Unknown | Unknown | SD |
| Page: 1 2 3 |
Top |
Related drugs of malignant transformation related genes |
| Identification of chemicals and drugs interact with genes involved in malignant transfromation |
| (DGIdb 4.0) |
| Entrez ID | Symbol | Category | Interaction Types | Drug Claim Name | Drug Name | PMIDs |
| Page: 1 |

Copyright 2023-Present -The University of Texas Health Science Center at Houston |