
|
|||||
|
 | |
| |
| |
| |
| |
| |
|
Gene: GPRC5A |
Gene summary for GPRC5A |
| Gene information | Species | Human | Gene symbol | GPRC5A | Gene ID | 9052 |
| Gene name | G protein-coupled receptor class C group 5 member A | |
| Gene Alias | GPCR5A | |
| Cytomap | 12p13.1 | |
| Gene Type | protein-coding | GO ID | GO:0001932 | UniProtAcc | Q8NFJ5 |
Top |
Malignant transformation analysis |
| Identification of the aberrant gene expression in precancerous and cancerous lesions by comparing the gene expression of stem-like cells in diseased tissues with normal stem cells |
| Entrez ID | Symbol | Replicates | Species | Organ | Tissue | Adj P-value | Log2FC | Malignancy |
| 9052 | GPRC5A | GSM4909282 | Human | Breast | IDC | 3.83e-18 | 7.07e-01 | -0.0288 |
| 9052 | GPRC5A | GSM4909290 | Human | Breast | IDC | 4.26e-03 | -2.61e-01 | 0.2096 |
| 9052 | GPRC5A | GSM4909293 | Human | Breast | IDC | 4.54e-03 | 3.01e-01 | 0.1581 |
| 9052 | GPRC5A | GSM4909296 | Human | Breast | IDC | 1.16e-02 | -1.20e-01 | 0.1524 |
| 9052 | GPRC5A | GSM4909304 | Human | Breast | IDC | 2.37e-02 | 2.18e-01 | 0.1636 |
| 9052 | GPRC5A | GSM4909311 | Human | Breast | IDC | 1.86e-12 | -1.35e-01 | 0.1534 |
| 9052 | GPRC5A | GSM4909312 | Human | Breast | IDC | 9.07e-08 | 3.78e-01 | 0.1552 |
| 9052 | GPRC5A | GSM4909313 | Human | Breast | IDC | 8.52e-06 | 5.09e-01 | 0.0391 |
| 9052 | GPRC5A | GSM4909317 | Human | Breast | IDC | 1.49e-03 | 3.99e-01 | 0.1355 |
| 9052 | GPRC5A | GSM4909319 | Human | Breast | IDC | 3.62e-14 | -2.20e-01 | 0.1563 |
| 9052 | GPRC5A | GSM4909321 | Human | Breast | IDC | 5.05e-09 | 3.57e-01 | 0.1559 |
| 9052 | GPRC5A | ctrl6 | Human | Breast | Precancer | 2.60e-32 | 1.18e+00 | -0.0061 |
| 9052 | GPRC5A | brca3 | Human | Breast | Precancer | 5.84e-04 | 3.43e-01 | -0.0263 |
| 9052 | GPRC5A | brca7 | Human | Breast | Precancer | 7.69e-03 | 8.28e-01 | -0.009 |
| 9052 | GPRC5A | brca10 | Human | Breast | Precancer | 6.70e-33 | 9.48e-01 | -0.0029 |
| 9052 | GPRC5A | M2 | Human | Breast | IDC | 9.03e-03 | -3.61e-01 | 0.21 |
| 9052 | GPRC5A | NCCBC11 | Human | Breast | DCIS | 5.79e-03 | -3.61e-01 | 0.1232 |
| 9052 | GPRC5A | NCCBC14 | Human | Breast | DCIS | 4.62e-06 | -8.15e-02 | 0.2021 |
| 9052 | GPRC5A | NCCBC3 | Human | Breast | DCIS | 1.71e-12 | -3.17e-01 | 0.1198 |
| 9052 | GPRC5A | NCCBC5 | Human | Breast | DCIS | 8.16e-05 | -1.87e-01 | 0.2046 |
| Page: 1 2 3 4 5 6 7 8 9 10 |
| Tissue | Expression Dynamics | Abbreviation |
| Breast |  | IDC: Invasive ductal carcinoma |
| DCIS: Ductal carcinoma in situ | ||
| Precancer(BRCA1-mut): Precancerous lesion from BRCA1 mutation carriers | ||
| Cervix |  | CC: Cervix cancer |
| HSIL_HPV: HPV-infected high-grade squamous intraepithelial lesions | ||
| N_HPV: HPV-infected normal cervix | ||
| Colorectum (GSE201348) |  | FAP: Familial adenomatous polyposis |
| CRC: Colorectal cancer | ||
| Colorectum (HTA11) |  | AD: Adenomas |
| SER: Sessile serrated lesions | ||
| MSI-H: Microsatellite-high colorectal cancer | ||
| MSS: Microsatellite stable colorectal cancer | ||
| Endometrium | 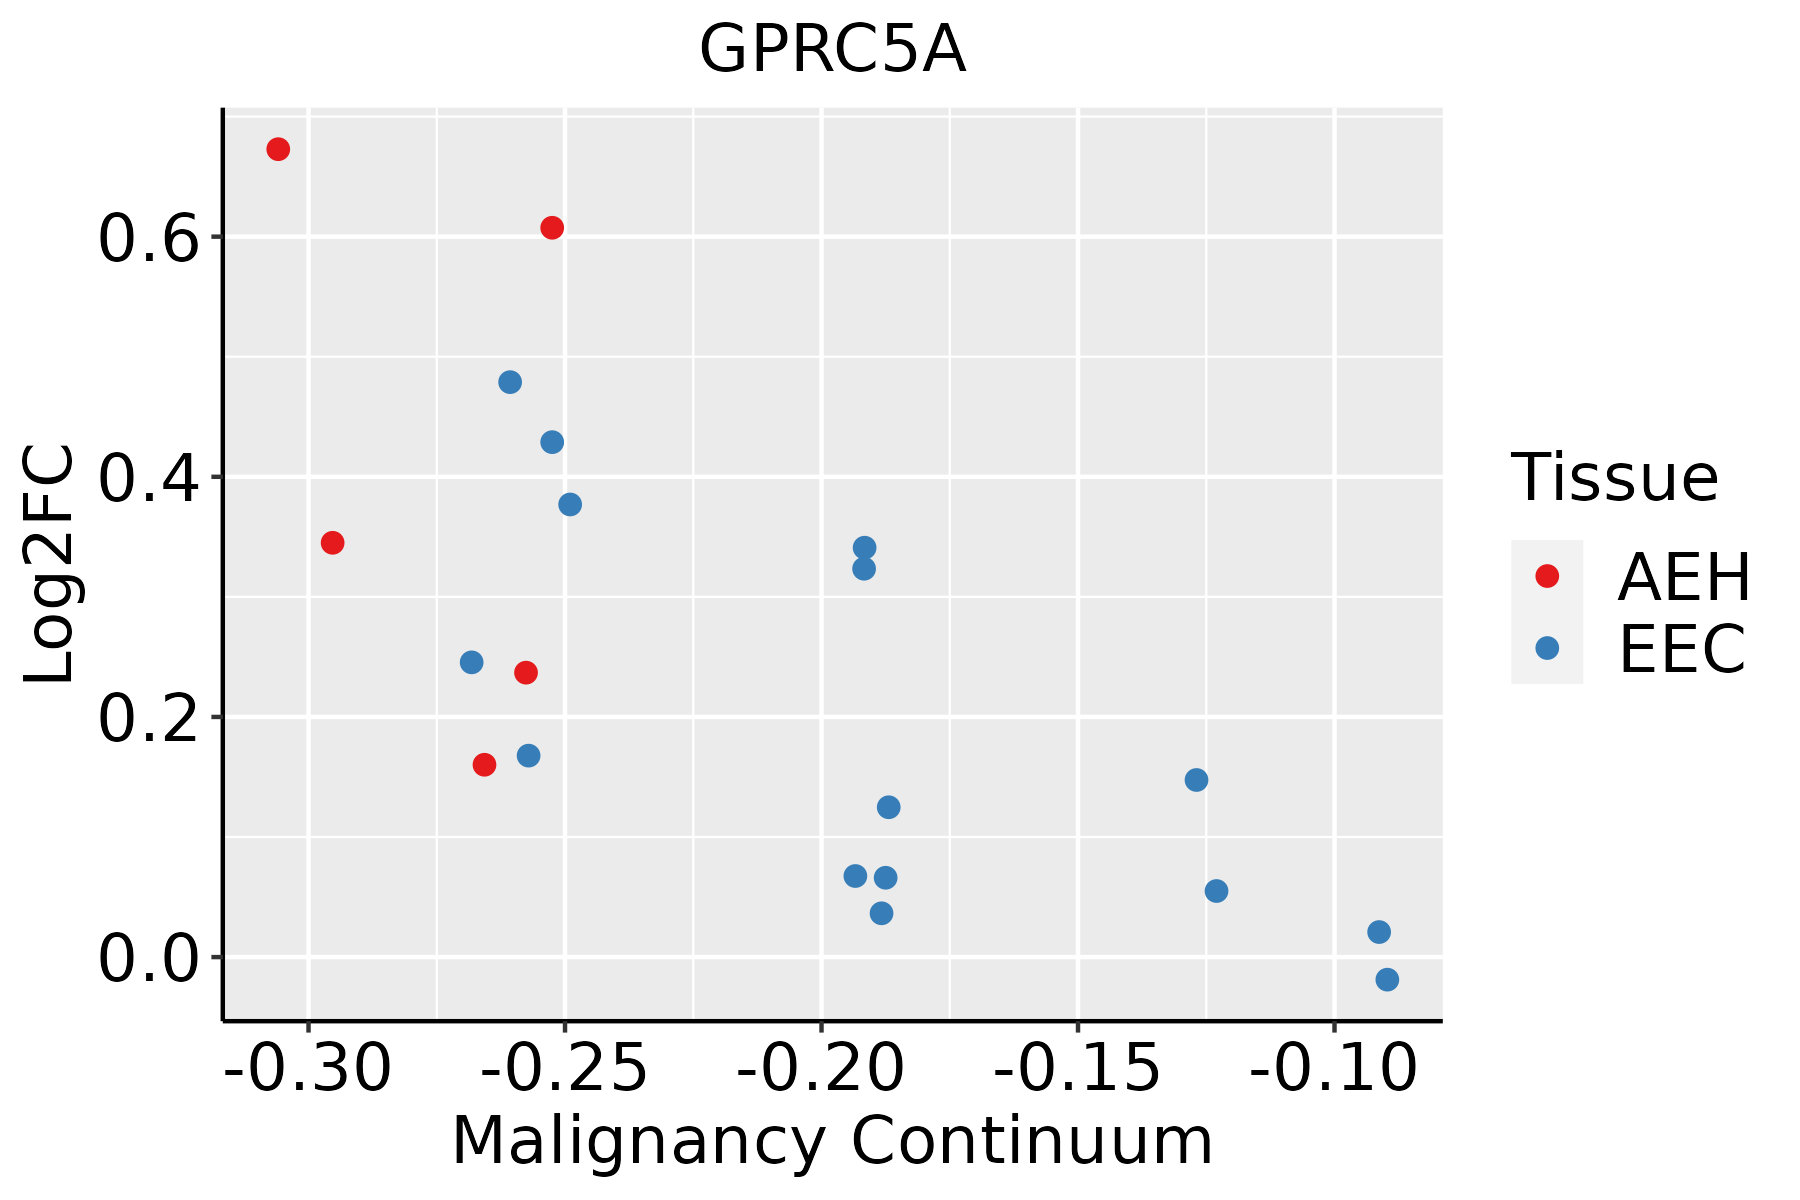 | AEH: Atypical endometrial hyperplasia |
| EEC: Endometrioid Cancer | ||
| Esophagus |  | ESCC: Esophageal squamous cell carcinoma |
| HGIN: High-grade intraepithelial neoplasias | ||
| LGIN: Low-grade intraepithelial neoplasias | ||
| GC | 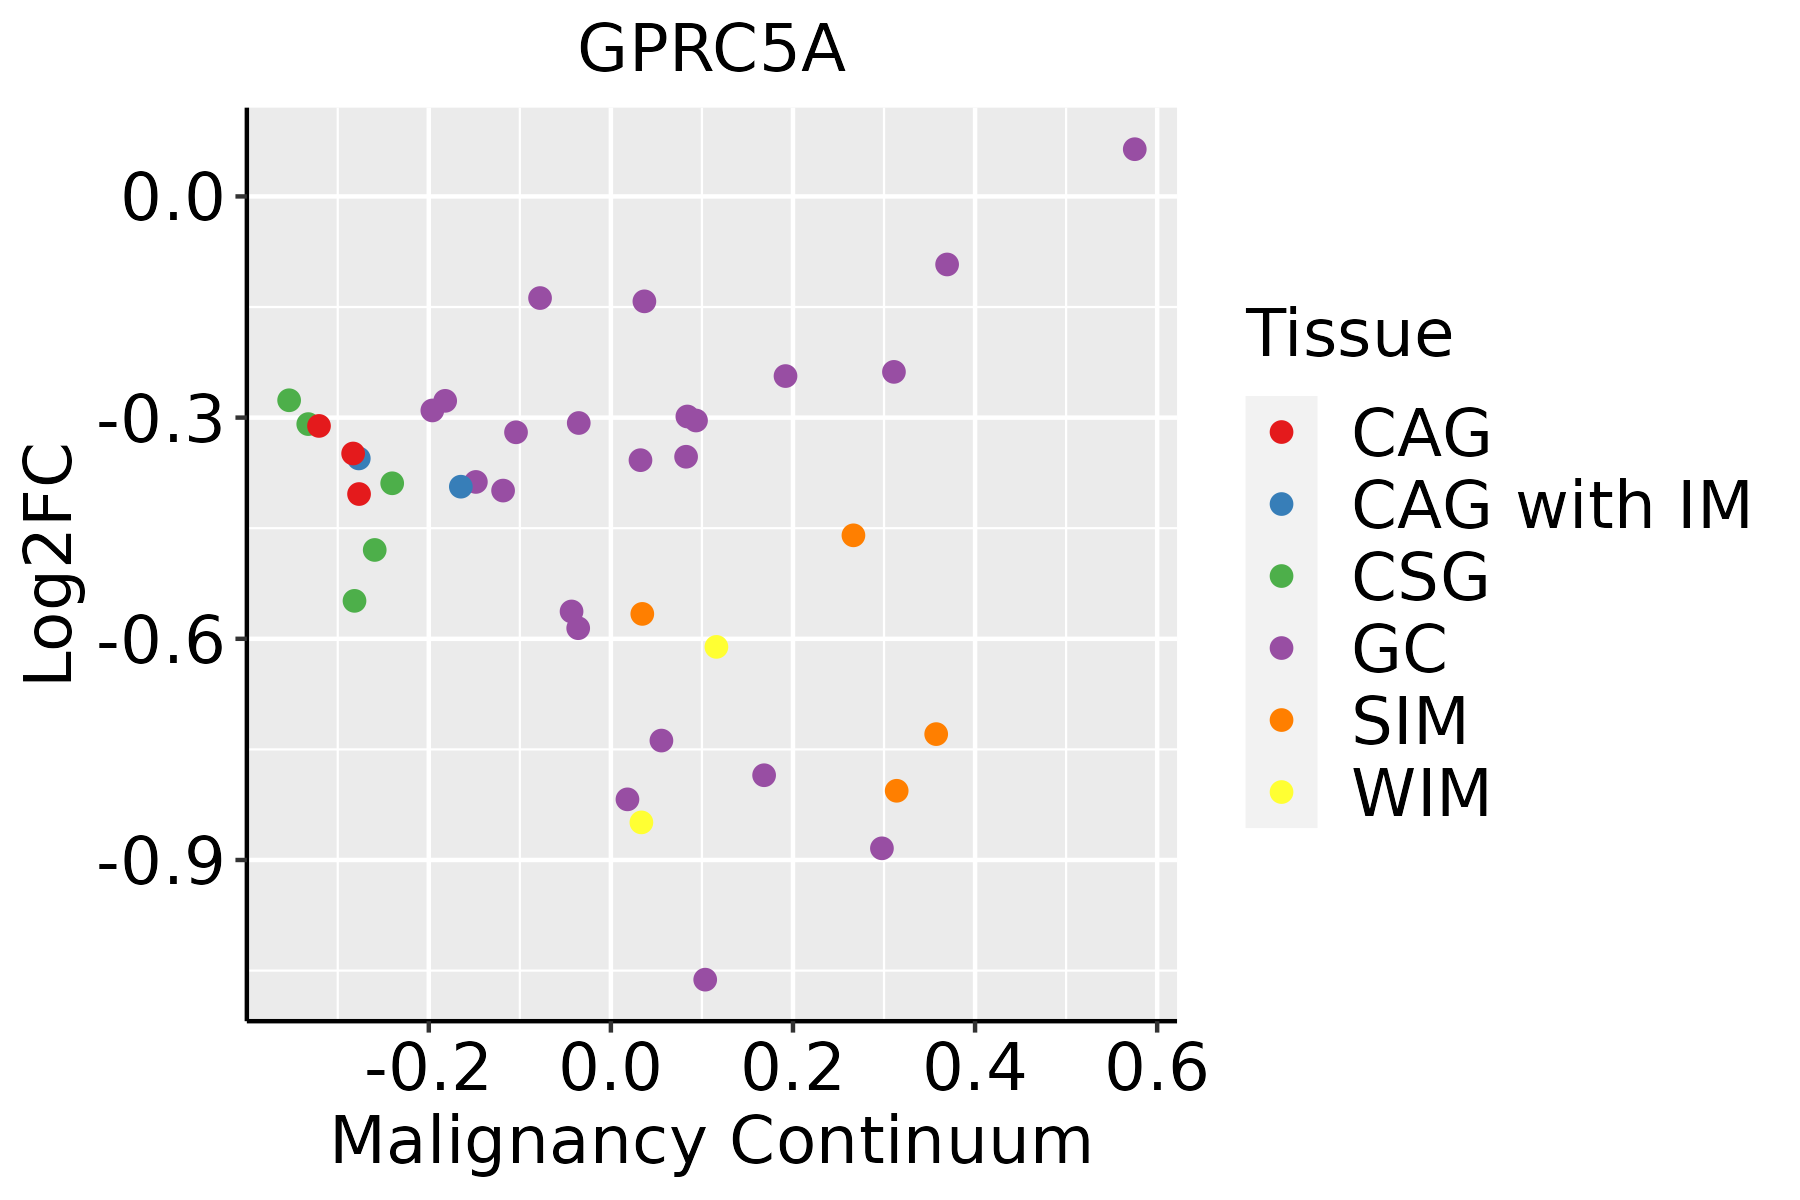 | CAG: Chronic atrophic gastritis |
| CAG with IM: Chronic atrophic gastritis with intestinal metaplasia | ||
| CSG: Chronic superficial gastritis | ||
| GC: Gastric cancer | ||
| SIM: Severe intestinal metaplasia | ||
| WIM: Wild intestinal metaplasia | ||
| Lung |  | AAH: Atypical adenomatous hyperplasia |
| AIS: Adenocarcinoma in situ | ||
| IAC: Invasive lung adenocarcinoma | ||
| MIA: Minimally invasive adenocarcinoma | ||
| Oral Cavity | 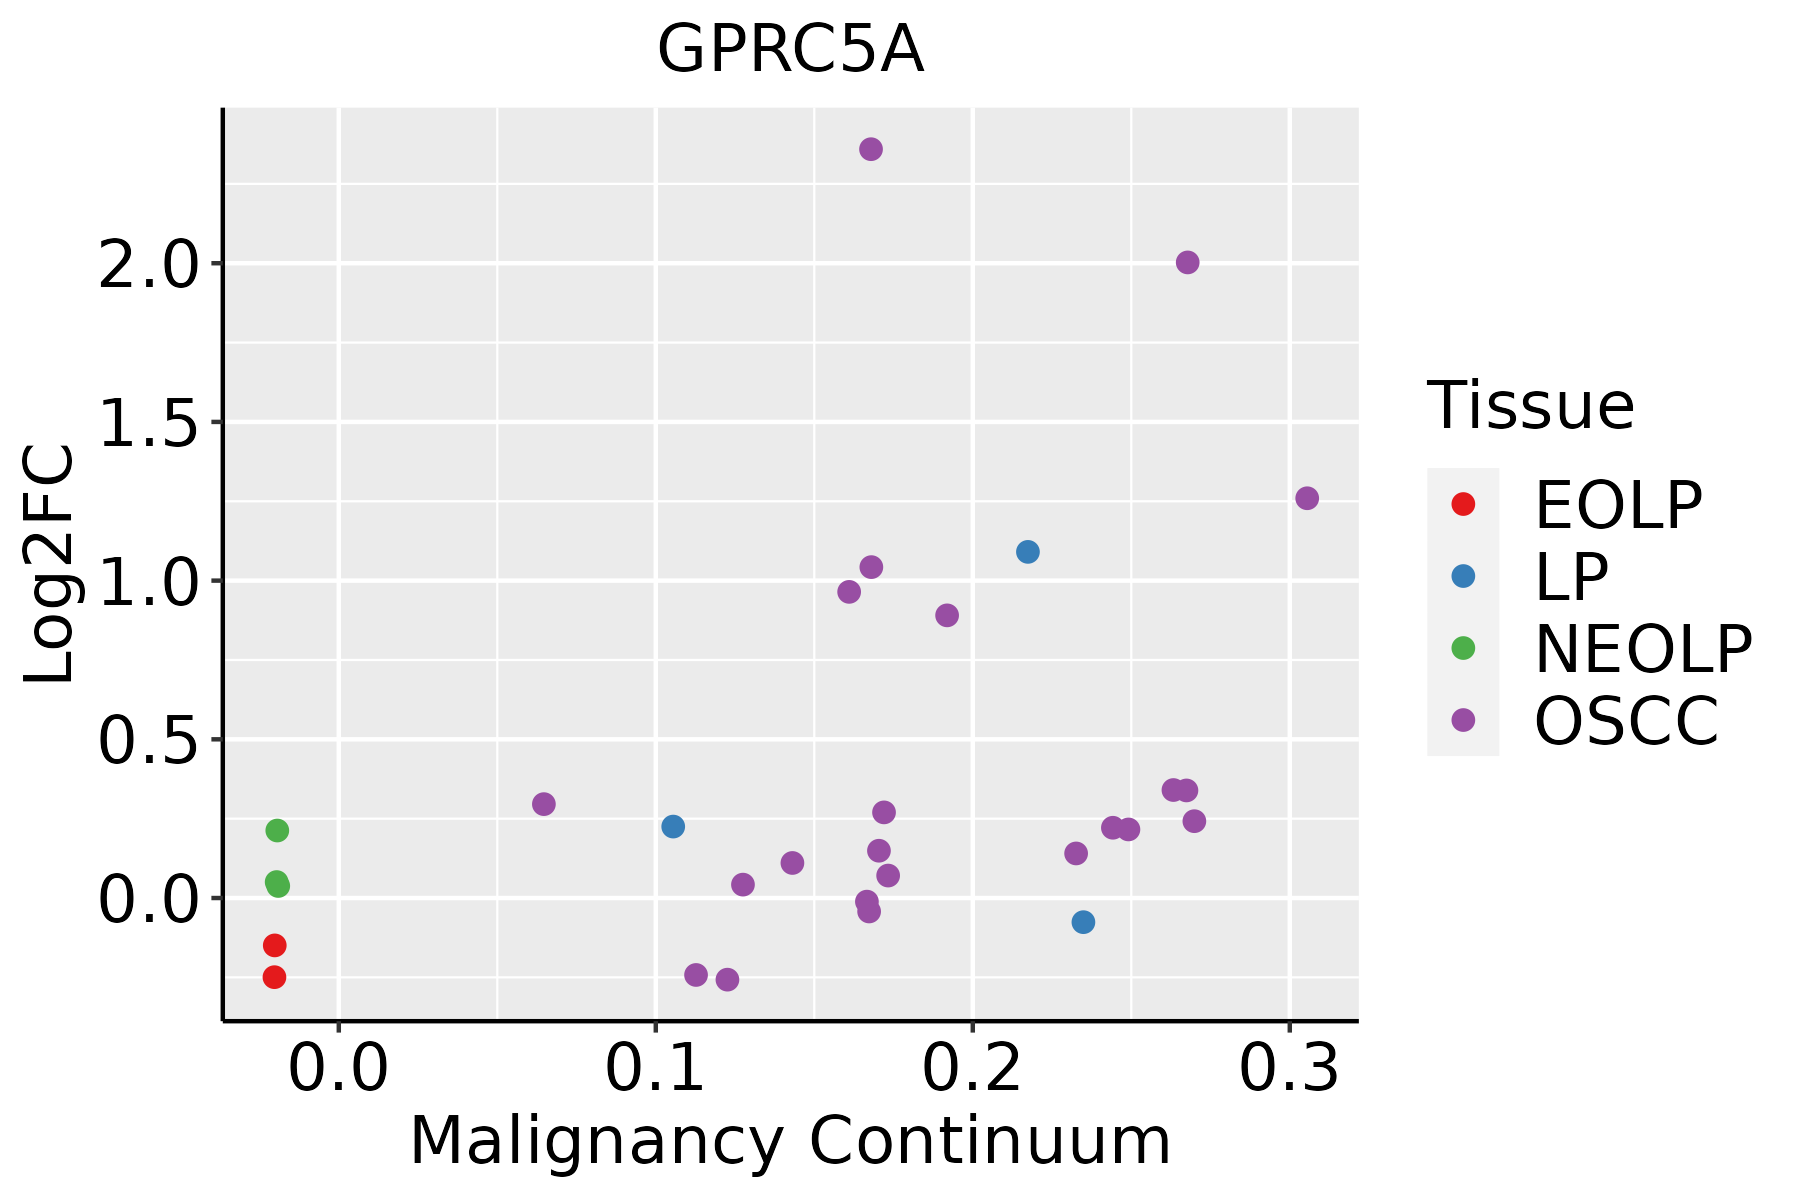 | EOLP: Erosive Oral lichen planus |
| LP: leukoplakia | ||
| NEOLP: Non-erosive oral lichen planus | ||
| OSCC: Oral squamous cell carcinoma | ||
| Prostate |  | BPH: Benign Prostatic Hyperplasia |
| Skin | 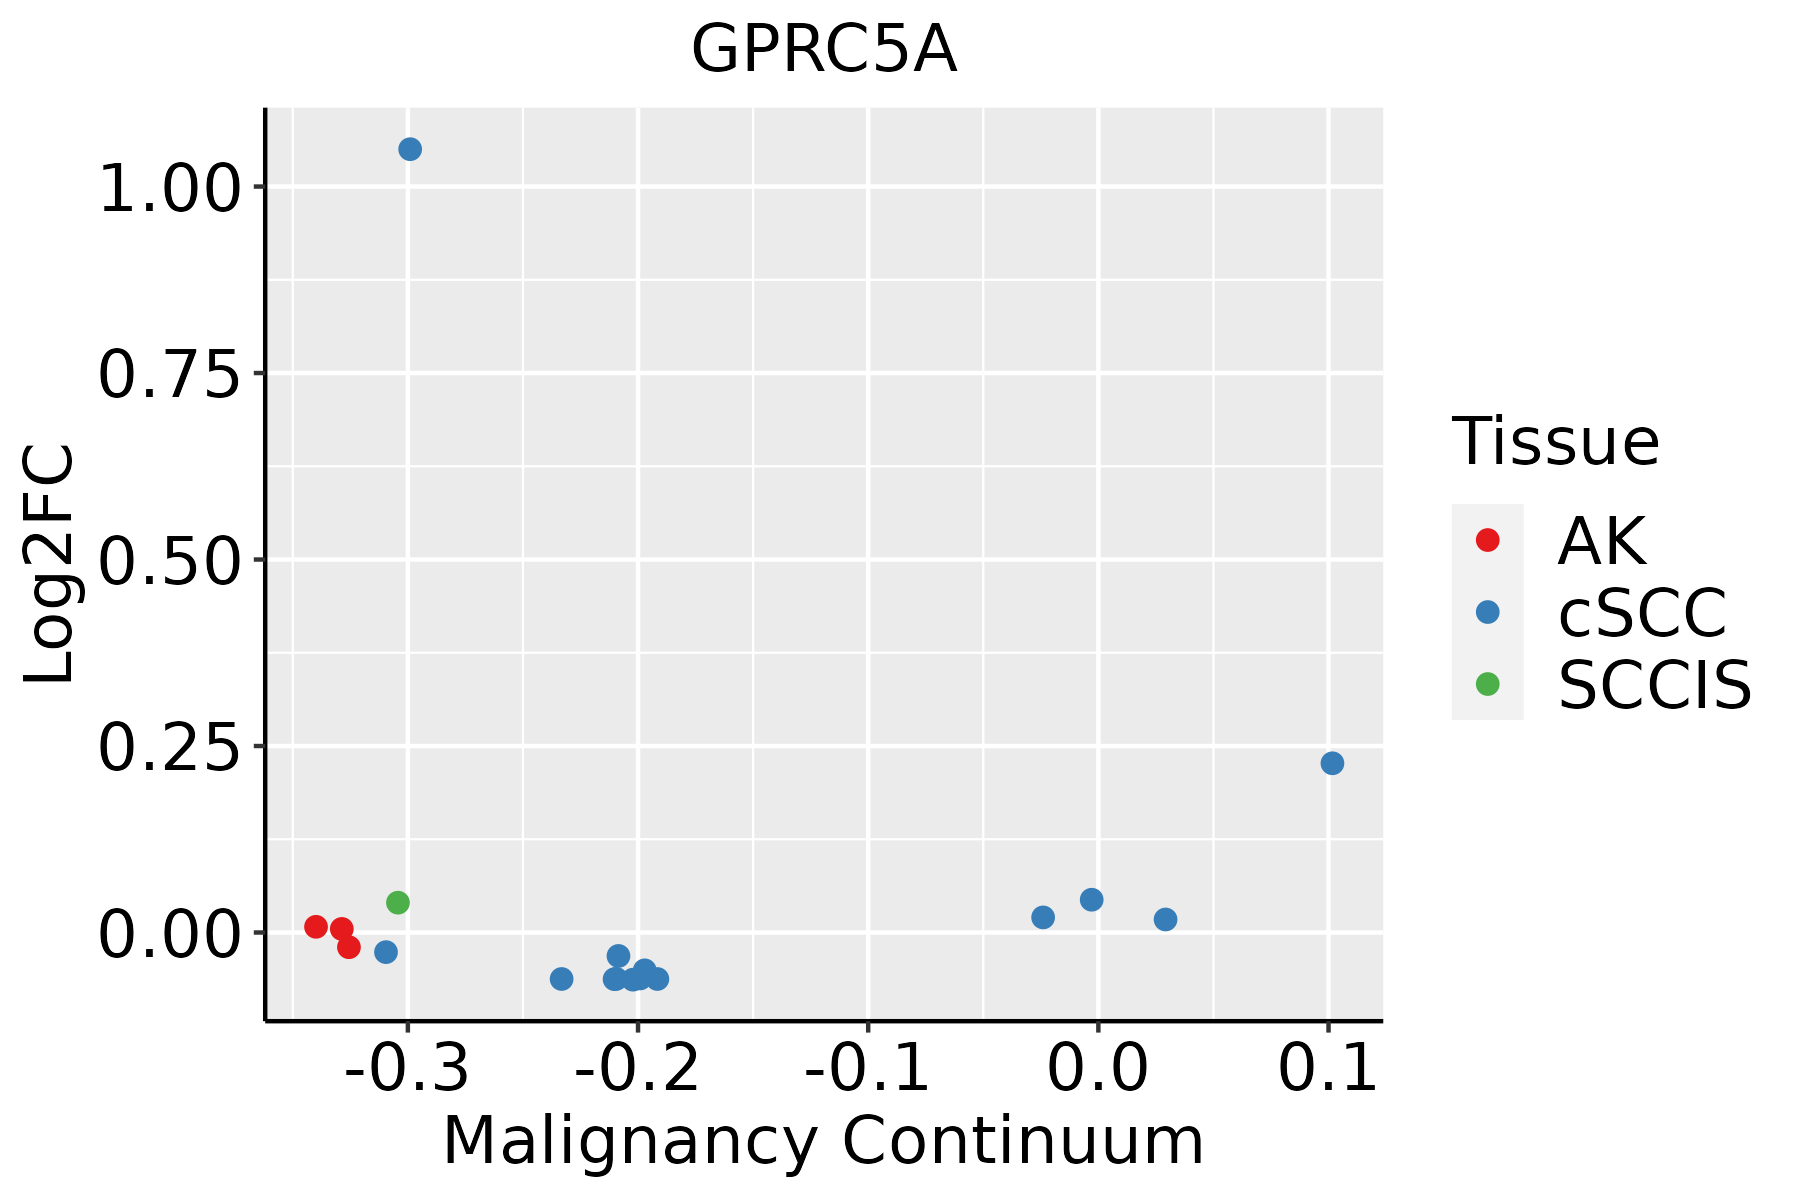 | AK: Actinic keratosis |
| cSCC: Cutaneous squamous cell carcinoma | ||
| SCCIS:squamous cell carcinoma in situ | ||
| Thyroid | 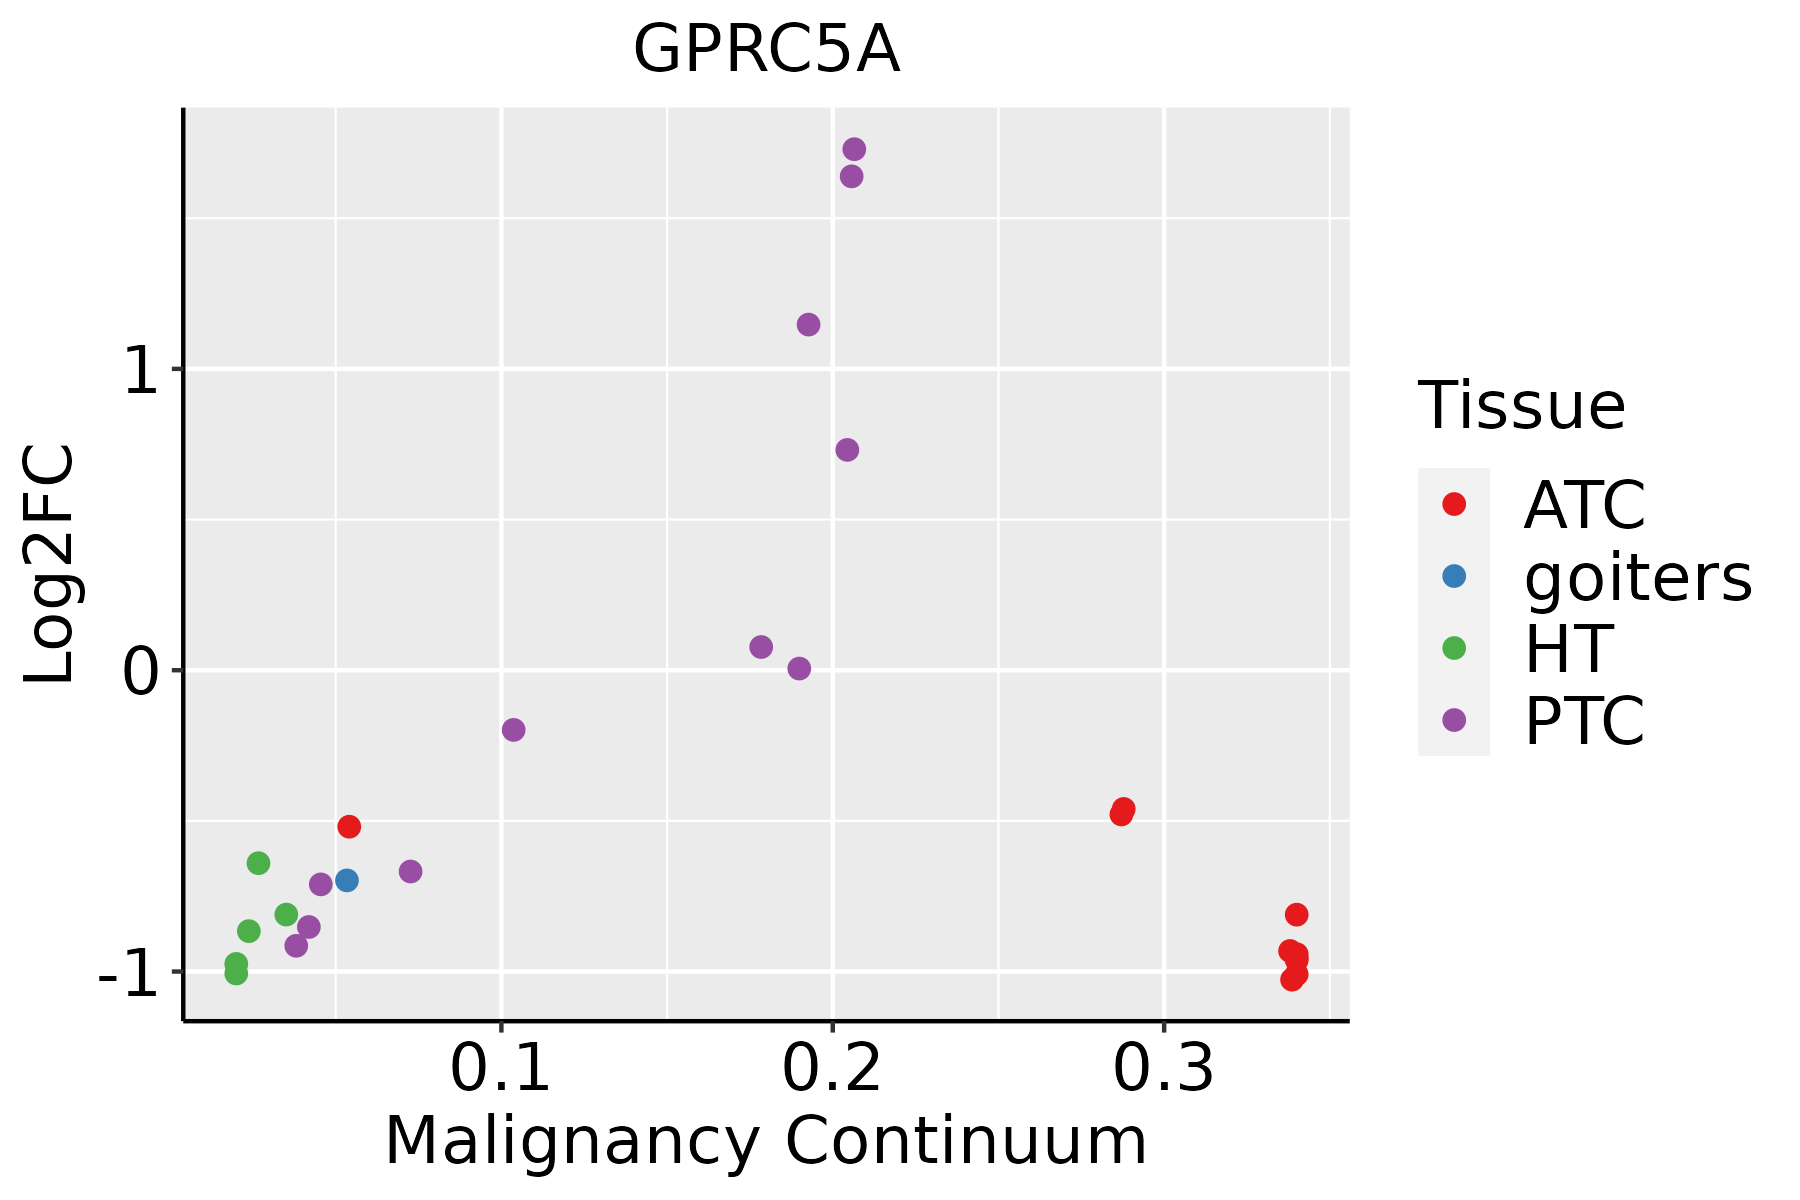 | ATC: Anaplastic thyroid cancer |
| HT: Hashimoto's thyroiditis | ||
| PTC: Papillary thyroid cancer |
| ∗log2FC in expression of this searched gene in stem-like cells from each diseased tissue sample relative to stem-like cells in normal samples in each tissue plotted against the malignancy continuum. Samples are colored based on if they are from different disease stage. |
Top |
Malignant transformation related pathway analysis |
| Find out the enriched GO biological processes and KEGG pathways involved in transition from healthy to precancer to cancer |
| Tissue | Disease Stage | Enriched GO biological Processes |
| Colorectum | AD |  |
| Colorectum | SER |  |
| Colorectum | MSS |  |
| Colorectum | MSI-H |  |
| Colorectum | FAP |  |
| ∗Top 15 enriched GO BP terms are showed in the bar plot of each disease state in each tissue. Each row represents a significant GO biological process which is colored according to the -log10(p.adjust). |
| Page: 1 2 3 4 5 6 7 8 9 |
| GO ID | Tissue | Disease Stage | Description | Gene Ratio | Bg Ratio | pvalue | p.adjust | Count |
| GO:0051348111 | Esophagus | ESCC | negative regulation of transferase activity | 177/8552 | 268/18723 | 1.08e-11 | 4.00e-10 | 177 |
| GO:0042326111 | Esophagus | ESCC | negative regulation of phosphorylation | 237/8552 | 385/18723 | 1.86e-10 | 5.33e-09 | 237 |
| GO:0001933111 | Esophagus | ESCC | negative regulation of protein phosphorylation | 213/8552 | 342/18723 | 3.54e-10 | 9.76e-09 | 213 |
| GO:003367319 | Esophagus | ESCC | negative regulation of kinase activity | 154/8552 | 237/18723 | 1.38e-09 | 3.27e-08 | 154 |
| GO:000646920 | Esophagus | ESCC | negative regulation of protein kinase activity | 140/8552 | 212/18723 | 1.53e-09 | 3.56e-08 | 140 |
| GO:003812718 | Esophagus | ESCC | ERBB signaling pathway | 82/8552 | 121/18723 | 7.23e-07 | 9.40e-06 | 82 |
| GO:000717318 | Esophagus | ESCC | epidermal growth factor receptor signaling pathway | 73/8552 | 108/18723 | 3.36e-06 | 3.73e-05 | 73 |
| GO:004586018 | Esophagus | ESCC | positive regulation of protein kinase activity | 219/8552 | 386/18723 | 6.91e-06 | 6.97e-05 | 219 |
| GO:003367420 | Esophagus | ESCC | positive regulation of kinase activity | 260/8552 | 467/18723 | 7.26e-06 | 7.22e-05 | 260 |
| GO:190118413 | Esophagus | ESCC | regulation of ERBB signaling pathway | 54/8552 | 79/18723 | 3.81e-05 | 3.08e-04 | 54 |
| GO:00507322 | Esophagus | ESCC | negative regulation of peptidyl-tyrosine phosphorylation | 42/8552 | 59/18723 | 6.35e-05 | 4.84e-04 | 42 |
| GO:00420588 | Esophagus | ESCC | regulation of epidermal growth factor receptor signaling pathway | 50/8552 | 73/18723 | 6.75e-05 | 5.12e-04 | 50 |
| GO:00610997 | Esophagus | ESCC | negative regulation of protein tyrosine kinase activity | 25/8552 | 31/18723 | 7.13e-05 | 5.38e-04 | 25 |
| GO:19011859 | Esophagus | ESCC | negative regulation of ERBB signaling pathway | 25/8552 | 32/18723 | 1.84e-04 | 1.17e-03 | 25 |
| GO:00420599 | Esophagus | ESCC | negative regulation of epidermal growth factor receptor signaling pathway | 22/8552 | 28/18723 | 3.95e-04 | 2.26e-03 | 22 |
| GO:00182124 | Esophagus | ESCC | peptidyl-tyrosine modification | 202/8552 | 378/18723 | 1.34e-03 | 6.39e-03 | 202 |
| GO:00181084 | Esophagus | ESCC | peptidyl-tyrosine phosphorylation | 200/8552 | 375/18723 | 1.60e-03 | 7.45e-03 | 200 |
| GO:000717611 | Esophagus | ESCC | regulation of epidermal growth factor-activated receptor activity | 22/8552 | 30/18723 | 1.98e-03 | 8.90e-03 | 22 |
| GO:00507303 | Esophagus | ESCC | regulation of peptidyl-tyrosine phosphorylation | 144/8552 | 264/18723 | 2.22e-03 | 9.78e-03 | 144 |
| GO:00610972 | Esophagus | ESCC | regulation of protein tyrosine kinase activity | 55/8552 | 90/18723 | 2.27e-03 | 9.99e-03 | 55 |
| Page: 1 2 3 4 5 6 7 8 9 10 11 12 13 14 15 16 17 18 19 20 |
| Pathway ID | Tissue | Disease Stage | Description | Gene Ratio | Bg Ratio | pvalue | p.adjust | qvalue | Count |
| Page: 1 |
Top |
Cell-cell communication analysis |
| Identification of potential cell-cell interactions between two cell types and their ligand-receptor pairs for different disease states |
| Ligand | Receptor | LRpair | Pathway | Tissue | Disease Stage |
| Page: 1 |
Top |
Single-cell gene regulatory network inference analysis |
| Find out the significant the regulons (TFs) and the target genes of each regulon across cell types for different disease states |
| TF | Cell Type | Tissue | Disease Stage | Target Gene | RSS | Regulon Activity |
| ∗The dot plots of a searched regulon are shown for all cell subpopulations in each disease state of each tissue based on the regulon specific score inferred using pySCENIC and by calculating the average expression. |
| Page: 1 |
Top |
Somatic mutation of malignant transformation related genes |
| Annotation of somatic variants for genes involved in malignant transformation |
| Hugo Symbol | Variant Class | Variant Classification | dbSNP RS | HGVSc | HGVSp | HGVSp Short | SWISSPROT | BIOTYPE | SIFT | PolyPhen | Tumor Sample Barcode | Tissue | Histology | Sex | Age | Stage | Therapy Types | Drugs | Outcome |
| GPRC5A | SNV | Missense_Mutation | rs745823691 | c.1007N>A | p.Ser336Tyr | p.S336Y | Q8NFJ5 | protein_coding | tolerated(0.44) | probably_damaging(0.997) | TCGA-A8-A06Q-01 | Breast | breast invasive carcinoma | Female | <65 | III/IV | Unknown | Unknown | SD |
| GPRC5A | SNV | Missense_Mutation | novel | c.764T>G | p.Val255Gly | p.V255G | Q8NFJ5 | protein_coding | deleterious(0) | possibly_damaging(0.767) | TCGA-AO-A1KT-01 | Breast | breast invasive carcinoma | Female | >=65 | I/II | Chemotherapy | fluorouracil | SD |
| GPRC5A | SNV | Missense_Mutation | novel | c.514N>T | p.Arg172Cys | p.R172C | Q8NFJ5 | protein_coding | deleterious(0.01) | possibly_damaging(0.745) | TCGA-2W-A8YY-01 | Cervix | cervical & endocervical cancer | Female | <65 | I/II | Chemotherapy | cisplatin | CR |
| GPRC5A | SNV | Missense_Mutation | c.313T>G | p.Phe105Val | p.F105V | Q8NFJ5 | protein_coding | deleterious(0) | probably_damaging(0.999) | TCGA-AA-3663-01 | Colorectum | colon adenocarcinoma | Male | <65 | I/II | Unknown | Unknown | SD | |
| GPRC5A | SNV | Missense_Mutation | rs775011273 | c.88N>A | p.Val30Ile | p.V30I | Q8NFJ5 | protein_coding | tolerated(0.14) | benign(0.03) | TCGA-AA-3811-01 | Colorectum | colon adenocarcinoma | Female | >=65 | III/IV | Unknown | Unknown | PD |
| GPRC5A | SNV | Missense_Mutation | rs775011273 | c.88N>A | p.Val30Ile | p.V30I | Q8NFJ5 | protein_coding | tolerated(0.14) | benign(0.03) | TCGA-AA-A01R-01 | Colorectum | colon adenocarcinoma | Male | <65 | III/IV | Chemotherapy | 5-fluorouracil | PD |
| GPRC5A | SNV | Missense_Mutation | c.962C>T | p.Ser321Phe | p.S321F | Q8NFJ5 | protein_coding | deleterious(0.01) | benign(0.384) | TCGA-AA-A02R-01 | Colorectum | colon adenocarcinoma | Female | >=65 | I/II | Unknown | Unknown | PD | |
| GPRC5A | SNV | Missense_Mutation | novel | c.250N>C | p.Ala84Pro | p.A84P | Q8NFJ5 | protein_coding | deleterious(0) | probably_damaging(1) | TCGA-AA-A02W-01 | Colorectum | colon adenocarcinoma | Female | >=65 | I/II | Unknown | Unknown | PD |
| GPRC5A | SNV | Missense_Mutation | c.643N>T | p.Leu215Phe | p.L215F | Q8NFJ5 | protein_coding | tolerated(0.2) | benign(0.027) | TCGA-NH-A6GB-01 | Colorectum | colon adenocarcinoma | Female | >=65 | III/IV | Chemotherapy | oxaliplatin | SD | |
| GPRC5A | SNV | Missense_Mutation | novel | c.752C>T | p.Ala251Val | p.A251V | Q8NFJ5 | protein_coding | tolerated(0.38) | benign(0.069) | TCGA-A5-A0G2-01 | Endometrium | uterine corpus endometrioid carcinoma | Female | <65 | III/IV | Unknown | Unknown | SD |
| Page: 1 2 3 4 5 |
Top |
Related drugs of malignant transformation related genes |
| Identification of chemicals and drugs interact with genes involved in malignant transfromation |
| (DGIdb 4.0) |
| Entrez ID | Symbol | Category | Interaction Types | Drug Claim Name | Drug Name | PMIDs |
| Page: 1 |

Copyright 2023-Present -The University of Texas Health Science Center at Houston |