
|
|||||
|
 | |
| |
| |
| |
| |
| |
|
Gene: GJB2 |
Gene summary for GJB2 |
| Gene information | Species | Human | Gene symbol | GJB2 | Gene ID | 2706 |
| Gene name | gap junction protein beta 2 | |
| Gene Alias | BAPS | |
| Cytomap | 13q12.11 | |
| Gene Type | protein-coding | GO ID | GO:0000003 | UniProtAcc | H9U1J4 |
Top |
Malignant transformation analysis |
| Identification of the aberrant gene expression in precancerous and cancerous lesions by comparing the gene expression of stem-like cells in diseased tissues with normal stem cells |
| Entrez ID | Symbol | Replicates | Species | Organ | Tissue | Adj P-value | Log2FC | Malignancy |
| 2706 | GJB2 | CA_HPV_1 | Human | Cervix | CC | 2.38e-05 | -2.30e-01 | 0.0264 |
| 2706 | GJB2 | HSIL_HPV_1 | Human | Cervix | HSIL_HPV | 3.06e-03 | -2.20e-01 | 0.0116 |
| 2706 | GJB2 | Tumor | Human | Cervix | CC | 4.75e-36 | 8.77e-01 | 0.1241 |
| 2706 | GJB2 | sample3 | Human | Cervix | CC | 4.90e-51 | 1.01e+00 | 0.1387 |
| 2706 | GJB2 | L1 | Human | Cervix | CC | 3.06e-04 | 4.80e-01 | 0.0802 |
| 2706 | GJB2 | T3 | Human | Cervix | CC | 2.74e-47 | 1.02e+00 | 0.1389 |
| 2706 | GJB2 | LZE5T | Human | Esophagus | ESCC | 1.85e-02 | -7.43e-01 | 0.0514 |
| 2706 | GJB2 | LZE7T | Human | Esophagus | ESCC | 7.05e-07 | -7.16e-01 | 0.0667 |
| 2706 | GJB2 | LZE8T | Human | Esophagus | ESCC | 1.03e-07 | -5.33e-01 | 0.067 |
| 2706 | GJB2 | LZE24T | Human | Esophagus | ESCC | 1.30e-11 | -4.35e-01 | 0.0596 |
| 2706 | GJB2 | LZE6T | Human | Esophagus | ESCC | 2.27e-05 | -7.24e-01 | 0.0845 |
| 2706 | GJB2 | P2T-E | Human | Esophagus | ESCC | 6.64e-11 | -6.49e-01 | 0.1177 |
| 2706 | GJB2 | P4T-E | Human | Esophagus | ESCC | 1.69e-17 | 1.30e+00 | 0.1323 |
| 2706 | GJB2 | P5T-E | Human | Esophagus | ESCC | 2.21e-03 | -3.47e-01 | 0.1327 |
| 2706 | GJB2 | P8T-E | Human | Esophagus | ESCC | 1.31e-18 | -7.03e-01 | 0.0889 |
| 2706 | GJB2 | P9T-E | Human | Esophagus | ESCC | 6.54e-05 | -2.67e-01 | 0.1131 |
| 2706 | GJB2 | P12T-E | Human | Esophagus | ESCC | 5.09e-06 | -2.16e-01 | 0.1122 |
| 2706 | GJB2 | P16T-E | Human | Esophagus | ESCC | 1.70e-24 | -5.78e-01 | 0.1153 |
| 2706 | GJB2 | P20T-E | Human | Esophagus | ESCC | 1.04e-05 | 8.98e-01 | 0.1124 |
| 2706 | GJB2 | P21T-E | Human | Esophagus | ESCC | 1.15e-09 | 1.13e+00 | 0.1617 |
| Page: 1 2 3 4 |
| Tissue | Expression Dynamics | Abbreviation |
| Cervix | 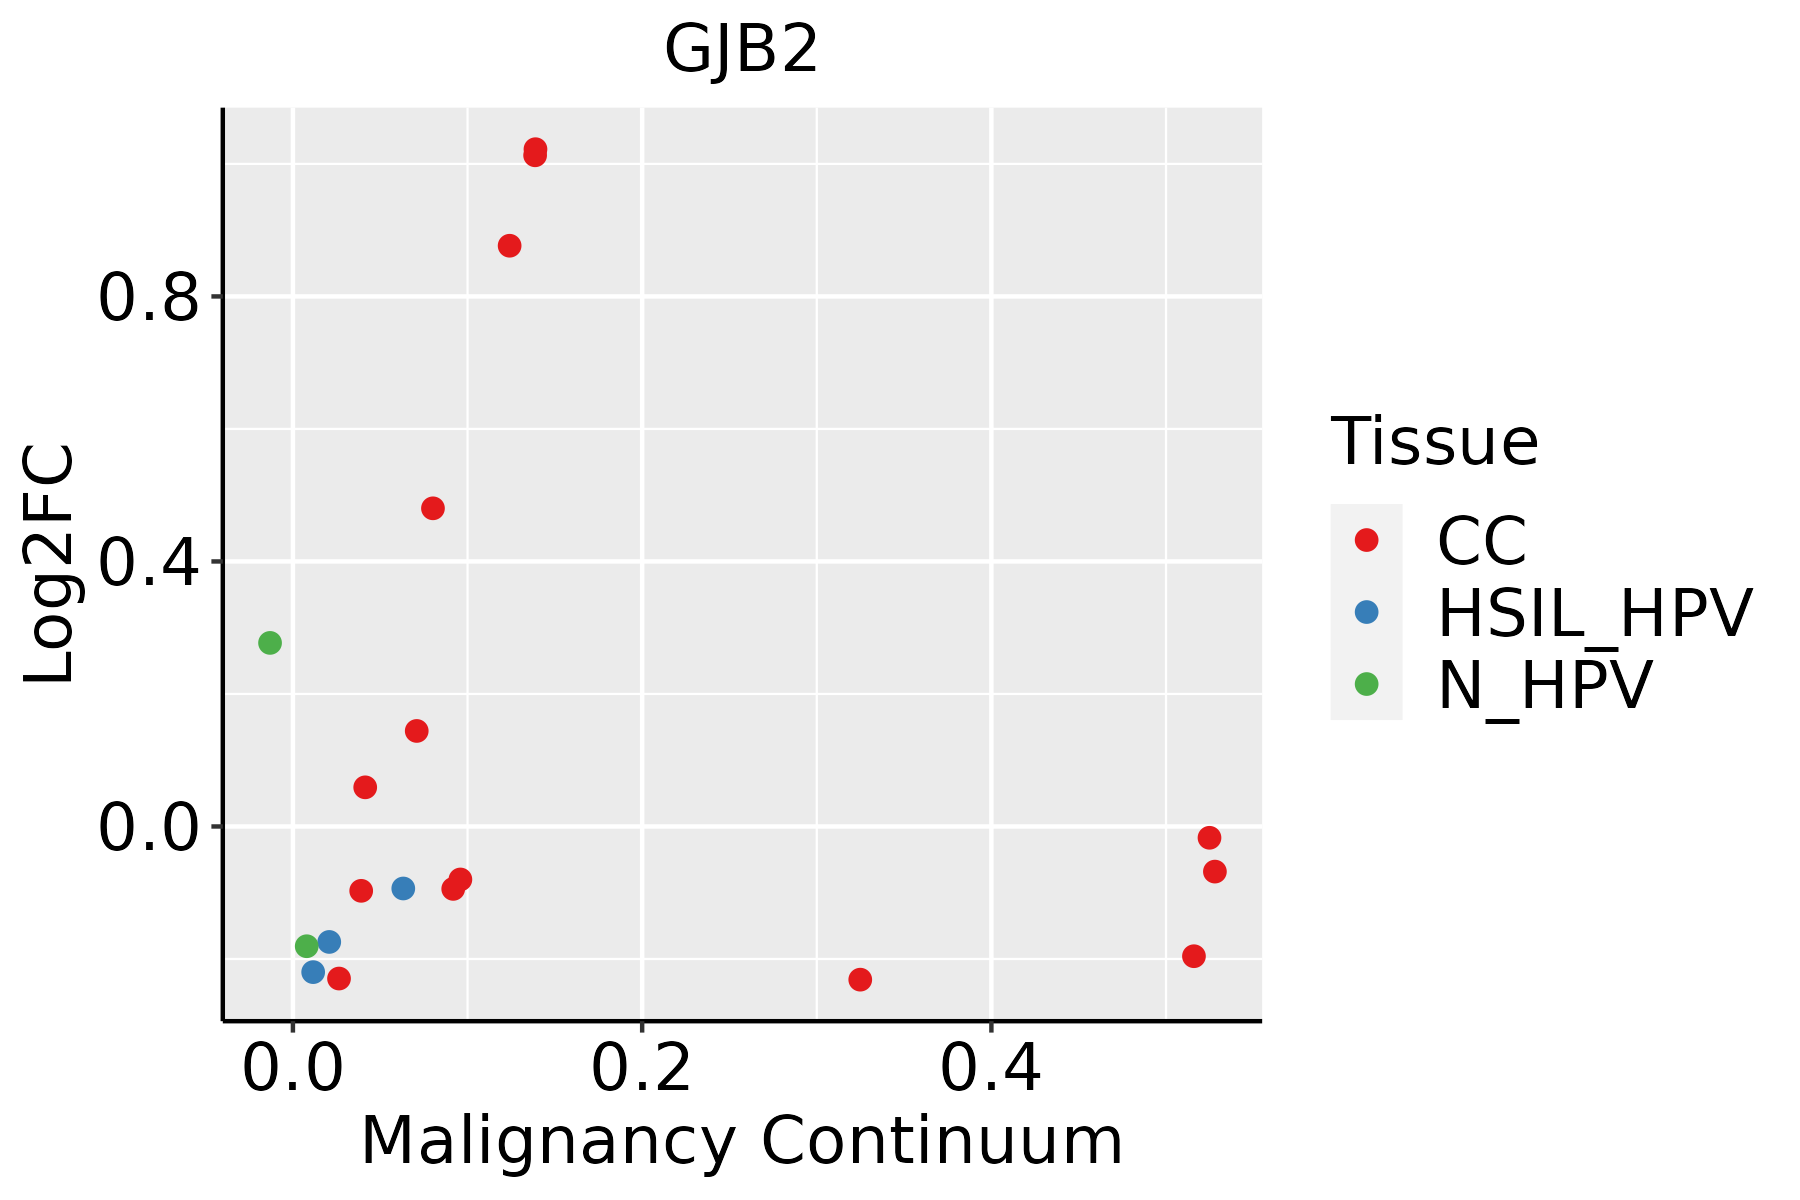 | CC: Cervix cancer |
| HSIL_HPV: HPV-infected high-grade squamous intraepithelial lesions | ||
| N_HPV: HPV-infected normal cervix | ||
| Esophagus | 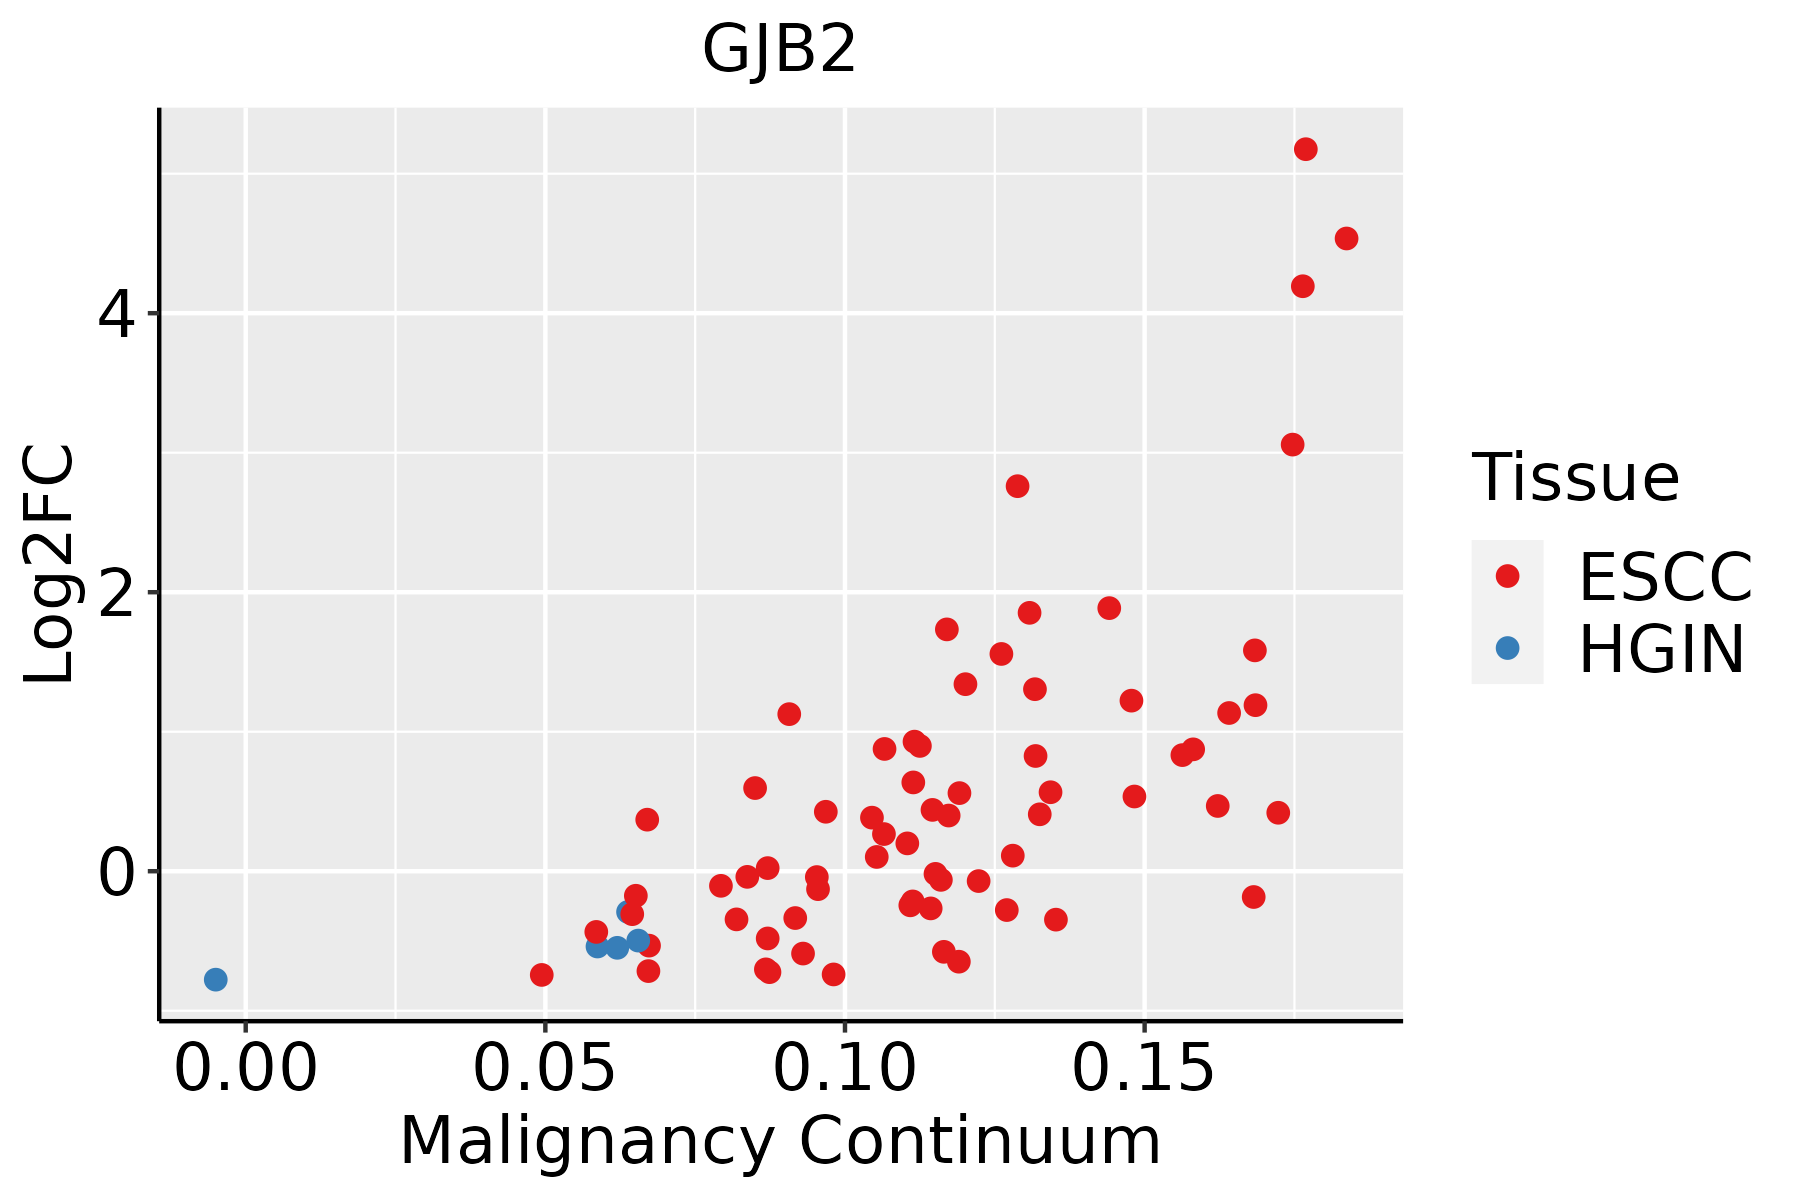 | ESCC: Esophageal squamous cell carcinoma |
| HGIN: High-grade intraepithelial neoplasias | ||
| LGIN: Low-grade intraepithelial neoplasias | ||
| Oral Cavity | 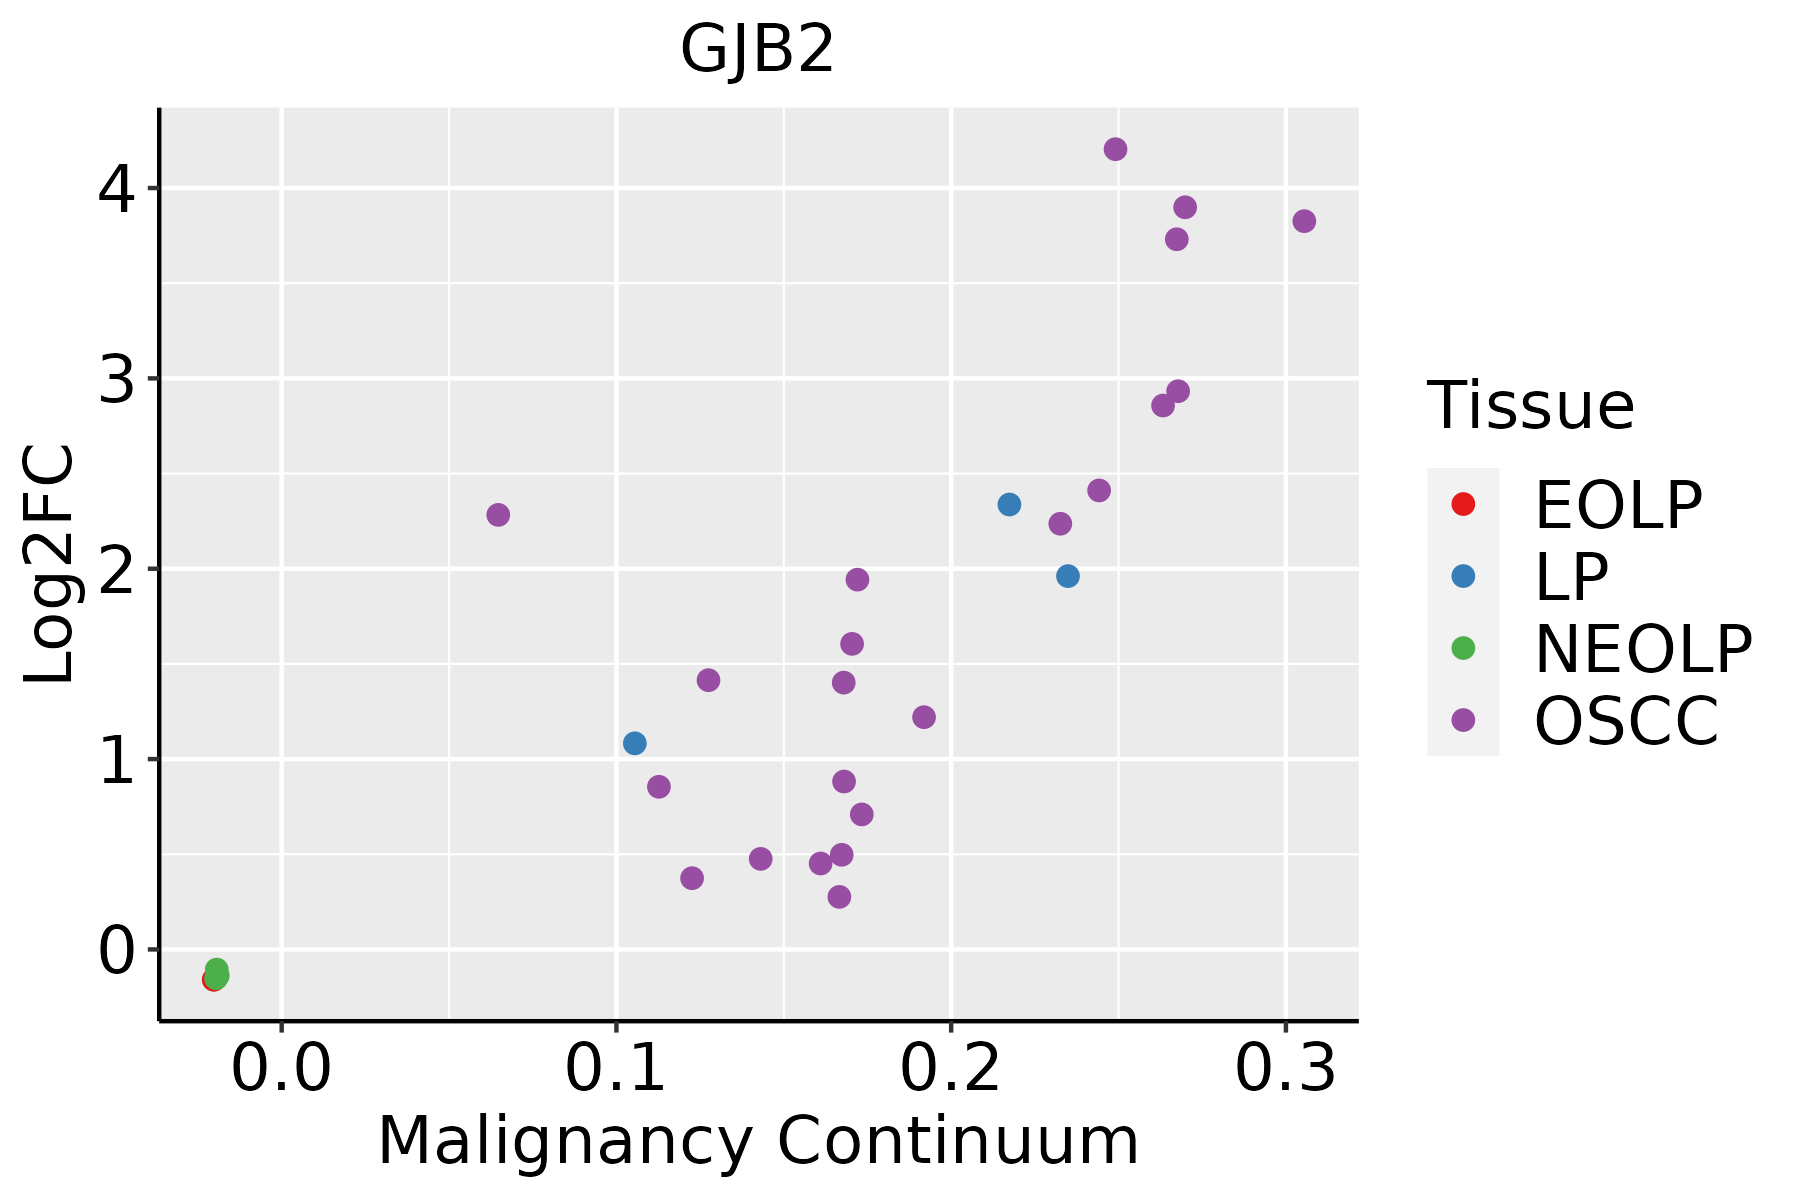 | EOLP: Erosive Oral lichen planus |
| LP: leukoplakia | ||
| NEOLP: Non-erosive oral lichen planus | ||
| OSCC: Oral squamous cell carcinoma | ||
| Skin | 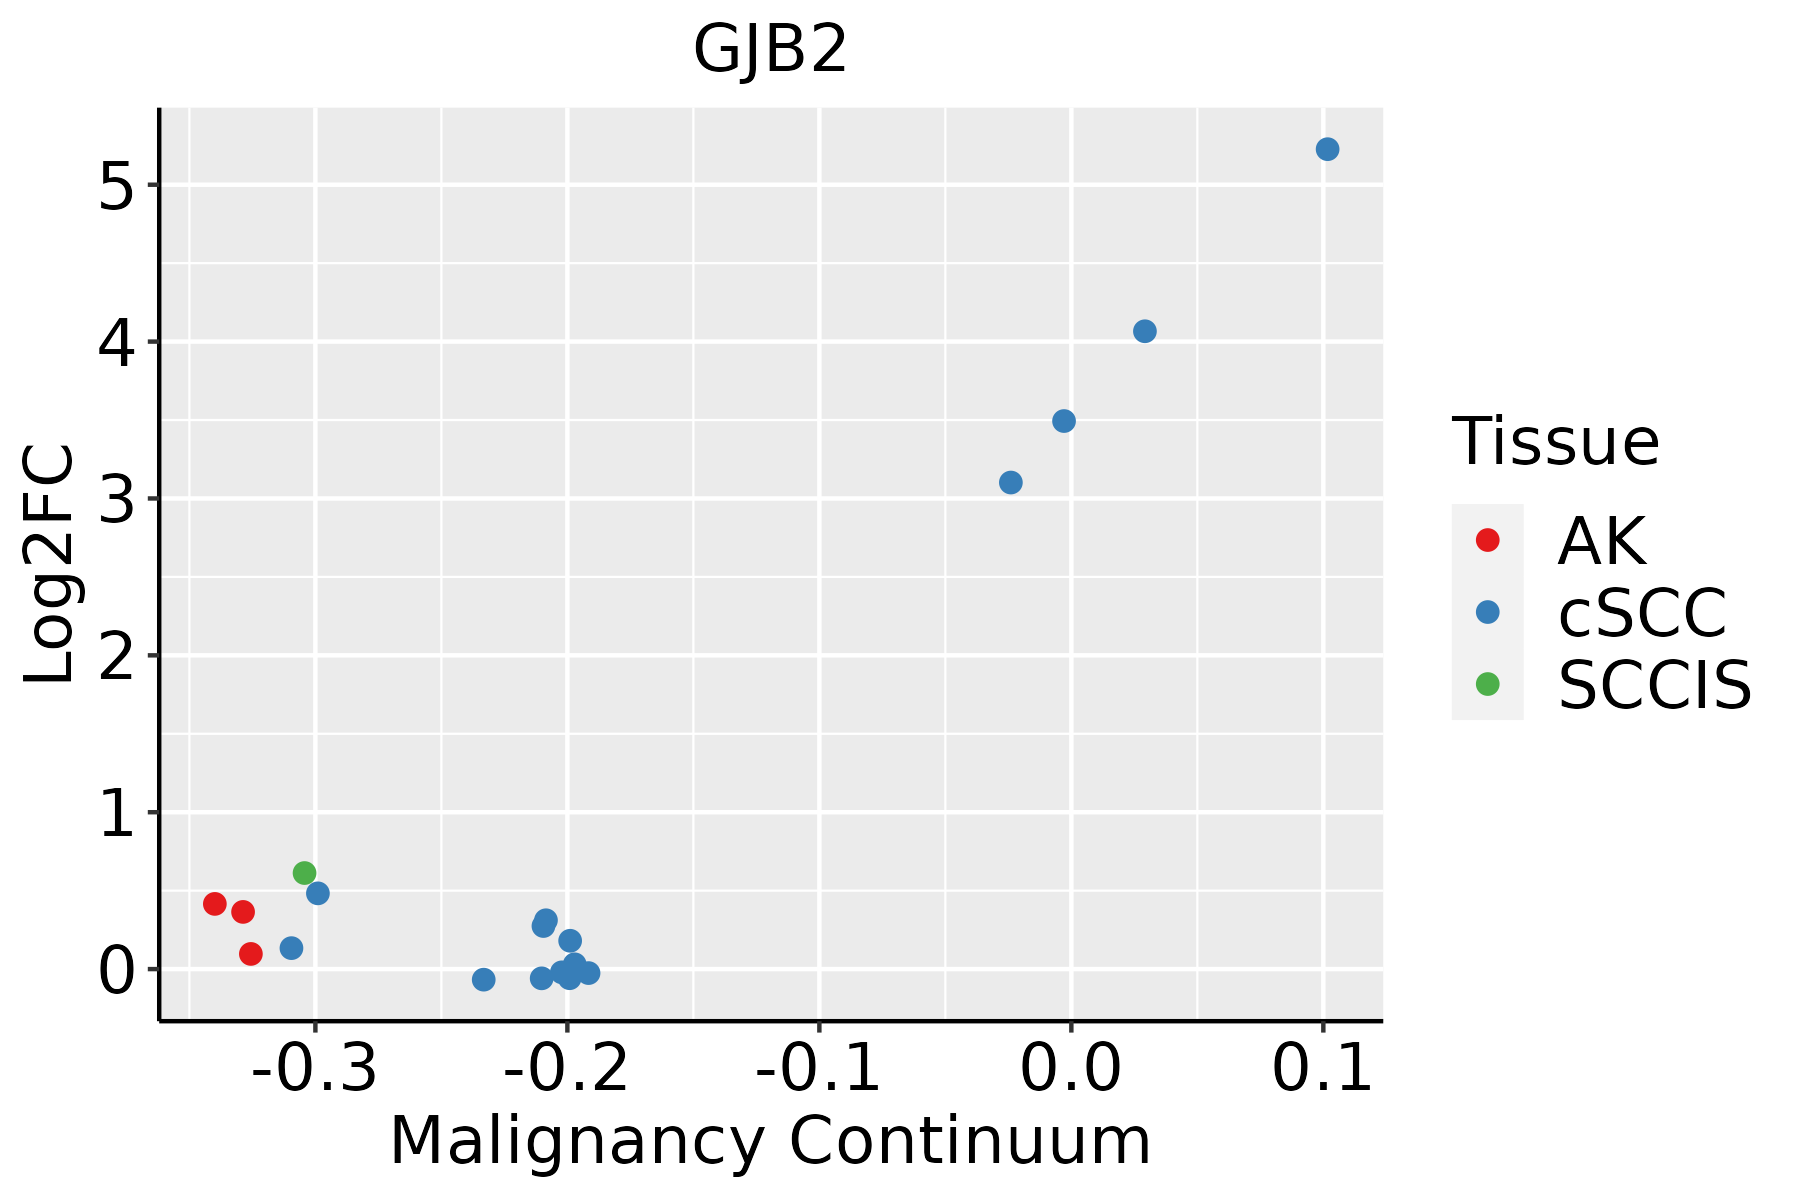 | AK: Actinic keratosis |
| cSCC: Cutaneous squamous cell carcinoma | ||
| SCCIS:squamous cell carcinoma in situ | ||
| Thyroid | 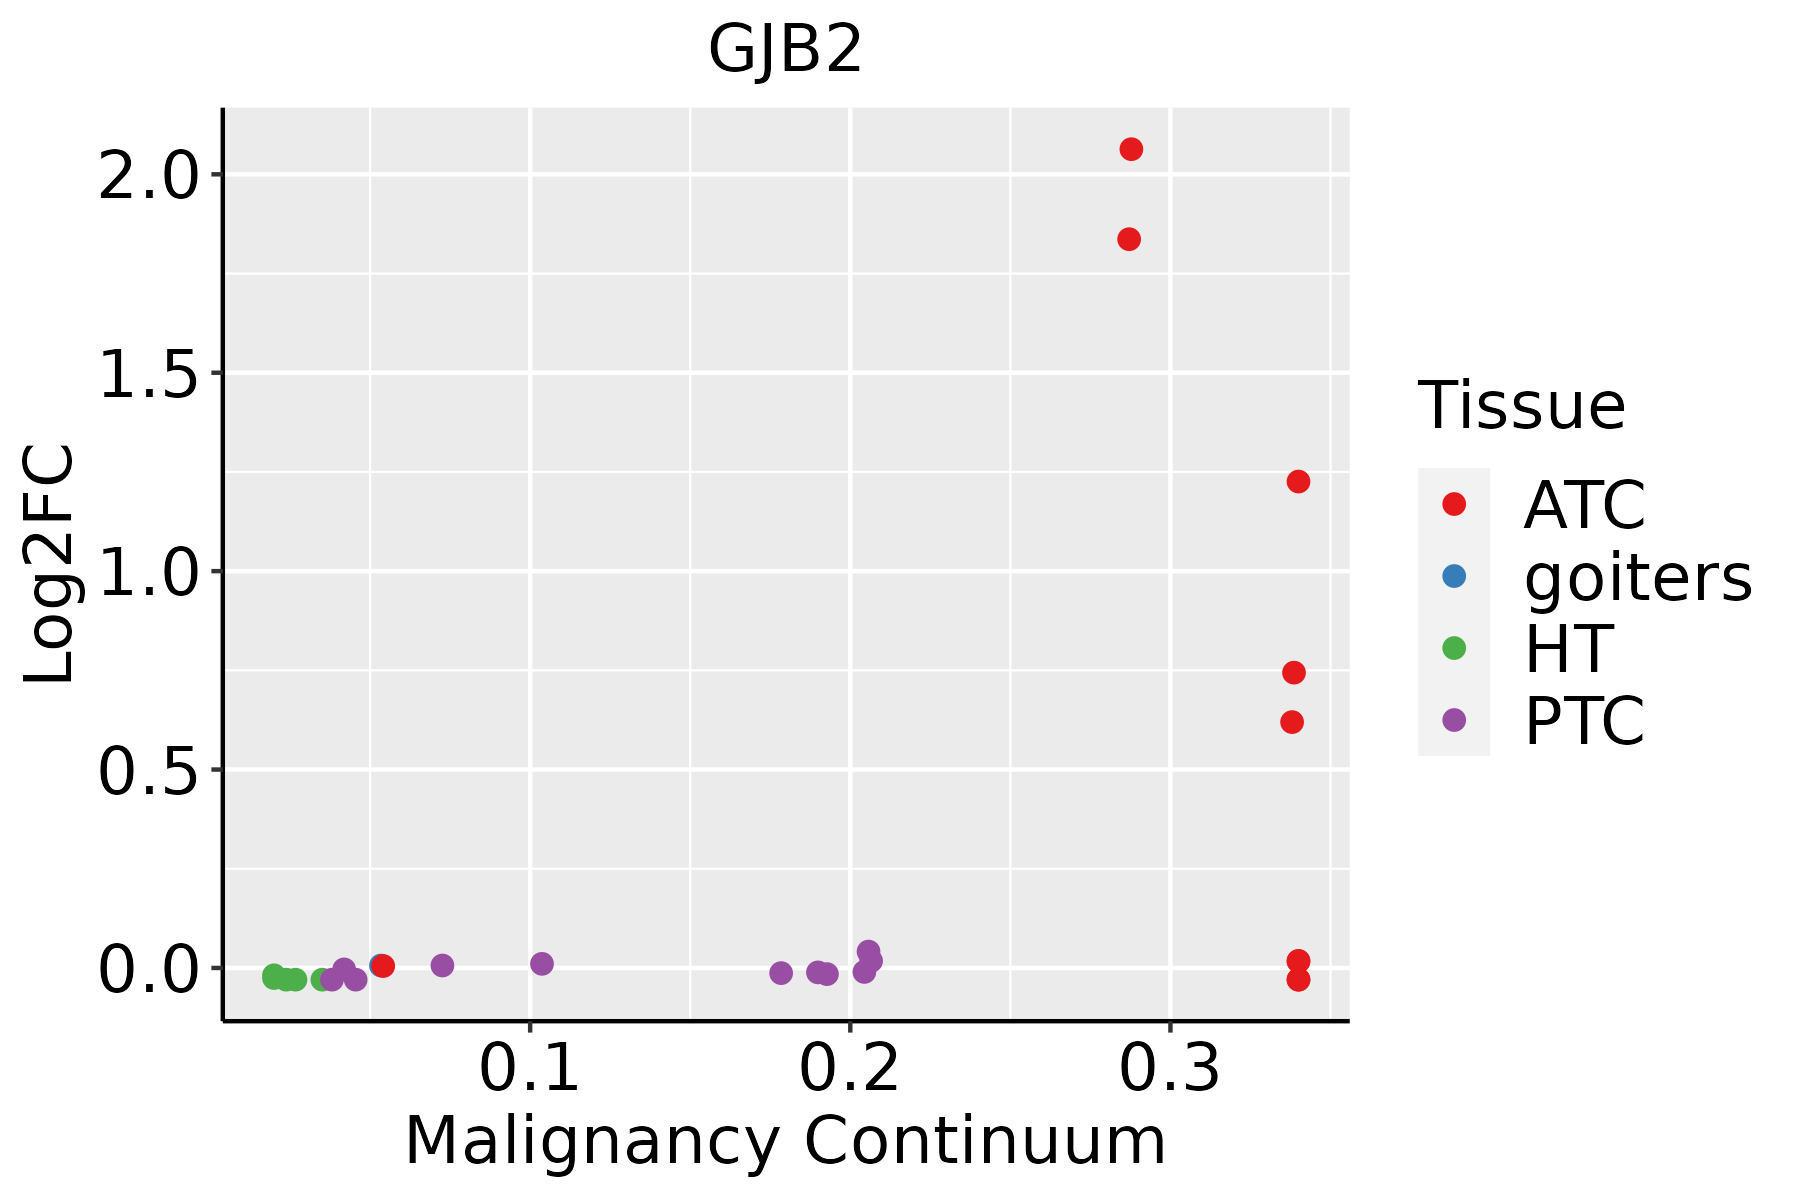 | ATC: Anaplastic thyroid cancer |
| HT: Hashimoto's thyroiditis | ||
| PTC: Papillary thyroid cancer |
| ∗log2FC in expression of this searched gene in stem-like cells from each diseased tissue sample relative to stem-like cells in normal samples in each tissue plotted against the malignancy continuum. Samples are colored based on if they are from different disease stage. |
Top |
Malignant transformation related pathway analysis |
| Find out the enriched GO biological processes and KEGG pathways involved in transition from healthy to precancer to cancer |
| Tissue | Disease Stage | Enriched GO biological Processes |
| Colorectum | AD |  |
| Colorectum | SER |  |
| Colorectum | MSS |  |
| Colorectum | MSI-H |  |
| Colorectum | FAP |  |
| ∗Top 15 enriched GO BP terms are showed in the bar plot of each disease state in each tissue. Each row represents a significant GO biological process which is colored according to the -log10(p.adjust). |
| Page: 1 2 3 4 5 6 7 8 9 |
| GO ID | Tissue | Disease Stage | Description | Gene Ratio | Bg Ratio | pvalue | p.adjust | Count |
| GO:000704319 | Skin | AK | cell-cell junction assembly | 36/1910 | 146/18723 | 3.88e-07 | 1.47e-05 | 36 |
| GO:006145820 | Skin | AK | reproductive system development | 77/1910 | 427/18723 | 4.76e-07 | 1.74e-05 | 77 |
| GO:190165425 | Skin | AK | response to ketone | 43/1910 | 194/18723 | 7.32e-07 | 2.49e-05 | 43 |
| GO:000756826 | Skin | AK | aging | 63/1910 | 339/18723 | 1.83e-06 | 5.42e-05 | 63 |
| GO:003196025 | Skin | AK | response to corticosteroid | 37/1910 | 167/18723 | 4.28e-06 | 1.05e-04 | 37 |
| GO:000189020 | Skin | AK | placenta development | 33/1910 | 144/18723 | 6.49e-06 | 1.47e-04 | 33 |
| GO:005138425 | Skin | AK | response to glucocorticoid | 33/1910 | 148/18723 | 1.20e-05 | 2.46e-04 | 33 |
| GO:003459927 | Skin | AK | cellular response to oxidative stress | 53/1910 | 288/18723 | 1.56e-05 | 3.05e-04 | 53 |
| GO:004343425 | Skin | AK | response to peptide hormone | 69/1910 | 414/18723 | 2.87e-05 | 4.98e-04 | 69 |
| GO:007137517 | Skin | AK | cellular response to peptide hormone stimulus | 52/1910 | 290/18723 | 3.86e-05 | 6.35e-04 | 52 |
| GO:00325709 | Skin | AK | response to progesterone | 13/1910 | 37/18723 | 4.21e-05 | 6.70e-04 | 13 |
| GO:190165320 | Skin | AK | cellular response to peptide | 61/1910 | 359/18723 | 4.60e-05 | 7.21e-04 | 61 |
| GO:003235510 | Skin | AK | response to estradiol | 30/1910 | 141/18723 | 7.41e-05 | 1.06e-03 | 30 |
| GO:007138510 | Skin | AK | cellular response to glucocorticoid stimulus | 16/1910 | 56/18723 | 1.02e-04 | 1.34e-03 | 16 |
| GO:007138410 | Skin | AK | cellular response to corticosteroid stimulus | 16/1910 | 61/18723 | 3.03e-04 | 3.12e-03 | 16 |
| GO:00715497 | Skin | AK | cellular response to dexamethasone stimulus | 10/1910 | 29/18723 | 3.86e-04 | 3.70e-03 | 10 |
| GO:003249620 | Skin | AK | response to lipopolysaccharide | 55/1910 | 343/18723 | 4.79e-04 | 4.44e-03 | 55 |
| GO:00106448 | Skin | AK | cell communication by electrical coupling | 10/1910 | 32/18723 | 9.35e-04 | 7.56e-03 | 10 |
| GO:00325262 | Skin | AK | response to retinoic acid | 22/1910 | 107/18723 | 1.04e-03 | 8.17e-03 | 22 |
| GO:00075658 | Skin | AK | female pregnancy | 34/1910 | 193/18723 | 1.09e-03 | 8.48e-03 | 34 |
| Page: 1 2 3 4 5 6 7 8 9 10 11 12 |
| Pathway ID | Tissue | Disease Stage | Description | Gene Ratio | Bg Ratio | pvalue | p.adjust | qvalue | Count |
| Page: 1 |
Top |
Cell-cell communication analysis |
| Identification of potential cell-cell interactions between two cell types and their ligand-receptor pairs for different disease states |
| Ligand | Receptor | LRpair | Pathway | Tissue | Disease Stage |
| Page: 1 |
Top |
Single-cell gene regulatory network inference analysis |
| Find out the significant the regulons (TFs) and the target genes of each regulon across cell types for different disease states |
| TF | Cell Type | Tissue | Disease Stage | Target Gene | RSS | Regulon Activity |
| ∗The dot plots of a searched regulon are shown for all cell subpopulations in each disease state of each tissue based on the regulon specific score inferred using pySCENIC and by calculating the average expression. |
| Page: 1 |
Top |
Somatic mutation of malignant transformation related genes |
| Annotation of somatic variants for genes involved in malignant transformation |
| Hugo Symbol | Variant Class | Variant Classification | dbSNP RS | HGVSc | HGVSp | HGVSp Short | SWISSPROT | BIOTYPE | SIFT | PolyPhen | Tumor Sample Barcode | Tissue | Histology | Sex | Age | Stage | Therapy Types | Drugs | Outcome |
| GJB2 | SNV | Missense_Mutation | c.438N>G | p.Phe146Leu | p.F146L | P29033 | protein_coding | tolerated(0.16) | benign(0.187) | TCGA-A1-A0SJ-01 | Breast | breast invasive carcinoma | Female | <65 | III/IV | Unknown | Unknown | SD | |
| GJB2 | SNV | Missense_Mutation | c.599G>T | p.Gly200Val | p.G200V | P29033 | protein_coding | tolerated(0.52) | benign(0.044) | TCGA-C8-A275-01 | Breast | breast invasive carcinoma | Female | <65 | I/II | Unknown | Unknown | SD | |
| GJB2 | SNV | Missense_Mutation | rs80338950 | c.551G>A | p.Arg184Gln | p.R184Q | P29033 | protein_coding | deleterious(0) | probably_damaging(1) | TCGA-C5-A8XH-01 | Cervix | cervical & endocervical cancer | Female | <65 | I/II | Unknown | Unknown | SD |
| GJB2 | insertion | Frame_Shift_Ins | novel | c.671dupA | p.Pro225AlafsTer32 | p.P225Afs*32 | P29033 | protein_coding | TCGA-D5-6927-01 | Colorectum | colon adenocarcinoma | Male | <65 | I/II | Unknown | Unknown | SD | ||
| GJB2 | SNV | Missense_Mutation | rs376898963 | c.493N>T | p.Arg165Trp | p.R165W | P29033 | protein_coding | tolerated(0.07) | benign(0.246) | TCGA-A5-A0G2-01 | Endometrium | uterine corpus endometrioid carcinoma | Female | <65 | III/IV | Unknown | Unknown | SD |
| GJB2 | SNV | Missense_Mutation | novel | c.25N>G | p.Ile9Val | p.I9V | P29033 | protein_coding | tolerated(0.24) | benign(0) | TCGA-AJ-A3EK-01 | Endometrium | uterine corpus endometrioid carcinoma | Female | <65 | I/II | Chemotherapy | carboplatin | CR |
| GJB2 | SNV | Missense_Mutation | novel | c.48N>A | p.His16Gln | p.H16Q | P29033 | protein_coding | deleterious(0) | possibly_damaging(0.892) | TCGA-AJ-A3EL-01 | Endometrium | uterine corpus endometrioid carcinoma | Female | <65 | I/II | Unknown | Unknown | SD |
| GJB2 | SNV | Missense_Mutation | rs104894401 | c.428N>A | p.Arg143Gln | p.R143Q | P29033 | protein_coding | deleterious(0) | probably_damaging(0.983) | TCGA-AJ-A3NG-01 | Endometrium | uterine corpus endometrioid carcinoma | Female | >=65 | I/II | Unknown | Unknown | SD |
| GJB2 | SNV | Missense_Mutation | c.31G>A | p.Gly11Arg | p.G11R | P29033 | protein_coding | deleterious(0.02) | probably_damaging(0.949) | TCGA-AP-A0LT-01 | Endometrium | uterine corpus endometrioid carcinoma | Female | <65 | I/II | Unknown | Unknown | SD | |
| GJB2 | SNV | Missense_Mutation | c.450N>A | p.Phe150Leu | p.F150L | P29033 | protein_coding | deleterious(0) | probably_damaging(0.999) | TCGA-B5-A0JY-01 | Endometrium | uterine corpus endometrioid carcinoma | Female | <65 | III/IV | Chemotherapy | doxorubicin | SD |
| Page: 1 2 |
Top |
Related drugs of malignant transformation related genes |
| Identification of chemicals and drugs interact with genes involved in malignant transfromation |
| (DGIdb 4.0) |
| Entrez ID | Symbol | Category | Interaction Types | Drug Claim Name | Drug Name | PMIDs |
| 2706 | GJB2 | ION CHANNEL, TRANSPORTER | inhibitor | 135652731 | ||
| 2706 | GJB2 | ION CHANNEL, TRANSPORTER | inhibitor | 178100972 | CARBENOXOLONE | |
| 2706 | GJB2 | ION CHANNEL, TRANSPORTER | inhibitor | 178101095 | OCTANOL | |
| 2706 | GJB2 | ION CHANNEL, TRANSPORTER | inhibitor | 135650269 |
| Page: 1 |

Copyright 2023-Present -The University of Texas Health Science Center at Houston |