| GO ID | Tissue | Disease Stage | Description | Gene Ratio | Bg Ratio | pvalue | p.adjust | Count |
| GO:004244511 | Liver | Cirrhotic | hormone metabolic process | 73/4634 | 218/18723 | 2.22e-03 | 1.36e-02 | 73 |
| GO:003526411 | Liver | Cirrhotic | multicellular organism growth | 47/4634 | 132/18723 | 3.40e-03 | 1.89e-02 | 47 |
| GO:007190011 | Liver | Cirrhotic | regulation of protein serine/threonine kinase activity | 110/4634 | 359/18723 | 6.19e-03 | 3.08e-02 | 110 |
| GO:004586011 | Liver | Cirrhotic | positive regulation of protein kinase activity | 117/4634 | 386/18723 | 7.07e-03 | 3.41e-02 | 117 |
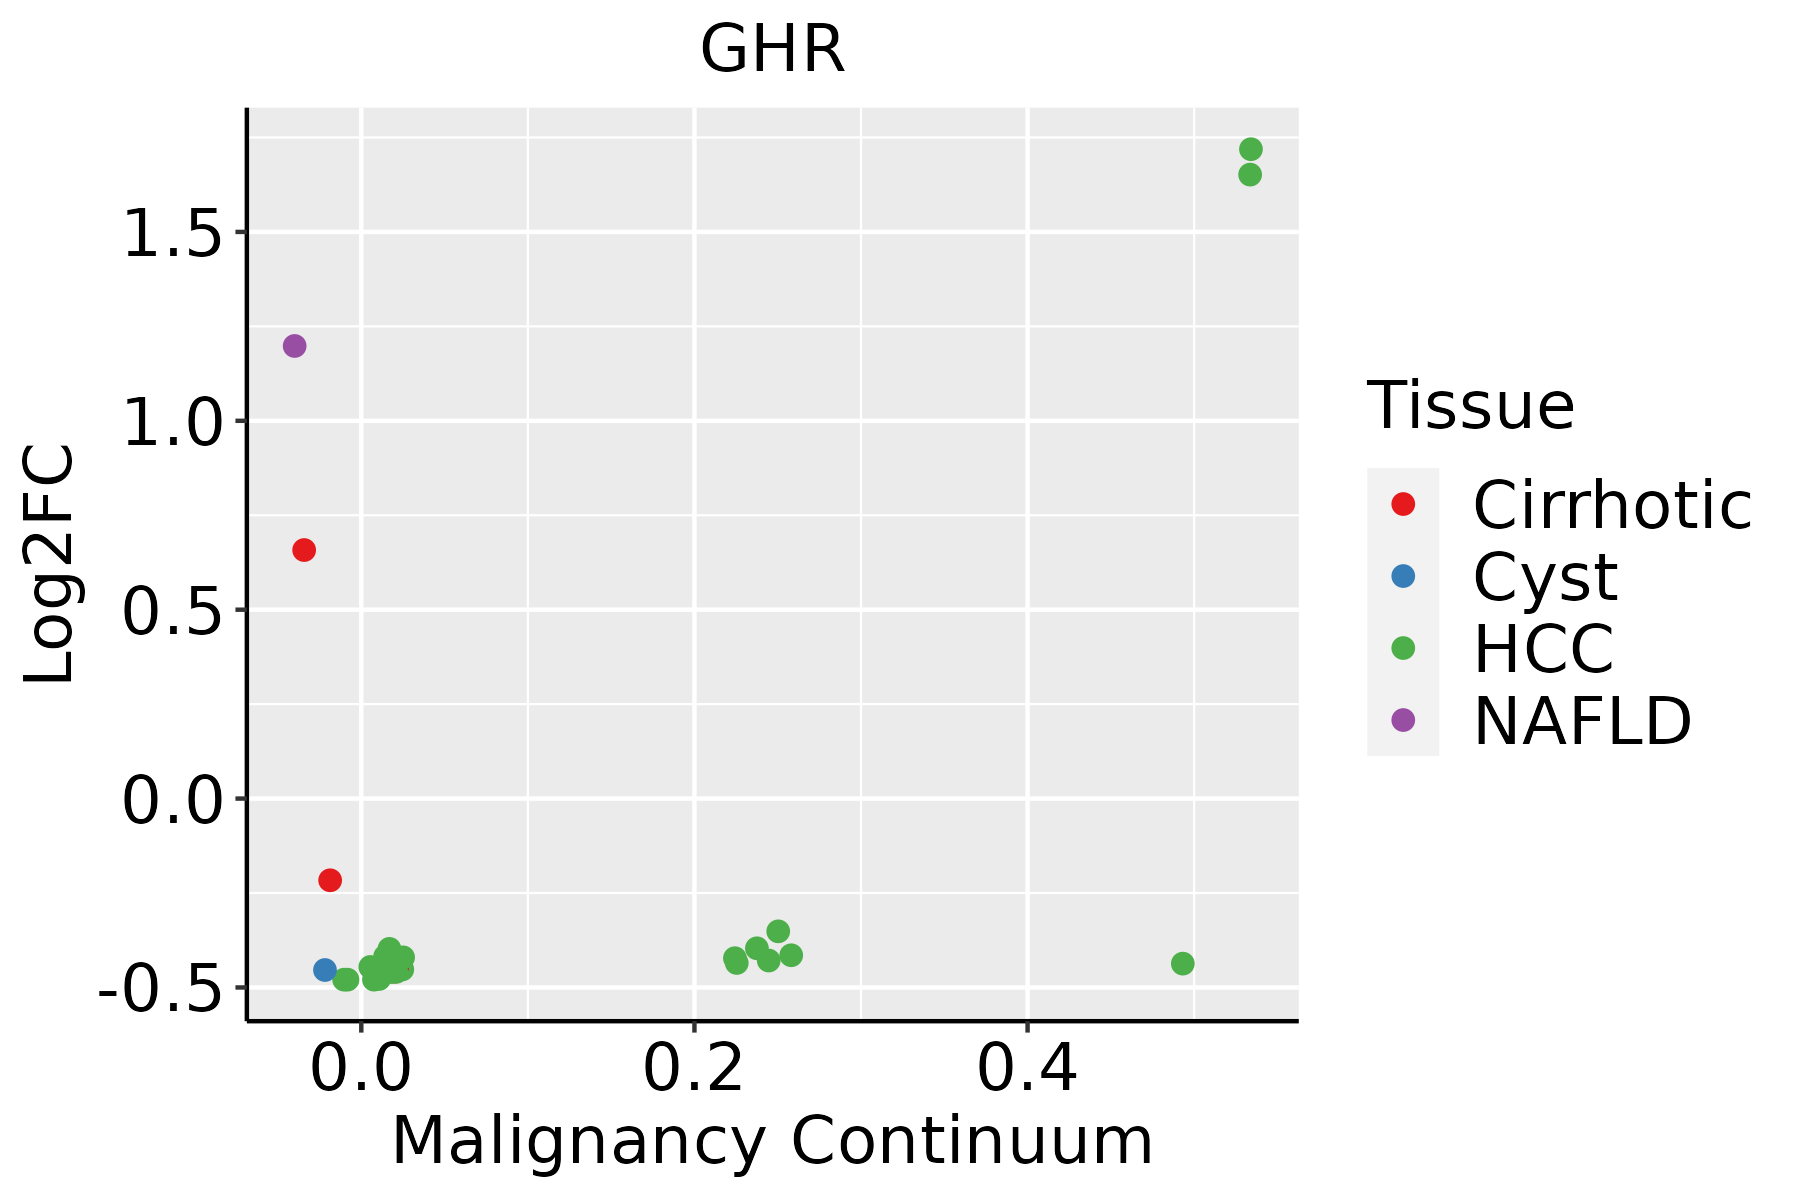
| GO:000679021 | Liver | HCC | sulfur compound metabolic process | 212/7958 | 339/18723 | 5.60e-14 | 3.39e-12 | 212 |
| GO:003286821 | Liver | HCC | response to insulin | 172/7958 | 264/18723 | 7.14e-14 | 4.23e-12 | 172 |
| GO:003286921 | Liver | HCC | cellular response to insulin stimulus | 137/7958 | 203/18723 | 4.69e-13 | 2.44e-11 | 137 |
| GO:004343422 | Liver | HCC | response to peptide hormone | 247/7958 | 414/18723 | 9.55e-13 | 4.77e-11 | 247 |
| GO:003166722 | Liver | HCC | response to nutrient levels | 276/7958 | 474/18723 | 2.30e-12 | 1.08e-10 | 276 |
| GO:004854522 | Liver | HCC | response to steroid hormone | 206/7958 | 339/18723 | 6.81e-12 | 2.92e-10 | 206 |
| GO:007137521 | Liver | HCC | cellular response to peptide hormone stimulus | 179/7958 | 290/18723 | 2.54e-11 | 9.88e-10 | 179 |
| GO:190165321 | Liver | HCC | cellular response to peptide | 211/7958 | 359/18723 | 2.86e-10 | 9.63e-09 | 211 |
| GO:007099722 | Liver | HCC | neuron death | 202/7958 | 361/18723 | 1.44e-07 | 2.70e-06 | 202 |
| GO:190121412 | Liver | HCC | regulation of neuron death | 179/7958 | 319/18723 | 5.65e-07 | 9.01e-06 | 179 |
| GO:005138421 | Liver | HCC | response to glucocorticoid | 90/7958 | 148/18723 | 5.18e-06 | 6.47e-05 | 90 |
| GO:003196021 | Liver | HCC | response to corticosteroid | 98/7958 | 167/18723 | 1.73e-05 | 1.87e-04 | 98 |
| GO:007190021 | Liver | HCC | regulation of protein serine/threonine kinase activity | 189/7958 | 359/18723 | 5.97e-05 | 5.47e-04 | 189 |
| GO:000975521 | Liver | HCC | hormone-mediated signaling pathway | 106/7958 | 190/18723 | 1.45e-04 | 1.17e-03 | 106 |
| GO:190121512 | Liver | HCC | negative regulation of neuron death | 113/7958 | 208/18723 | 3.68e-04 | 2.54e-03 | 113 |
| GO:00705551 | Liver | HCC | response to interleukin-1 | 80/7958 | 143/18723 | 7.95e-04 | 4.77e-03 | 80 |
| Pathway ID | Tissue | Disease Stage | Description | Gene Ratio | Bg Ratio | pvalue | p.adjust | qvalue | Count |
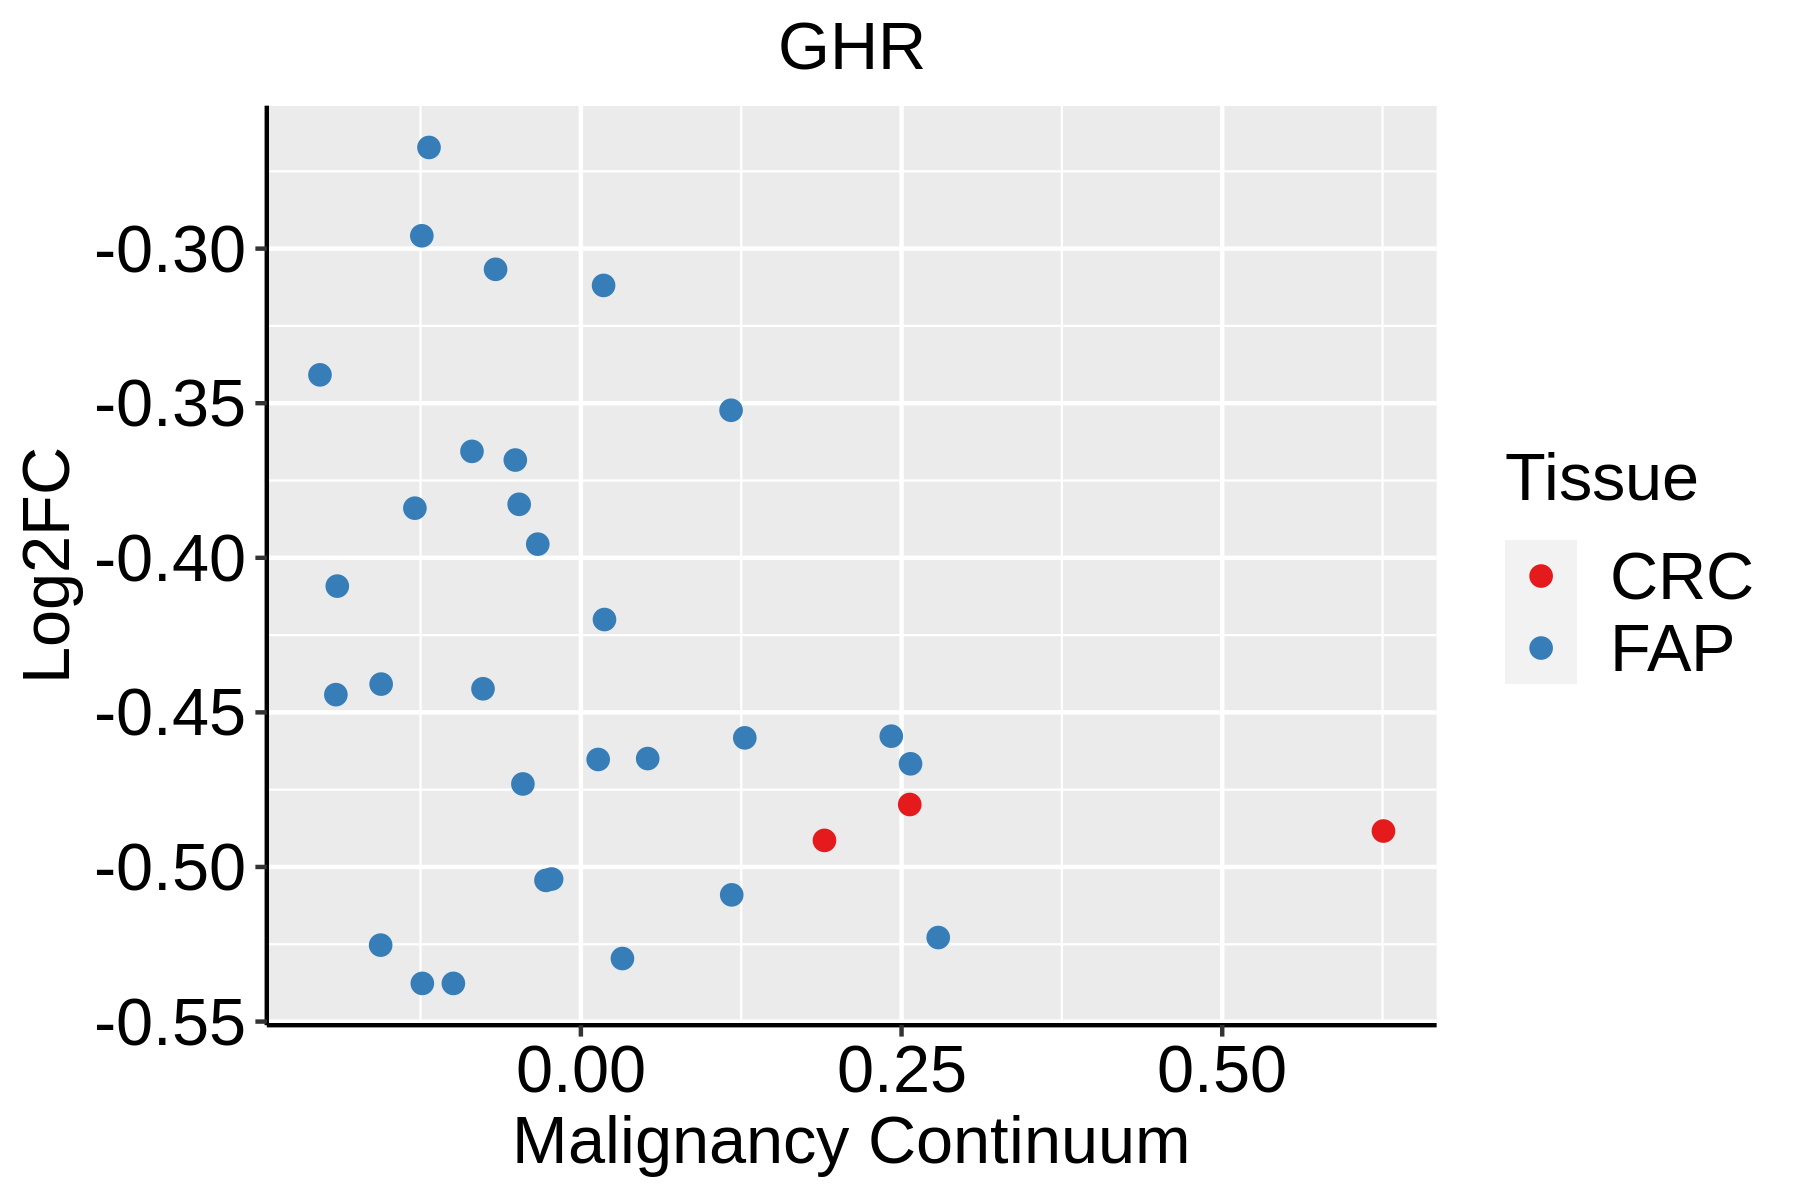
| hsa04935 | Colorectum | MSS | Growth hormone synthesis, secretion and action | 42/1875 | 120/8465 | 8.17e-04 | 5.16e-03 | 3.16e-03 | 42 |
| hsa049351 | Colorectum | MSS | Growth hormone synthesis, secretion and action | 42/1875 | 120/8465 | 8.17e-04 | 5.16e-03 | 3.16e-03 | 42 |
| hsa049352 | Colorectum | FAP | Growth hormone synthesis, secretion and action | 34/1404 | 120/8465 | 8.12e-04 | 5.14e-03 | 3.13e-03 | 34 |
| hsa04151 | Colorectum | FAP | PI3K-Akt signaling pathway | 75/1404 | 354/8465 | 1.23e-02 | 4.19e-02 | 2.55e-02 | 75 |
| hsa049353 | Colorectum | FAP | Growth hormone synthesis, secretion and action | 34/1404 | 120/8465 | 8.12e-04 | 5.14e-03 | 3.13e-03 | 34 |
| hsa041511 | Colorectum | FAP | PI3K-Akt signaling pathway | 75/1404 | 354/8465 | 1.23e-02 | 4.19e-02 | 2.55e-02 | 75 |
| hsa049354 | Colorectum | CRC | Growth hormone synthesis, secretion and action | 27/1091 | 120/8465 | 2.37e-03 | 1.69e-02 | 1.14e-02 | 27 |
| hsa041512 | Colorectum | CRC | PI3K-Akt signaling pathway | 64/1091 | 354/8465 | 2.70e-03 | 1.77e-02 | 1.20e-02 | 64 |
| hsa049355 | Colorectum | CRC | Growth hormone synthesis, secretion and action | 27/1091 | 120/8465 | 2.37e-03 | 1.69e-02 | 1.14e-02 | 27 |
| hsa041513 | Colorectum | CRC | PI3K-Akt signaling pathway | 64/1091 | 354/8465 | 2.70e-03 | 1.77e-02 | 1.20e-02 | 64 |
| Hugo Symbol | Variant Class | Variant Classification | dbSNP RS | HGVSc | HGVSp | HGVSp Short | SWISSPROT | BIOTYPE | SIFT | PolyPhen | Tumor Sample Barcode | Tissue | Histology | Sex | Age | Stage | Therapy Types | Drugs | Outcome |
| GHR | SNV | Missense_Mutation | | c.1288N>A | p.Leu430Ile | p.L430I | | protein_coding | deleterious(0.03) | possibly_damaging(0.506) | TCGA-AN-A046-01 | Breast | breast invasive carcinoma | Female | >=65 | I/II | Unknown | Unknown | SD |
| GHR | SNV | Missense_Mutation | novel | c.1859N>T | p.Ala620Val | p.A620V | | protein_coding | tolerated(0.24) | probably_damaging(0.998) | TCGA-AN-A046-01 | Breast | breast invasive carcinoma | Female | >=65 | I/II | Unknown | Unknown | SD |
| GHR | SNV | Missense_Mutation | | c.402N>G | p.Ile134Met | p.I134M | | protein_coding | tolerated(0.38) | probably_damaging(0.985) | TCGA-AO-A03V-01 | Breast | breast invasive carcinoma | Female | <65 | I/II | Chemotherapy | fluorouracil | SD |
| GHR | insertion | Nonsense_Mutation | novel | c.151_152insCCTTAGCCCCGAGGTAGTGTCTAGGGGTGGGGTGCCTGCAACCCC | p.Lys51delinsThrLeuAlaProArgTerCysLeuGlyValGlyCysLeuGlnProGln | p.K51delinsTLAPR*CLGVGCLQPQ | | protein_coding | | | TCGA-AN-A04C-01 | Breast | breast invasive carcinoma | Female | <65 | I/II | Unknown | Unknown | SD |
| GHR | insertion | Frame_Shift_Ins | novel | c.1715_1716insCAAAATGAGATCTATG | p.Tyr573LysfsTer29 | p.Y573Kfs*29 | | protein_coding | | | TCGA-AO-A03R-01 | Breast | breast invasive carcinoma | Female | <65 | I/II | Chemotherapy | doxorubicin | SD |
| GHR | insertion | Frame_Shift_Ins | novel | c.804_805insT | p.Asp269Ter | p.D269* | | protein_coding | | | TCGA-AO-A128-01 | Breast | breast invasive carcinoma | Female | <65 | I/II | Chemotherapy | doxorubicin | SD |
| GHR | deletion | Frame_Shift_Del | novel | c.302delN | p.Trp101Ter | p.W101* | | protein_coding | | | TCGA-D8-A27V-01 | Breast | breast invasive carcinoma | Female | <65 | I/II | Hormone Therapy | tamoxiphen | SD |
| GHR | SNV | Missense_Mutation | | c.113G>C | p.Arg38Thr | p.R38T | | protein_coding | tolerated_low_confidence(0.26) | benign(0.075) | TCGA-EA-A3HQ-01 | Cervix | cervical & endocervical cancer | Female | <65 | I/II | Unknown | Unknown | SD |
| GHR | SNV | Missense_Mutation | | c.1759N>A | p.Gly587Arg | p.G587R | | protein_coding | tolerated(0.36) | possibly_damaging(0.453) | TCGA-EK-A2GZ-01 | Cervix | cervical & endocervical cancer | Female | <65 | III/IV | Unknown | Unknown | SD |
| GHR | SNV | Missense_Mutation | rs775194712 | c.1853C>T | p.Ala618Val | p.A618V | | protein_coding | deleterious(0.02) | probably_damaging(0.974) | TCGA-EX-A3L1-01 | Cervix | cervical & endocervical cancer | Female | <65 | I/II | Chemotherapy | cisplatin | CR |
| Entrez ID | Symbol | Category | Interaction Types | Drug Claim Name | Drug Name | PMIDs |
| 2690 | GHR | DRUGGABLE GENOME, EXTERNAL SIDE OF PLASMA MEMBRANE, CELL SURFACE | | Syntropin | | |
| 2690 | GHR | DRUGGABLE GENOME, EXTERNAL SIDE OF PLASMA MEMBRANE, CELL SURFACE | | EP-51216 | | |
| 2690 | GHR | DRUGGABLE GENOME, EXTERNAL SIDE OF PLASMA MEMBRANE, CELL SURFACE | | ACCCRETROPIN | | |
| 2690 | GHR | DRUGGABLE GENOME, EXTERNAL SIDE OF PLASMA MEMBRANE, CELL SURFACE | | BVT-A | | |
| 2690 | GHR | DRUGGABLE GENOME, EXTERNAL SIDE OF PLASMA MEMBRANE, CELL SURFACE | | Pegvisomant | PEGVISOMANT | |
| 2690 | GHR | DRUGGABLE GENOME, EXTERNAL SIDE OF PLASMA MEMBRANE, CELL SURFACE | | ACP-001 | ACP-001 | |
| 2690 | GHR | DRUGGABLE GENOME, EXTERNAL SIDE OF PLASMA MEMBRANE, CELL SURFACE | | AOD9604 | | |
| 2690 | GHR | DRUGGABLE GENOME, EXTERNAL SIDE OF PLASMA MEMBRANE, CELL SURFACE | agonist | 178101641 | | |
| 2690 | GHR | DRUGGABLE GENOME, EXTERNAL SIDE OF PLASMA MEMBRANE, CELL SURFACE | antagonist | CHEMBL1201515 | PEGVISOMANT | |
| 2690 | GHR | DRUGGABLE GENOME, EXTERNAL SIDE OF PLASMA MEMBRANE, CELL SURFACE | agonist | CHEMBL1201620 | SOMATREM | |