
|
|||||
|
 | |
| |
| |
| |
| |
| |
|
Gene: GCG |
Gene summary for GCG |
| Gene information | Species | Human | Gene symbol | GCG | Gene ID | 2641 |
| Gene name | glucagon | |
| Gene Alias | GLP-1 | |
| Cytomap | 2q24.2 | |
| Gene Type | protein-coding | GO ID | GO:0000165 | UniProtAcc | P01275 |
Top |
Malignant transformation analysis |
| Identification of the aberrant gene expression in precancerous and cancerous lesions by comparing the gene expression of stem-like cells in diseased tissues with normal stem cells |
| Entrez ID | Symbol | Replicates | Species | Organ | Tissue | Adj P-value | Log2FC | Malignancy |
| 2641 | GCG | HTA11_411_2000001011 | Human | Colorectum | SER | 2.19e-03 | 2.31e+00 | -0.2602 |
| 2641 | GCG | HTA12-23-1 | Human | Pancreas | PDAC | 3.96e-02 | 6.49e-01 | 0.3405 |
| 2641 | GCG | HTA12-26-1 | Human | Pancreas | PDAC | 2.68e-10 | 8.19e-01 | 0.3728 |
| 2641 | GCG | HTA12-29-1 | Human | Pancreas | PDAC | 4.16e-08 | 3.25e-01 | 0.3722 |
| 2641 | GCG | HTA12-9-1 | Human | Pancreas | PDAC | 2.87e-08 | 7.93e-01 | 0.1532 |
| 2641 | GCG | 4347-EC | Human | Pancreas | PanIN | 7.60e-37 | 1.19e+00 | 0.0572 |
| Page: 1 |
| Tissue | Expression Dynamics | Abbreviation |
| Colorectum (GSE201348) | 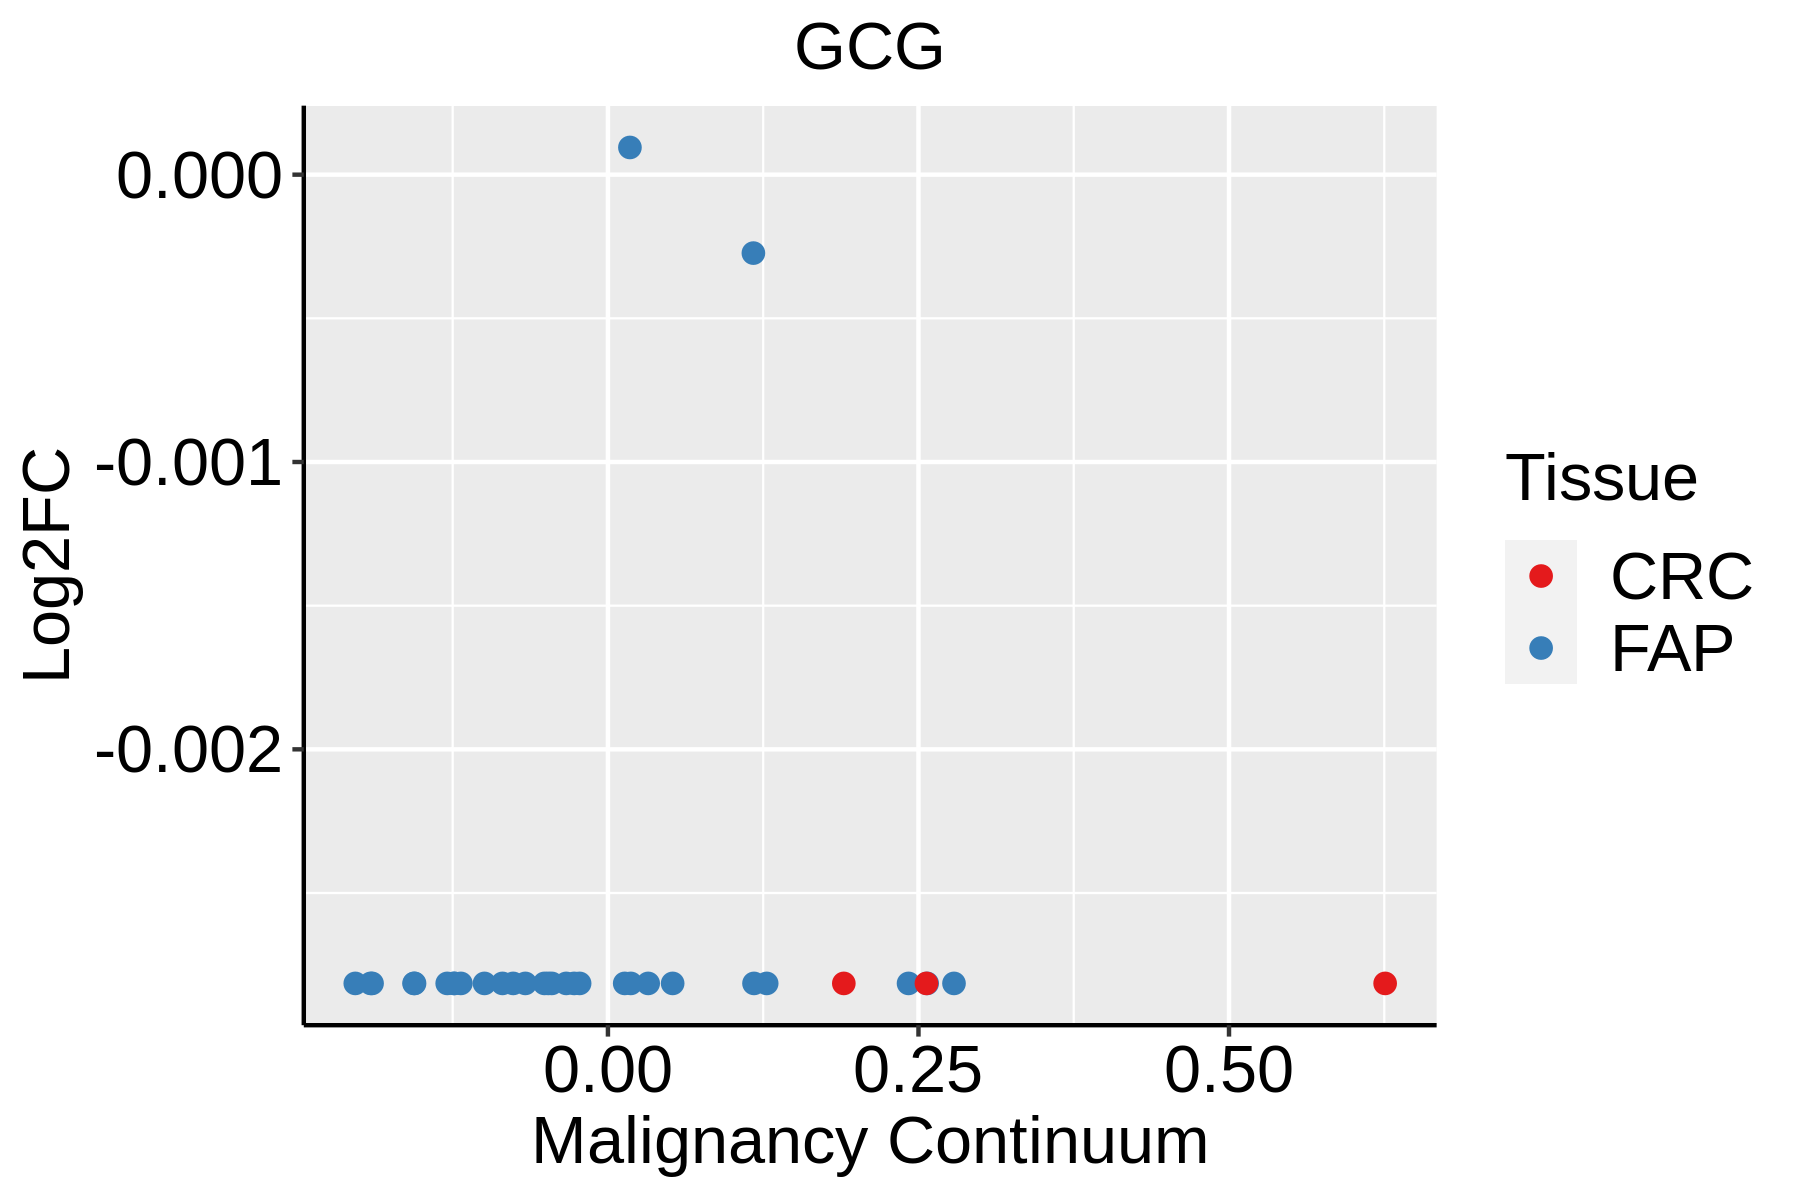 | FAP: Familial adenomatous polyposis |
| CRC: Colorectal cancer | ||
| Colorectum (HTA11) |  | AD: Adenomas |
| SER: Sessile serrated lesions | ||
| MSI-H: Microsatellite-high colorectal cancer | ||
| MSS: Microsatellite stable colorectal cancer |
| ∗log2FC in expression of this searched gene in stem-like cells from each diseased tissue sample relative to stem-like cells in normal samples in each tissue plotted against the malignancy continuum. Samples are colored based on if they are from different disease stage. |
Top |
Malignant transformation related pathway analysis |
| Find out the enriched GO biological processes and KEGG pathways involved in transition from healthy to precancer to cancer |
| Tissue | Disease Stage | Enriched GO biological Processes |
| Colorectum | AD |  |
| Colorectum | SER |  |
| Colorectum | MSS |  |
| Colorectum | MSI-H |  |
| Colorectum | FAP |  |
| ∗Top 15 enriched GO BP terms are showed in the bar plot of each disease state in each tissue. Each row represents a significant GO biological process which is colored according to the -log10(p.adjust). |
| Page: 1 2 3 4 5 6 7 8 9 |
| GO ID | Tissue | Disease Stage | Description | Gene Ratio | Bg Ratio | pvalue | p.adjust | Count |
| GO:00302165 | Prostate | BPH | keratinocyte differentiation | 38/3107 | 139/18723 | 9.35e-04 | 5.92e-03 | 38 |
| GO:00614363 | Prostate | BPH | establishment of skin barrier | 10/3107 | 25/18723 | 4.57e-03 | 2.19e-02 | 10 |
| GO:00335613 | Prostate | BPH | regulation of water loss via skin | 10/3107 | 27/18723 | 8.58e-03 | 3.68e-02 | 10 |
| GO:000854415 | Prostate | Tumor | epidermis development | 89/3246 | 324/18723 | 3.15e-06 | 5.18e-05 | 89 |
| GO:004358815 | Prostate | Tumor | skin development | 74/3246 | 263/18723 | 8.28e-06 | 1.22e-04 | 74 |
| GO:000991314 | Prostate | Tumor | epidermal cell differentiation | 58/3246 | 202/18723 | 3.99e-05 | 4.60e-04 | 58 |
| GO:003021612 | Prostate | Tumor | keratinocyte differentiation | 41/3246 | 139/18723 | 2.73e-04 | 2.24e-03 | 41 |
| GO:007170912 | Prostate | Tumor | membrane assembly | 19/3246 | 50/18723 | 4.13e-04 | 3.16e-03 | 19 |
| GO:005087818 | Prostate | Tumor | regulation of body fluid levels | 91/3246 | 379/18723 | 5.37e-04 | 3.91e-03 | 91 |
| GO:004409112 | Prostate | Tumor | membrane biogenesis | 20/3246 | 55/18723 | 5.74e-04 | 4.13e-03 | 20 |
| GO:006143612 | Prostate | Tumor | establishment of skin barrier | 11/3246 | 25/18723 | 1.71e-03 | 1.02e-02 | 11 |
| GO:003356111 | Prostate | Tumor | regulation of water loss via skin | 11/3246 | 27/18723 | 3.57e-03 | 1.84e-02 | 11 |
| GO:00070093 | Prostate | Tumor | plasma membrane organization | 36/3246 | 142/18723 | 1.00e-02 | 4.20e-02 | 36 |
| GO:0007586 | Stomach | GC | digestion | 38/1159 | 137/18723 | 1.80e-15 | 1.22e-12 | 38 |
| GO:00226006 | Stomach | GC | digestive system process | 30/1159 | 104/18723 | 5.40e-13 | 2.10e-10 | 30 |
| GO:00508925 | Stomach | GC | intestinal absorption | 18/1159 | 41/18723 | 8.10e-12 | 2.20e-09 | 18 |
| GO:0098856 | Stomach | GC | intestinal lipid absorption | 10/1159 | 21/18723 | 1.50e-07 | 8.56e-06 | 10 |
| GO:00508786 | Stomach | GC | regulation of body fluid levels | 40/1159 | 379/18723 | 6.92e-04 | 9.20e-03 | 40 |
| GO:00085443 | Stomach | GC | epidermis development | 33/1159 | 324/18723 | 3.43e-03 | 2.96e-02 | 33 |
| GO:00099134 | Stomach | GC | epidermal cell differentiation | 23/1159 | 202/18723 | 3.50e-03 | 3.02e-02 | 23 |
| Page: 1 2 3 4 5 6 7 8 9 10 |
| Pathway ID | Tissue | Disease Stage | Description | Gene Ratio | Bg Ratio | pvalue | p.adjust | qvalue | Count |
| hsa047142 | Colorectum | SER | Thermogenesis | 106/1580 | 232/8465 | 1.15e-21 | 6.34e-20 | 4.61e-20 | 106 |
| hsa049222 | Colorectum | SER | Glucagon signaling pathway | 38/1580 | 107/8465 | 2.57e-05 | 3.28e-04 | 2.38e-04 | 38 |
| hsa047143 | Colorectum | SER | Thermogenesis | 106/1580 | 232/8465 | 1.15e-21 | 6.34e-20 | 4.61e-20 | 106 |
| hsa049223 | Colorectum | SER | Glucagon signaling pathway | 38/1580 | 107/8465 | 2.57e-05 | 3.28e-04 | 2.38e-04 | 38 |
| Page: 1 |
Top |
Cell-cell communication analysis |
| Identification of potential cell-cell interactions between two cell types and their ligand-receptor pairs for different disease states |
| Ligand | Receptor | LRpair | Pathway | Tissue | Disease Stage |
| Page: 1 |
Top |
Single-cell gene regulatory network inference analysis |
| Find out the significant the regulons (TFs) and the target genes of each regulon across cell types for different disease states |
| TF | Cell Type | Tissue | Disease Stage | Target Gene | RSS | Regulon Activity |
| ∗The dot plots of a searched regulon are shown for all cell subpopulations in each disease state of each tissue based on the regulon specific score inferred using pySCENIC and by calculating the average expression. |
| Page: 1 |
Top |
Somatic mutation of malignant transformation related genes |
| Annotation of somatic variants for genes involved in malignant transformation |
| Hugo Symbol | Variant Class | Variant Classification | dbSNP RS | HGVSc | HGVSp | HGVSp Short | SWISSPROT | BIOTYPE | SIFT | PolyPhen | Tumor Sample Barcode | Tissue | Histology | Sex | Age | Stage | Therapy Types | Drugs | Outcome |
| GCG | SNV | Missense_Mutation | novel | c.322A>T | p.Ser108Cys | p.S108C | P01275 | protein_coding | deleterious(0) | probably_damaging(0.983) | TCGA-A8-A09W-01 | Breast | breast invasive carcinoma | Female | >=65 | III/IV | Unknown | Unknown | SD |
| GCG | SNV | Missense_Mutation | c.286N>C | p.Glu96Gln | p.E96Q | P01275 | protein_coding | deleterious(0.02) | possibly_damaging(0.849) | TCGA-C5-A1M6-01 | Cervix | cervical & endocervical cancer | Female | <65 | I/II | Chemotherapy | cisplatin | PD | |
| GCG | SNV | Missense_Mutation | c.187N>C | p.Ser63Arg | p.S63R | P01275 | protein_coding | deleterious(0.01) | possibly_damaging(0.776) | TCGA-C5-A2LX-01 | Cervix | cervical & endocervical cancer | Female | <65 | I/II | Chemotherapy | cisplatin | SD | |
| GCG | SNV | Missense_Mutation | c.79N>A | p.Glu27Lys | p.E27K | P01275 | protein_coding | deleterious(0.01) | probably_damaging(0.939) | TCGA-EK-A2PL-01 | Cervix | cervical & endocervical cancer | Female | <65 | III/IV | Unknown | Unknown | SD | |
| GCG | SNV | Missense_Mutation | c.462G>C | p.Glu154Asp | p.E154D | P01275 | protein_coding | tolerated(0.91) | benign(0.039) | TCGA-Q1-A5R2-01 | Cervix | cervical & endocervical cancer | Female | <65 | I/II | Chemotherapy | cisplatin | PR | |
| GCG | SNV | Missense_Mutation | c.154C>T | p.Arg52Cys | p.R52C | P01275 | protein_coding | deleterious(0) | probably_damaging(1) | TCGA-VS-A8QA-01 | Cervix | cervical & endocervical cancer | Female | <65 | I/II | Unknown | Unknown | SD | |
| GCG | SNV | Missense_Mutation | rs765979783 | c.167G>A | p.Gly56Asp | p.G56D | P01275 | protein_coding | deleterious(0.01) | probably_damaging(0.965) | TCGA-AA-3710-01 | Colorectum | colon adenocarcinoma | Female | >=65 | I/II | Unknown | Unknown | SD |
| GCG | SNV | Missense_Mutation | c.14N>G | p.Tyr5Cys | p.Y5C | P01275 | protein_coding | tolerated(0.06) | benign(0.26) | TCGA-AZ-4315-01 | Colorectum | colon adenocarcinoma | Male | <65 | I/II | Unknown | Unknown | SD | |
| GCG | SNV | Missense_Mutation | c.481N>C | p.Asn161His | p.N161H | P01275 | protein_coding | tolerated(0.14) | benign(0.001) | TCGA-G4-6310-01 | Colorectum | colon adenocarcinoma | Male | >=65 | III/IV | Chemotherapy | 5-fu | SD | |
| GCG | SNV | Missense_Mutation | c.449C>A | p.Ser150Tyr | p.S150Y | P01275 | protein_coding | deleterious(0) | probably_damaging(0.983) | TCGA-AG-3892-01 | Colorectum | rectum adenocarcinoma | Female | <65 | I/II | Unknown | Unknown | SD |
| Page: 1 2 3 4 5 |
Top |
Related drugs of malignant transformation related genes |
| Identification of chemicals and drugs interact with genes involved in malignant transfromation |
| (DGIdb 4.0) |
| Entrez ID | Symbol | Category | Interaction Types | Drug Claim Name | Drug Name | PMIDs |
| 2641 | GCG | DRUGGABLE GENOME, HORMONE ACTIVITY | PC4 | 12665168 | ||
| 2641 | GCG | DRUGGABLE GENOME, HORMONE ACTIVITY | ANTIDEPRESSANT | 10889291 | ||
| 2641 | GCG | DRUGGABLE GENOME, HORMONE ACTIVITY | SODIUM BUTYRATE | 3550424 | ||
| 2641 | GCG | DRUGGABLE GENOME, HORMONE ACTIVITY | NALTREXONE | NALTREXONE | 9623517 | |
| 2641 | GCG | DRUGGABLE GENOME, HORMONE ACTIVITY | MK-8521 | |||
| 2641 | GCG | DRUGGABLE GENOME, HORMONE ACTIVITY | PB-1023 | |||
| 2641 | GCG | DRUGGABLE GENOME, HORMONE ACTIVITY | PYRAZOLE | PYRAZOLE | 6992153 | |
| 2641 | GCG | DRUGGABLE GENOME, HORMONE ACTIVITY | BETHANECHOL CHLORIDE | 449696 | ||
| 2641 | GCG | DRUGGABLE GENOME, HORMONE ACTIVITY | MORPHINE | MORPHINE | 6993188 | |
| 2641 | GCG | DRUGGABLE GENOME, HORMONE ACTIVITY | PD 098059 | 10781369 |
| Page: 1 2 3 |

Copyright 2023-Present -The University of Texas Health Science Center at Houston |