
|
|||||
|
 | |
| |
| |
| |
| |
| |
|
Gene: FYN |
Gene summary for FYN |
| Gene information | Species | Human | Gene symbol | FYN | Gene ID | 2534 |
| Gene name | FYN proto-oncogene, Src family tyrosine kinase | |
| Gene Alias | SLK | |
| Cytomap | 6q21 | |
| Gene Type | protein-coding | GO ID | GO:0000302 | UniProtAcc | P06241 |
Top |
Malignant transformation analysis |
| Identification of the aberrant gene expression in precancerous and cancerous lesions by comparing the gene expression of stem-like cells in diseased tissues with normal stem cells |
| Entrez ID | Symbol | Replicates | Species | Organ | Tissue | Adj P-value | Log2FC | Malignancy |
| 2534 | FYN | LZE7T | Human | Esophagus | ESCC | 4.17e-08 | 5.18e-01 | 0.0667 |
| 2534 | FYN | LZE24T | Human | Esophagus | ESCC | 1.68e-05 | 6.07e-02 | 0.0596 |
| 2534 | FYN | LZE6T | Human | Esophagus | ESCC | 8.08e-03 | 3.09e-01 | 0.0845 |
| 2534 | FYN | P2T-E | Human | Esophagus | ESCC | 1.43e-05 | 8.22e-02 | 0.1177 |
| 2534 | FYN | P4T-E | Human | Esophagus | ESCC | 3.14e-08 | 1.57e-01 | 0.1323 |
| 2534 | FYN | P5T-E | Human | Esophagus | ESCC | 7.31e-06 | 7.12e-02 | 0.1327 |
| 2534 | FYN | P9T-E | Human | Esophagus | ESCC | 4.88e-03 | 9.66e-02 | 0.1131 |
| 2534 | FYN | P10T-E | Human | Esophagus | ESCC | 7.67e-23 | 3.48e-01 | 0.116 |
| 2534 | FYN | P12T-E | Human | Esophagus | ESCC | 3.69e-19 | 2.47e-01 | 0.1122 |
| 2534 | FYN | P16T-E | Human | Esophagus | ESCC | 1.11e-13 | 1.99e-01 | 0.1153 |
| 2534 | FYN | P23T-E | Human | Esophagus | ESCC | 9.15e-04 | 9.56e-02 | 0.108 |
| 2534 | FYN | P24T-E | Human | Esophagus | ESCC | 1.92e-02 | 3.62e-02 | 0.1287 |
| 2534 | FYN | P26T-E | Human | Esophagus | ESCC | 1.47e-08 | 4.68e-02 | 0.1276 |
| 2534 | FYN | P27T-E | Human | Esophagus | ESCC | 8.58e-04 | 1.44e-02 | 0.1055 |
| 2534 | FYN | P28T-E | Human | Esophagus | ESCC | 3.70e-12 | 2.32e-01 | 0.1149 |
| 2534 | FYN | P31T-E | Human | Esophagus | ESCC | 8.53e-03 | 4.68e-03 | 0.1251 |
| 2534 | FYN | P32T-E | Human | Esophagus | ESCC | 1.30e-09 | 8.52e-02 | 0.1666 |
| 2534 | FYN | P37T-E | Human | Esophagus | ESCC | 3.88e-02 | 1.04e-01 | 0.1371 |
| 2534 | FYN | P42T-E | Human | Esophagus | ESCC | 6.10e-03 | 4.57e-02 | 0.1175 |
| 2534 | FYN | P44T-E | Human | Esophagus | ESCC | 4.68e-04 | 1.19e-01 | 0.1096 |
| Page: 1 2 3 4 |
| Tissue | Expression Dynamics | Abbreviation |
| Esophagus | 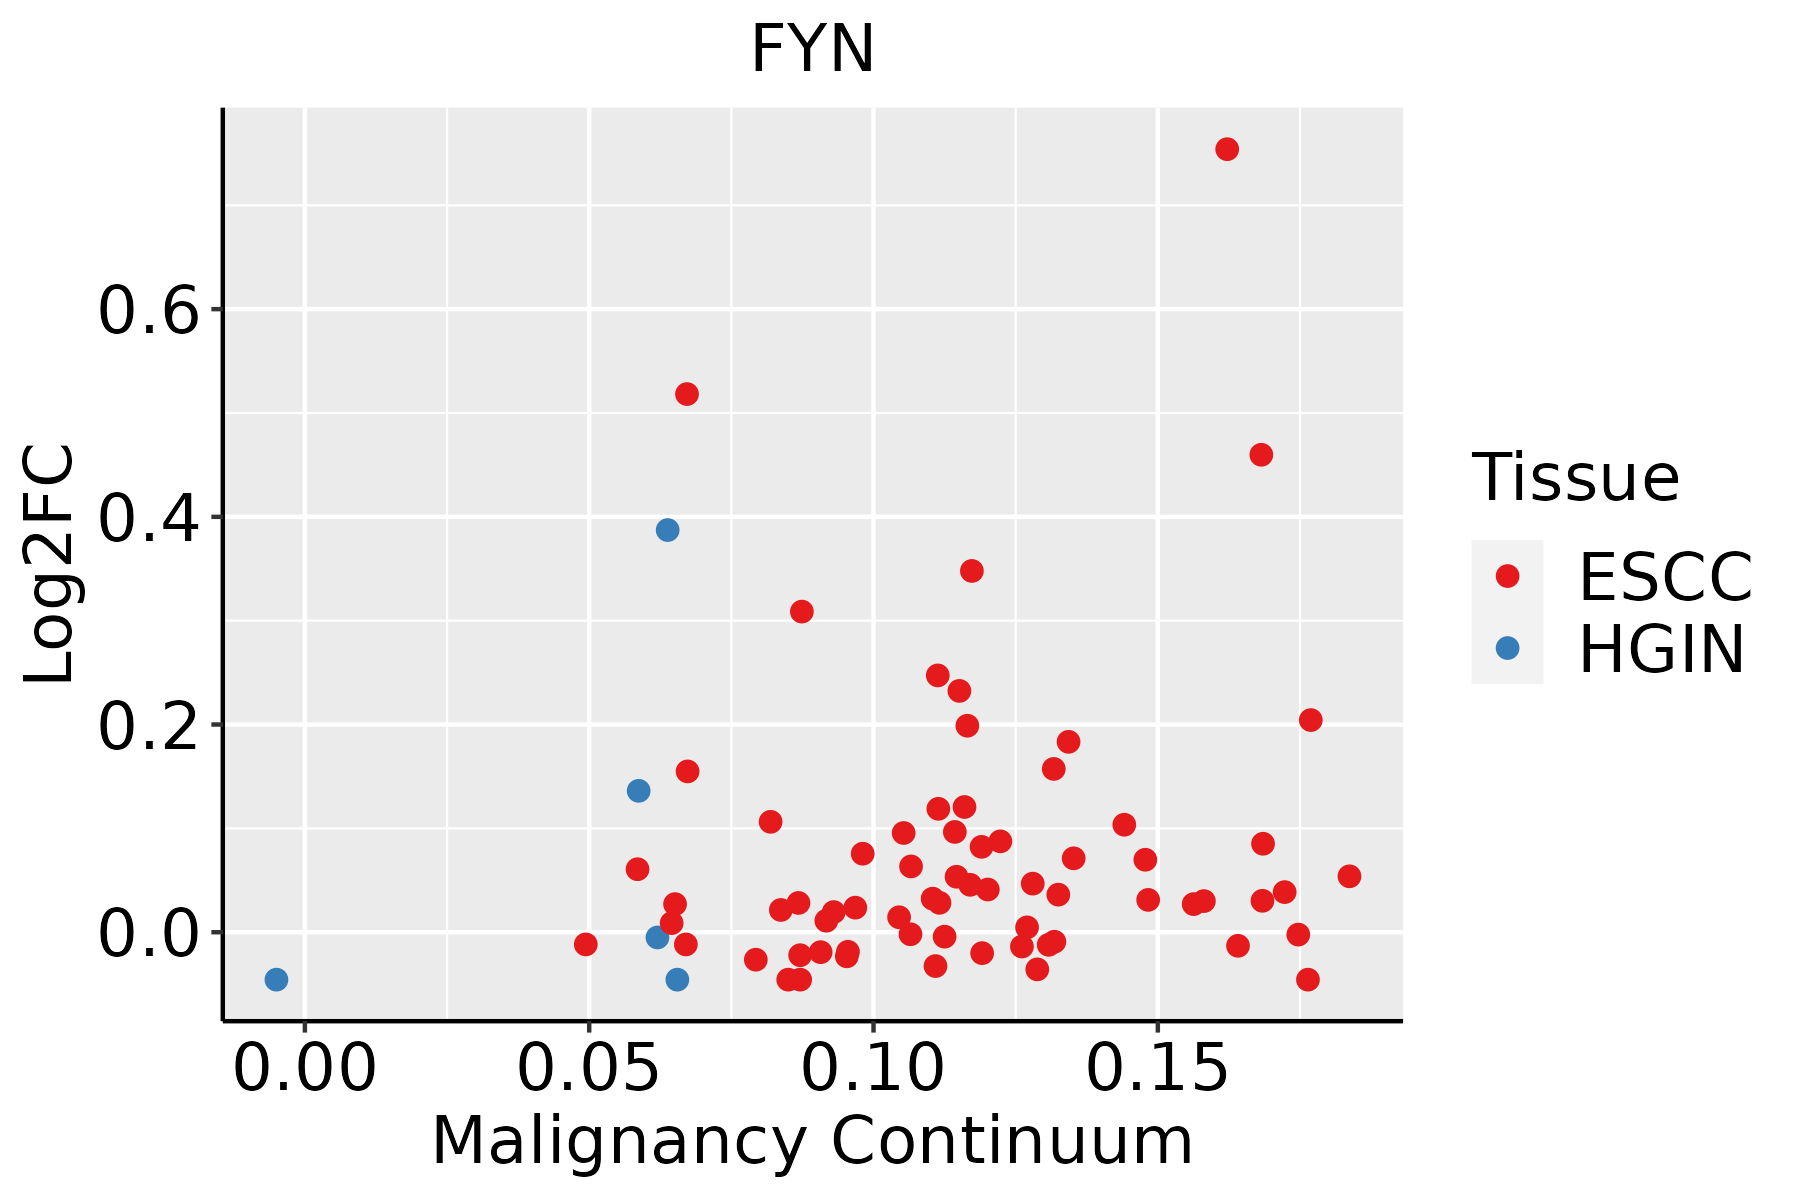 | ESCC: Esophageal squamous cell carcinoma |
| HGIN: High-grade intraepithelial neoplasias | ||
| LGIN: Low-grade intraepithelial neoplasias | ||
| Lung | 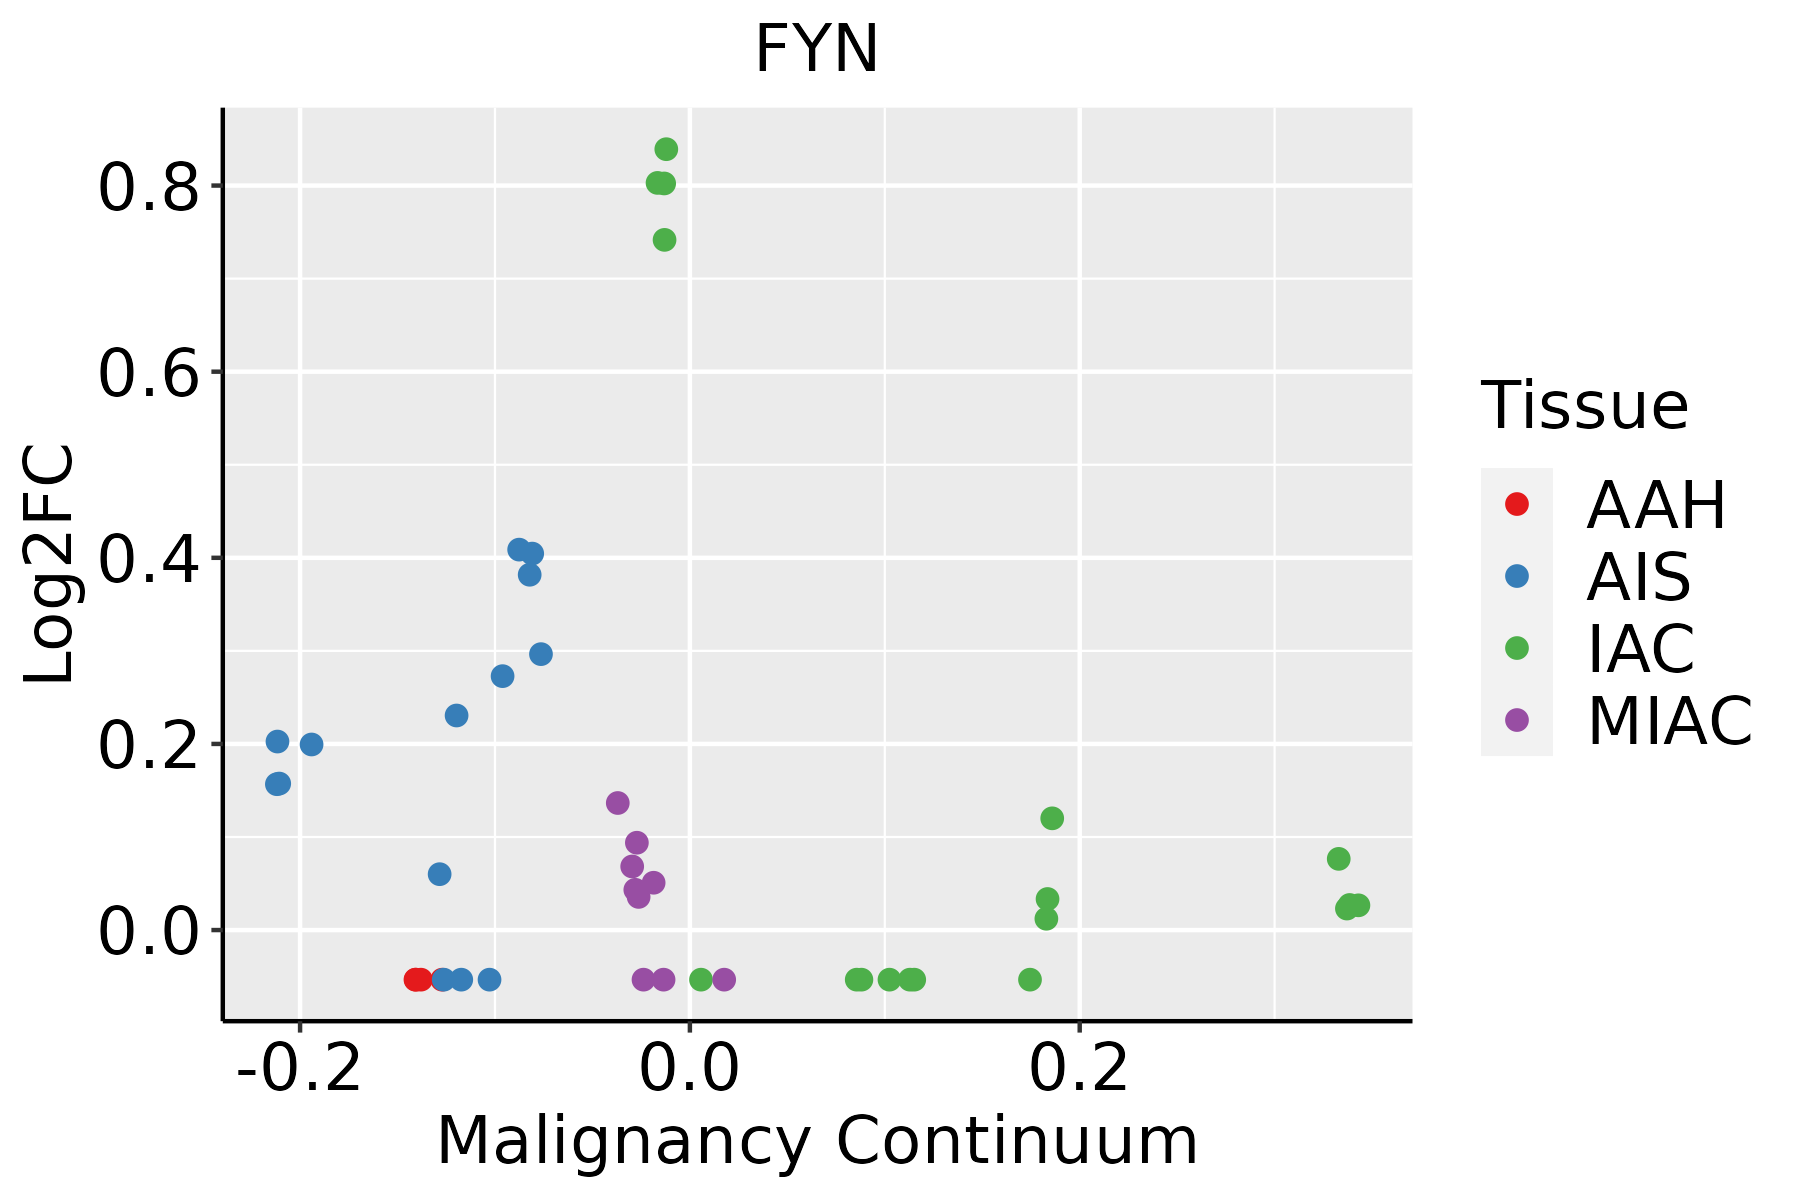 | AAH: Atypical adenomatous hyperplasia |
| AIS: Adenocarcinoma in situ | ||
| IAC: Invasive lung adenocarcinoma | ||
| MIA: Minimally invasive adenocarcinoma | ||
| Oral Cavity | 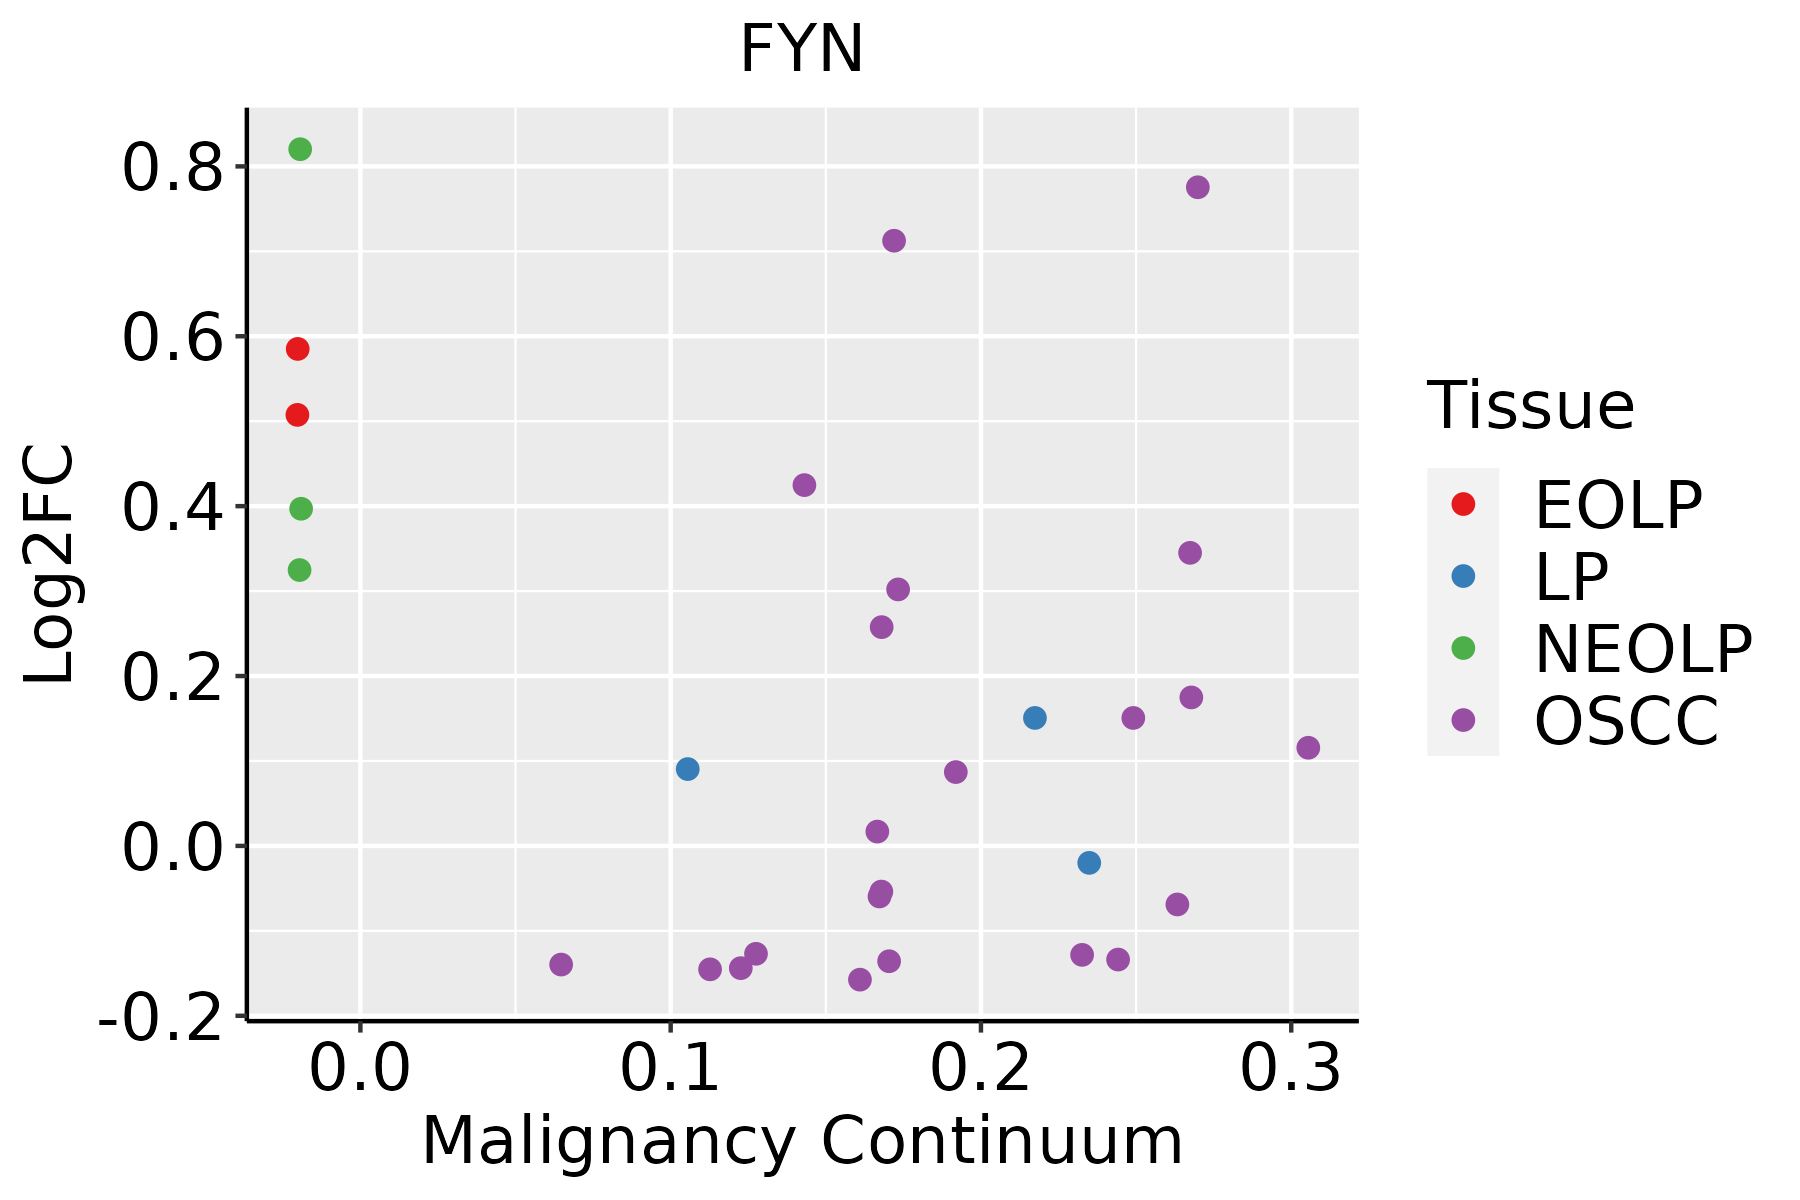 | EOLP: Erosive Oral lichen planus |
| LP: leukoplakia | ||
| NEOLP: Non-erosive oral lichen planus | ||
| OSCC: Oral squamous cell carcinoma | ||
| Thyroid | 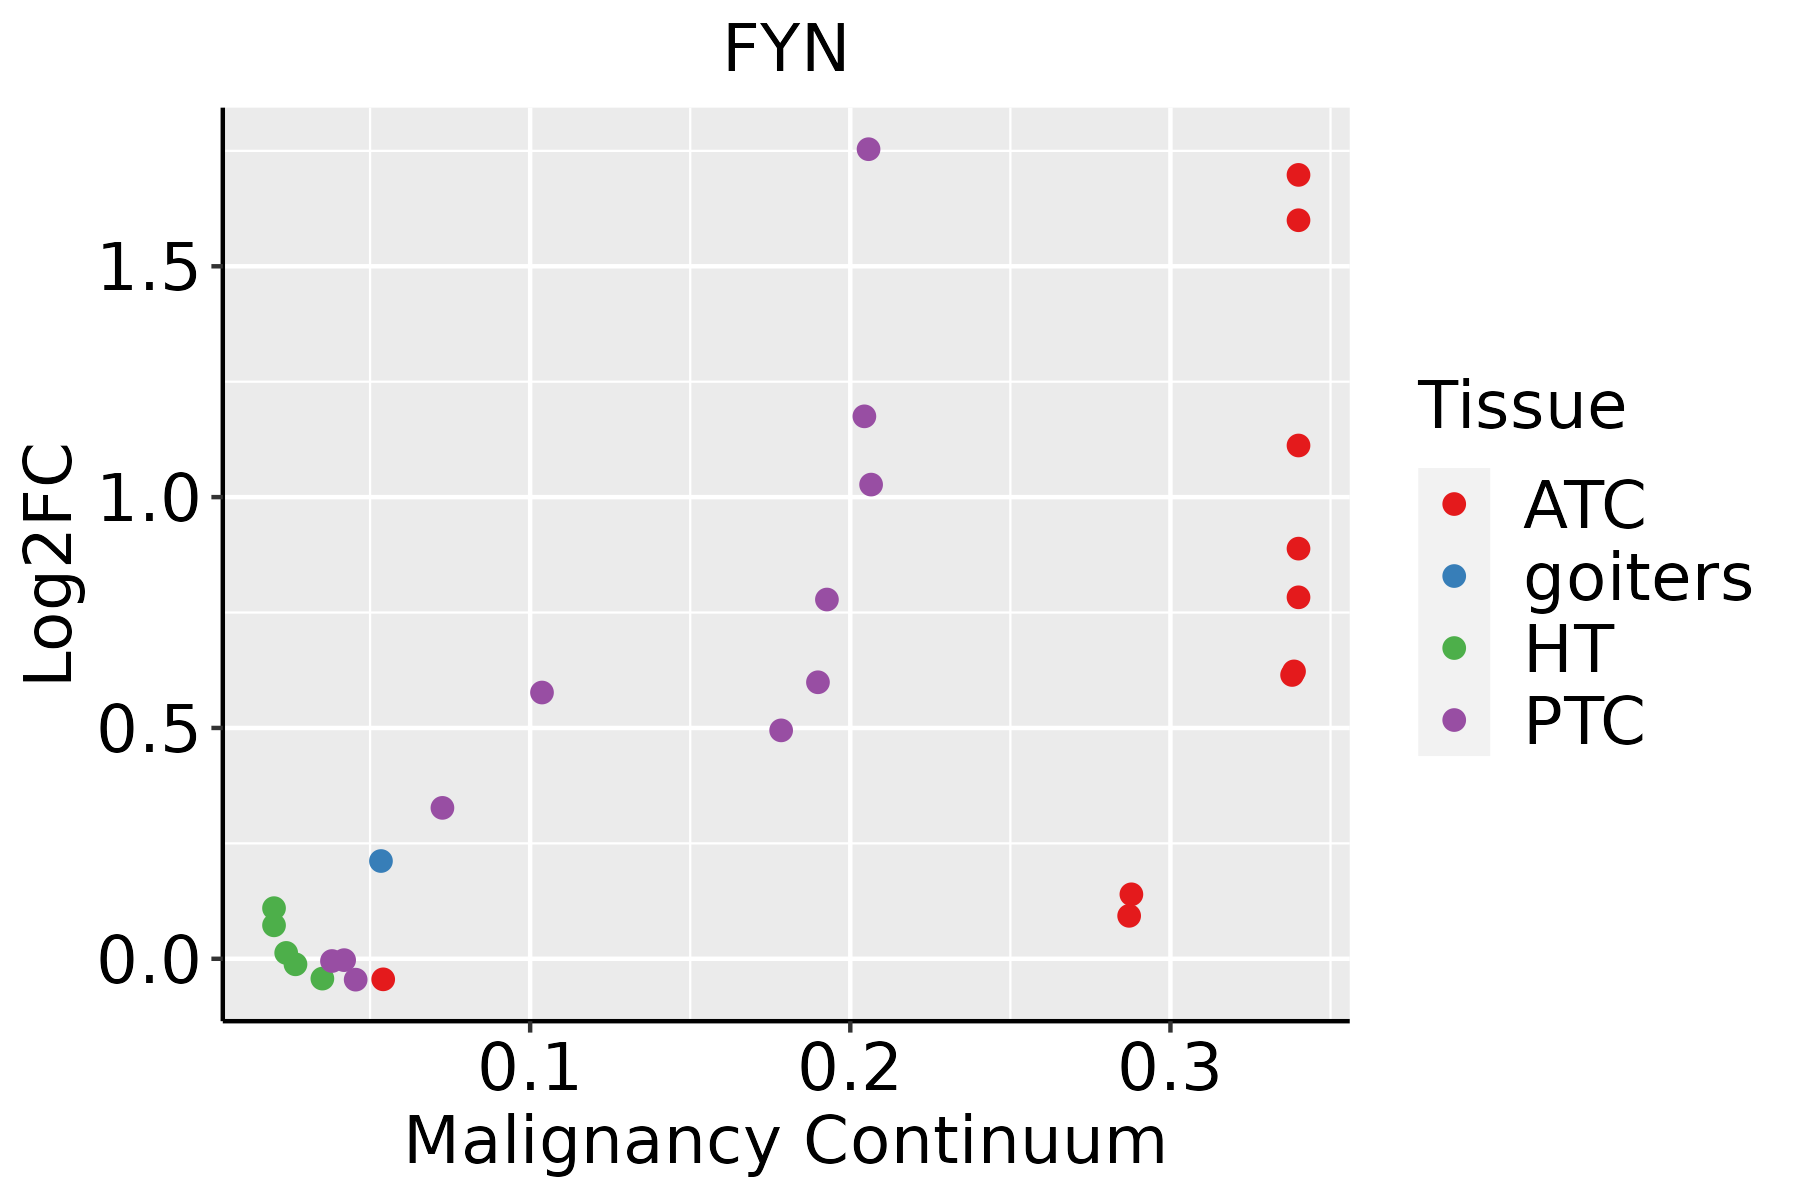 | ATC: Anaplastic thyroid cancer |
| HT: Hashimoto's thyroiditis | ||
| PTC: Papillary thyroid cancer |
| ∗log2FC in expression of this searched gene in stem-like cells from each diseased tissue sample relative to stem-like cells in normal samples in each tissue plotted against the malignancy continuum. Samples are colored based on if they are from different disease stage. |
Top |
Malignant transformation related pathway analysis |
| Find out the enriched GO biological processes and KEGG pathways involved in transition from healthy to precancer to cancer |
| Tissue | Disease Stage | Enriched GO biological Processes |
| Colorectum | AD |  |
| Colorectum | SER |  |
| Colorectum | MSS |  |
| Colorectum | MSI-H |  |
| Colorectum | FAP |  |
| ∗Top 15 enriched GO BP terms are showed in the bar plot of each disease state in each tissue. Each row represents a significant GO biological process which is colored according to the -log10(p.adjust). |
| Page: 1 2 3 4 5 6 7 8 9 |
| GO ID | Tissue | Disease Stage | Description | Gene Ratio | Bg Ratio | pvalue | p.adjust | Count |
| GO:00003028 | Lung | IAC | response to reactive oxygen species | 44/2061 | 222/18723 | 7.69e-05 | 1.59e-03 | 44 |
| GO:00224078 | Lung | IAC | regulation of cell-cell adhesion | 76/2061 | 448/18723 | 8.16e-05 | 1.68e-03 | 76 |
| GO:19012148 | Lung | IAC | regulation of neuron death | 58/2061 | 319/18723 | 8.28e-05 | 1.69e-03 | 58 |
| GO:20012378 | Lung | IAC | negative regulation of extrinsic apoptotic signaling pathway | 24/2061 | 97/18723 | 1.03e-04 | 2.02e-03 | 24 |
| GO:00615646 | Lung | IAC | axon development | 78/2061 | 467/18723 | 1.12e-04 | 2.15e-03 | 78 |
| GO:00323867 | Lung | IAC | regulation of intracellular transport | 60/2061 | 337/18723 | 1.16e-04 | 2.22e-03 | 60 |
| GO:00431235 | Lung | IAC | positive regulation of I-kappaB kinase/NF-kappaB signaling | 38/2061 | 186/18723 | 1.19e-04 | 2.25e-03 | 38 |
| GO:19028828 | Lung | IAC | regulation of response to oxidative stress | 24/2061 | 98/18723 | 1.22e-04 | 2.30e-03 | 24 |
| GO:00074096 | Lung | IAC | axonogenesis | 71/2061 | 418/18723 | 1.33e-04 | 2.48e-03 | 71 |
| GO:01060276 | Lung | IAC | neuron projection organization | 23/2061 | 93/18723 | 1.43e-04 | 2.64e-03 | 23 |
| GO:19054756 | Lung | IAC | regulation of protein localization to membrane | 36/2061 | 175/18723 | 1.54e-04 | 2.81e-03 | 36 |
| GO:19004078 | Lung | IAC | regulation of cellular response to oxidative stress | 22/2061 | 89/18723 | 1.99e-04 | 3.51e-03 | 22 |
| GO:00439545 | Lung | IAC | cellular component maintenance | 17/2061 | 61/18723 | 2.24e-04 | 3.89e-03 | 17 |
| GO:19012168 | Lung | IAC | positive regulation of neuron death | 23/2061 | 97/18723 | 2.79e-04 | 4.56e-03 | 23 |
| GO:00331577 | Lung | IAC | regulation of intracellular protein transport | 43/2061 | 229/18723 | 3.21e-04 | 5.06e-03 | 43 |
| GO:00109508 | Lung | IAC | positive regulation of endopeptidase activity | 35/2061 | 179/18723 | 5.15e-04 | 7.37e-03 | 35 |
| GO:00970616 | Lung | IAC | dendritic spine organization | 20/2061 | 84/18723 | 6.42e-04 | 8.74e-03 | 20 |
| GO:00991735 | Lung | IAC | postsynapse organization | 33/2061 | 168/18723 | 6.74e-04 | 9.12e-03 | 33 |
| GO:00421106 | Lung | IAC | T cell activation | 77/2061 | 487/18723 | 6.82e-04 | 9.20e-03 | 77 |
| GO:0001764 | Lung | IAC | neuron migration | 31/2061 | 156/18723 | 7.89e-04 | 1.02e-02 | 31 |
| Page: 1 2 3 4 5 6 7 8 9 10 11 12 13 14 15 16 17 18 19 20 21 22 23 24 25 26 27 28 29 30 31 32 33 34 35 36 37 38 |
| Pathway ID | Tissue | Disease Stage | Description | Gene Ratio | Bg Ratio | pvalue | p.adjust | qvalue | Count |
| hsa05020210 | Esophagus | ESCC | Prion disease | 193/4205 | 273/8465 | 6.42e-13 | 1.34e-11 | 6.89e-12 | 193 |
| hsa05130211 | Esophagus | ESCC | Pathogenic Escherichia coli infection | 142/4205 | 197/8465 | 8.21e-11 | 1.06e-09 | 5.42e-10 | 142 |
| hsa0452030 | Esophagus | ESCC | Adherens junction | 69/4205 | 93/8465 | 1.08e-06 | 6.83e-06 | 3.50e-06 | 69 |
| hsa0407116 | Esophagus | ESCC | Sphingolipid signaling pathway | 85/4205 | 121/8465 | 3.04e-06 | 1.73e-05 | 8.84e-06 | 85 |
| hsa0451020 | Esophagus | ESCC | Focal adhesion | 127/4205 | 203/8465 | 1.25e-04 | 4.99e-04 | 2.56e-04 | 127 |
| hsa0541630 | Esophagus | ESCC | Viral myocarditis | 41/4205 | 60/8465 | 2.59e-03 | 7.05e-03 | 3.61e-03 | 41 |
| hsa0436016 | Esophagus | ESCC | Axon guidance | 108/4205 | 182/8465 | 5.13e-03 | 1.30e-02 | 6.67e-03 | 108 |
| hsa046607 | Esophagus | ESCC | T cell receptor signaling pathway | 63/4205 | 104/8465 | 1.60e-02 | 3.60e-02 | 1.84e-02 | 63 |
| hsa0502038 | Esophagus | ESCC | Prion disease | 193/4205 | 273/8465 | 6.42e-13 | 1.34e-11 | 6.89e-12 | 193 |
| hsa05130310 | Esophagus | ESCC | Pathogenic Escherichia coli infection | 142/4205 | 197/8465 | 8.21e-11 | 1.06e-09 | 5.42e-10 | 142 |
| hsa04520114 | Esophagus | ESCC | Adherens junction | 69/4205 | 93/8465 | 1.08e-06 | 6.83e-06 | 3.50e-06 | 69 |
| hsa0407117 | Esophagus | ESCC | Sphingolipid signaling pathway | 85/4205 | 121/8465 | 3.04e-06 | 1.73e-05 | 8.84e-06 | 85 |
| hsa04510111 | Esophagus | ESCC | Focal adhesion | 127/4205 | 203/8465 | 1.25e-04 | 4.99e-04 | 2.56e-04 | 127 |
| hsa05416114 | Esophagus | ESCC | Viral myocarditis | 41/4205 | 60/8465 | 2.59e-03 | 7.05e-03 | 3.61e-03 | 41 |
| hsa0436017 | Esophagus | ESCC | Axon guidance | 108/4205 | 182/8465 | 5.13e-03 | 1.30e-02 | 6.67e-03 | 108 |
| hsa0466013 | Esophagus | ESCC | T cell receptor signaling pathway | 63/4205 | 104/8465 | 1.60e-02 | 3.60e-02 | 1.84e-02 | 63 |
| hsa0452016 | Lung | IAC | Adherens junction | 37/1053 | 93/8465 | 1.99e-11 | 2.16e-09 | 1.43e-09 | 37 |
| hsa045108 | Lung | IAC | Focal adhesion | 59/1053 | 203/8465 | 1.31e-10 | 1.06e-08 | 7.06e-09 | 59 |
| hsa0513016 | Lung | IAC | Pathogenic Escherichia coli infection | 45/1053 | 197/8465 | 2.93e-05 | 6.14e-04 | 4.08e-04 | 45 |
| hsa040719 | Lung | IAC | Sphingolipid signaling pathway | 28/1053 | 121/8465 | 7.30e-04 | 6.08e-03 | 4.04e-03 | 28 |
| Page: 1 2 3 4 5 |
Top |
Cell-cell communication analysis |
| Identification of potential cell-cell interactions between two cell types and their ligand-receptor pairs for different disease states |
| Ligand | Receptor | LRpair | Pathway | Tissue | Disease Stage |
| Page: 1 |
Top |
Single-cell gene regulatory network inference analysis |
| Find out the significant the regulons (TFs) and the target genes of each regulon across cell types for different disease states |
| TF | Cell Type | Tissue | Disease Stage | Target Gene | RSS | Regulon Activity |
| ∗The dot plots of a searched regulon are shown for all cell subpopulations in each disease state of each tissue based on the regulon specific score inferred using pySCENIC and by calculating the average expression. |
| Page: 1 |
Top |
Somatic mutation of malignant transformation related genes |
| Annotation of somatic variants for genes involved in malignant transformation |
| Hugo Symbol | Variant Class | Variant Classification | dbSNP RS | HGVSc | HGVSp | HGVSp Short | SWISSPROT | BIOTYPE | SIFT | PolyPhen | Tumor Sample Barcode | Tissue | Histology | Sex | Age | Stage | Therapy Types | Drugs | Outcome |
| FYN | SNV | Missense_Mutation | rs376211530 | c.163G>A | p.Ala55Thr | p.A55T | P06241 | protein_coding | tolerated(0.88) | benign(0) | TCGA-A8-A07W-01 | Breast | breast invasive carcinoma | Female | >=65 | III/IV | Hormone Therapy | exemestane | SD |
| FYN | SNV | Missense_Mutation | rs376211530 | c.163N>A | p.Ala55Thr | p.A55T | P06241 | protein_coding | tolerated(0.88) | benign(0) | TCGA-AC-A3EH-01 | Breast | breast invasive carcinoma | Female | >=65 | III/IV | Unknown | Unknown | SD |
| FYN | SNV | Missense_Mutation | c.925N>A | p.Glu309Lys | p.E309K | P06241 | protein_coding | tolerated(0.23) | benign(0.049) | TCGA-LL-A6FP-01 | Breast | breast invasive carcinoma | Female | >=65 | I/II | Hormone Therapy | arimidex | SD | |
| FYN | SNV | Missense_Mutation | rs760289292 | c.721N>T | p.Arg241Cys | p.R241C | P06241 | protein_coding | tolerated(0.06) | benign(0.005) | TCGA-EA-A3HS-01 | Cervix | cervical & endocervical cancer | Female | <65 | I/II | Unknown | Unknown | SD |
| FYN | SNV | Missense_Mutation | c.478N>A | p.Glu160Lys | p.E160K | P06241 | protein_coding | deleterious(0) | probably_damaging(0.982) | TCGA-EK-A2R8-01 | Cervix | cervical & endocervical cancer | Female | <65 | I/II | Unknown | Unknown | SD | |
| FYN | SNV | Missense_Mutation | novel | c.439N>A | p.Glu147Lys | p.E147K | P06241 | protein_coding | deleterious(0.02) | benign(0.179) | TCGA-IR-A3LH-01 | Cervix | cervical & endocervical cancer | Female | <65 | I/II | Chemotherapy | cisplatin | CR |
| FYN | SNV | Missense_Mutation | c.1540G>A | p.Glu514Lys | p.E514K | P06241 | protein_coding | deleterious(0) | possibly_damaging(0.674) | TCGA-IR-A3LK-01 | Cervix | cervical & endocervical cancer | Female | >=65 | I/II | Chemotherapy | cisplatin | PD | |
| FYN | SNV | Missense_Mutation | c.359G>T | p.Trp120Leu | p.W120L | P06241 | protein_coding | deleterious(0) | possibly_damaging(0.735) | TCGA-UC-A7PF-01 | Cervix | cervical & endocervical cancer | Female | <65 | I/II | Unknown | Unknown | SD | |
| FYN | SNV | Missense_Mutation | c.1119N>T | p.Gln373His | p.Q373H | P06241 | protein_coding | deleterious(0.01) | possibly_damaging(0.821) | TCGA-A6-2686-01 | Colorectum | colon adenocarcinoma | Female | >=65 | I/II | Unknown | Unknown | SD | |
| FYN | SNV | Missense_Mutation | c.616N>T | p.Arg206Cys | p.R206C | P06241 | protein_coding | deleterious(0) | possibly_damaging(0.661) | TCGA-A6-6141-01 | Colorectum | colon adenocarcinoma | Male | <65 | I/II | Chemotherapy | 5-fu | SD |
| Page: 1 2 3 4 5 6 7 8 |
Top |
Related drugs of malignant transformation related genes |
| Identification of chemicals and drugs interact with genes involved in malignant transfromation |
| (DGIdb 4.0) |
| Entrez ID | Symbol | Category | Interaction Types | Drug Claim Name | Drug Name | PMIDs |
| 2534 | FYN | DRUGGABLE GENOME, CELL SURFACE, TYROSINE KINASE, KINASE, ENZYME | inhibitor | CHEMBL403989 | TG100-801 | |
| 2534 | FYN | DRUGGABLE GENOME, CELL SURFACE, TYROSINE KINASE, KINASE, ENZYME | inhibitor | 385612188 | ||
| 2534 | FYN | DRUGGABLE GENOME, CELL SURFACE, TYROSINE KINASE, KINASE, ENZYME | 681640 | CHEMBL379975 | ||
| 2534 | FYN | DRUGGABLE GENOME, CELL SURFACE, TYROSINE KINASE, KINASE, ENZYME | DASATINIB | DASATINIB | ||
| 2534 | FYN | DRUGGABLE GENOME, CELL SURFACE, TYROSINE KINASE, KINASE, ENZYME | OSI-632 | OSI-632 | ||
| 2534 | FYN | DRUGGABLE GENOME, CELL SURFACE, TYROSINE KINASE, KINASE, ENZYME | ILORASERTIB | ILORASERTIB | ||
| 2534 | FYN | DRUGGABLE GENOME, CELL SURFACE, TYROSINE KINASE, KINASE, ENZYME | inhibitor | CHEMBL3545085 | XL-228 | |
| 2534 | FYN | DRUGGABLE GENOME, CELL SURFACE, TYROSINE KINASE, KINASE, ENZYME | AZAKENPAULLONE | AZAKENPAULLONE | ||
| 2534 | FYN | DRUGGABLE GENOME, CELL SURFACE, TYROSINE KINASE, KINASE, ENZYME | TAMATINIB | R-406 | ||
| 2534 | FYN | DRUGGABLE GENOME, CELL SURFACE, TYROSINE KINASE, KINASE, ENZYME | inhibitor | CHEMBL3545133 | JNJ-26483327 |
| Page: 1 2 3 4 5 |

Copyright 2023-Present -The University of Texas Health Science Center at Houston |