Schematic overview of the cellular and molecular mechanisms involved in the cancer progression, including the proposed cellular and molecular mechanisms in cancer cells trajectory. AT1: alveolar type 1 cells; AT2: alveolar type 2 cells; AAH: atypical adenomatous hyperplasia; AIS: adenocarcinoma in situ; MIA: minimally invasive adenocarcinoma; IA: invasive adenocarcinoma; EMT: epithelial-mesenchymal transition

Home

Download

Statistics

Help

Contact

Center for Computational Systems Medicine
leaf

Gene summary

leaf

Malignant transformation analysis

leaf

Malignant transformation related pathway analysis

leaf

Cell-cell communication analysis

leaf

Single-cell gene regulatory network inference analysis

leaf

Somatic mutation of malignant transformation related genes

leaf

Related drugs of malignant transformation related genes

Gene: ERC1

Gene summary for ERC1

check button Gene summary.

Gene informationSpeciesHuman
Gene symbol

ERC1

Gene ID

23085

Gene nameELKS/RAB6-interacting/CAST family member 1
Gene AliasCast2
Cytomap12p13.33
Gene Typeprotein-coding
GO ID

GO:0006139

UniProtAcc

G8JLD3


Top

Malignant transformation analysis

check button Identification of the aberrant gene expression in precancerous and cancerous lesions by comparing the gene expression of stem-like cells in diseased tissues with normal stem cells
check button Malignant transformation involving gene list.
Entrez IDSymbolReplicatesSpeciesOrganTissueAdj P-valueLog2FCMalignancy
23085ERC1CCI_1HumanCervixCC3.20e-171.36e+000.528
23085ERC1CCI_2HumanCervixCC1.93e-171.53e+000.5249
23085ERC1CCI_3HumanCervixCC5.13e-412.35e+000.516
23085ERC1HTA11_3410_2000001011HumanColorectumAD6.78e-20-5.49e-010.0155
23085ERC1HTA11_3361_2000001011HumanColorectumAD4.23e-02-4.18e-01-0.1207
23085ERC1HTA11_5216_2000001011HumanColorectumSER4.67e-02-6.68e-01-0.1462
23085ERC1HTA11_7862_2000001011HumanColorectumAD2.07e-05-6.69e-01-0.0179
23085ERC1HTA11_8622_2000001021HumanColorectumSER8.72e-04-5.82e-010.0528
23085ERC1HTA11_99999970781_79442HumanColorectumMSS2.07e-11-5.03e-010.294
23085ERC1HTA11_99999974143_84620HumanColorectumMSS3.65e-08-4.10e-010.3005
23085ERC1A015-C-203HumanColorectumFAP1.11e-33-4.19e-01-0.1294
23085ERC1A015-C-204HumanColorectumFAP3.38e-07-3.34e-01-0.0228
23085ERC1A014-C-040HumanColorectumFAP3.18e-05-3.55e-01-0.1184
23085ERC1A002-C-201HumanColorectumFAP1.08e-14-3.53e-010.0324
23085ERC1A002-C-203HumanColorectumFAP3.09e-04-1.36e-010.2786
23085ERC1A001-C-119HumanColorectumFAP5.67e-04-1.66e-01-0.1557
23085ERC1A001-C-108HumanColorectumFAP1.71e-15-2.37e-01-0.0272
23085ERC1A002-C-205HumanColorectumFAP5.29e-24-2.30e-01-0.1236
23085ERC1A015-C-006HumanColorectumFAP9.68e-18-2.26e-01-0.0994
23085ERC1A015-C-106HumanColorectumFAP7.22e-09-1.44e-01-0.0511
Page: 1 2 3 4 5 6 7 8 9 10 11 

check button Transcriptomic changes along malignancy continuum.
TissueExpression DynamicsAbbreviation
CervixThe image shows the transcriptomic changes along malignancy continuum.log2FC in expression of this searched gene in stem-like cells from each diseased tissue sample relative to stem-like cells in normal samples in each tissue plotted against the malignancy continuum. Samples are colored based on if they are from different disease stage.CC: Cervix cancer
HSIL_HPV: HPV-infected high-grade squamous intraepithelial lesions
N_HPV: HPV-infected normal cervix
Colorectum (GSE201348)The image shows the transcriptomic changes along malignancy continuum.log2FC in expression of this searched gene in stem-like cells from each diseased tissue sample relative to stem-like cells in normal samples in each tissue plotted against the malignancy continuum. Samples are colored based on if they are from different disease stage.FAP: Familial adenomatous polyposis
CRC: Colorectal cancer
Colorectum (HTA11)The image shows the transcriptomic changes along malignancy continuum.log2FC in expression of this searched gene in stem-like cells from each diseased tissue sample relative to stem-like cells in normal samples in each tissue plotted against the malignancy continuum. Samples are colored based on if they are from different disease stage.AD: Adenomas
SER: Sessile serrated lesions
MSI-H: Microsatellite-high colorectal cancer
MSS: Microsatellite stable colorectal cancer
EndometriumThe image shows the transcriptomic changes along malignancy continuum.log2FC in expression of this searched gene in stem-like cells from each diseased tissue sample relative to stem-like cells in normal samples in each tissue plotted against the malignancy continuum. Samples are colored based on if they are from different disease stage.AEH: Atypical endometrial hyperplasia
EEC: Endometrioid Cancer
EsophagusThe image shows the transcriptomic changes along malignancy continuum.log2FC in expression of this searched gene in stem-like cells from each diseased tissue sample relative to stem-like cells in normal samples in each tissue plotted against the malignancy continuum. Samples are colored based on if they are from different disease stage.ESCC: Esophageal squamous cell carcinoma
HGIN: High-grade intraepithelial neoplasias
LGIN: Low-grade intraepithelial neoplasias
LiverThe image shows the transcriptomic changes along malignancy continuum.log2FC in expression of this searched gene in stem-like cells from each diseased tissue sample relative to stem-like cells in normal samples in each tissue plotted against the malignancy continuum. Samples are colored based on if they are from different disease stage.HCC: Hepatocellular carcinoma
NAFLD: Non-alcoholic fatty liver disease
LungThe image shows the transcriptomic changes along malignancy continuum.log2FC in expression of this searched gene in stem-like cells from each diseased tissue sample relative to stem-like cells in normal samples in each tissue plotted against the malignancy continuum. Samples are colored based on if they are from different disease stage.AAH: Atypical adenomatous hyperplasia
AIS: Adenocarcinoma in situ
IAC: Invasive lung adenocarcinoma
MIA: Minimally invasive adenocarcinoma
Oral CavityThe image shows the transcriptomic changes along malignancy continuum.log2FC in expression of this searched gene in stem-like cells from each diseased tissue sample relative to stem-like cells in normal samples in each tissue plotted against the malignancy continuum. Samples are colored based on if they are from different disease stage.EOLP: Erosive Oral lichen planus
LP: leukoplakia
NEOLP: Non-erosive oral lichen planus
OSCC: Oral squamous cell carcinoma
ProstateThe image shows the transcriptomic changes along malignancy continuum.log2FC in expression of this searched gene in stem-like cells from each diseased tissue sample relative to stem-like cells in normal samples in each tissue plotted against the malignancy continuum. Samples are colored based on if they are from different disease stage.
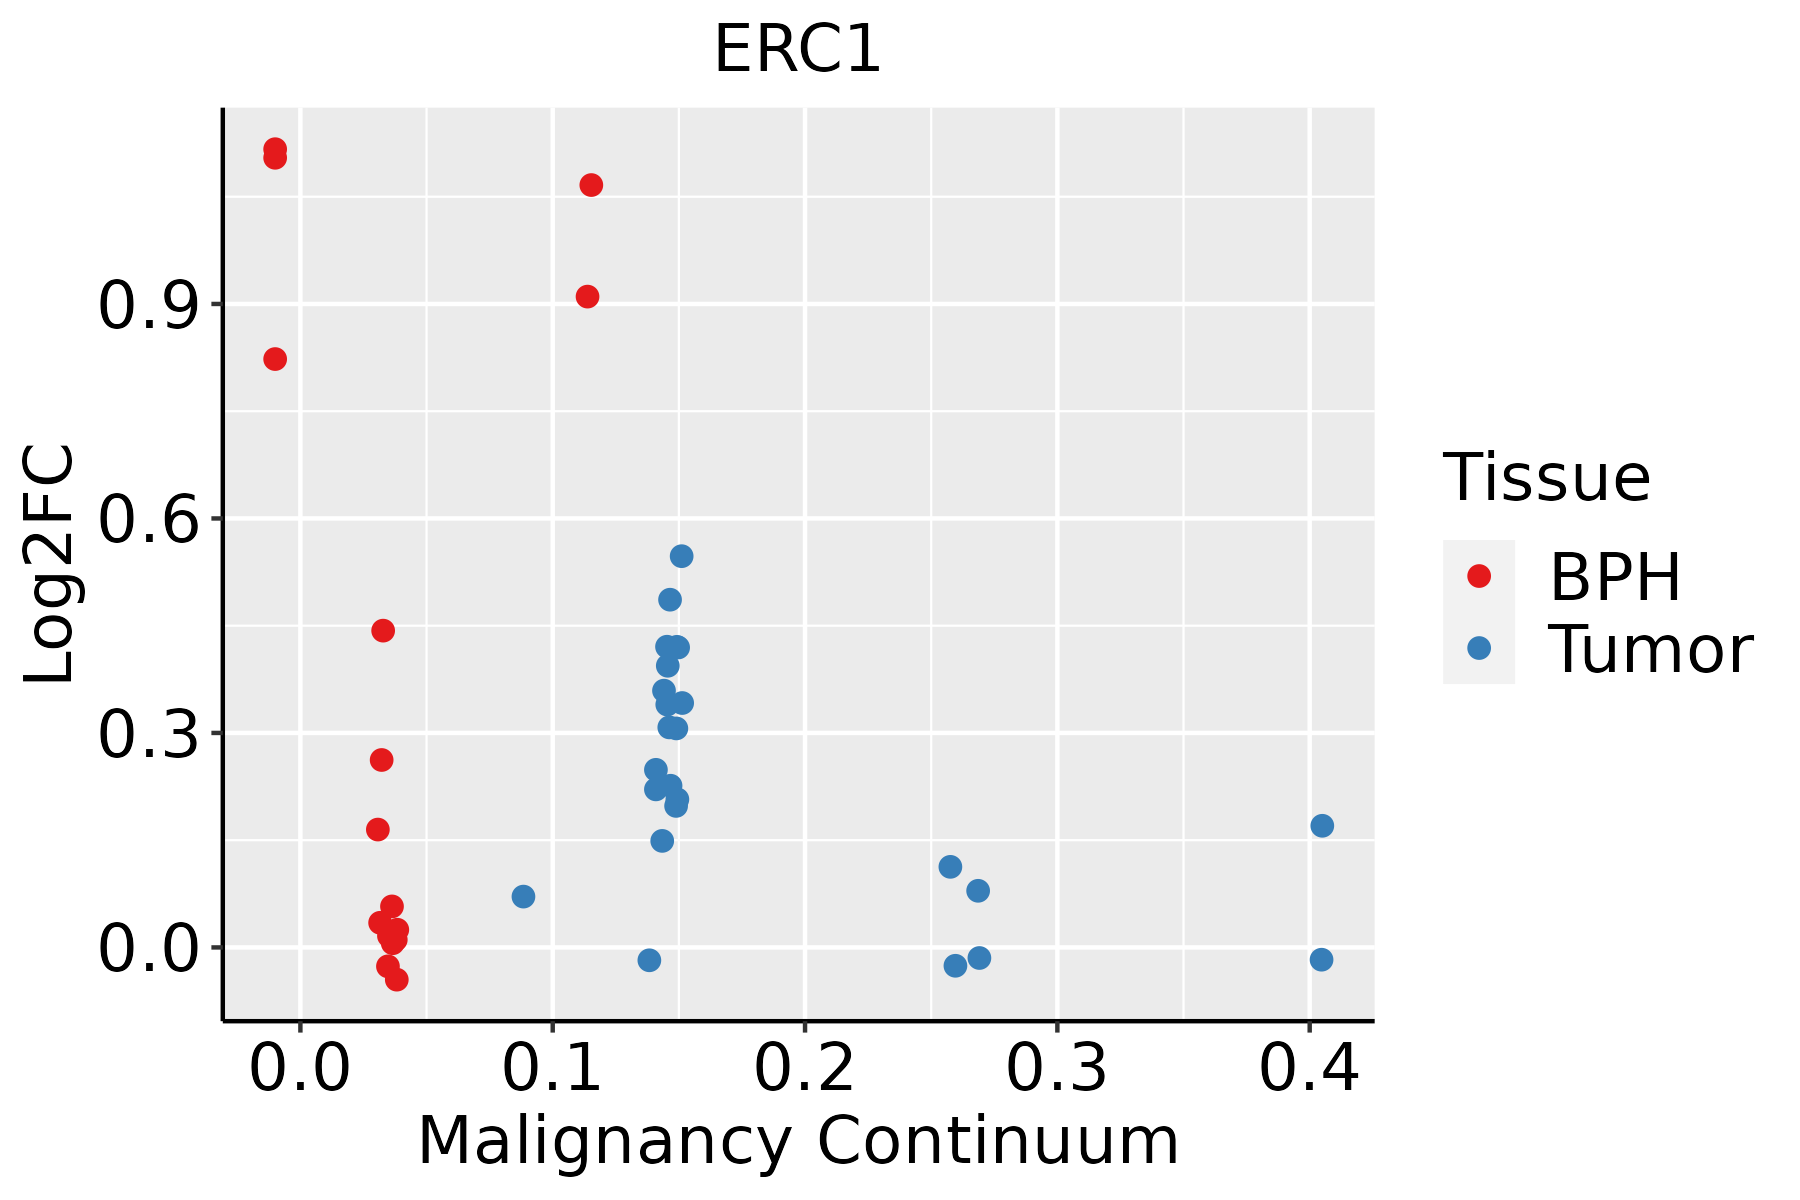
BPH: Benign Prostatic Hyperplasia
SkinThe image shows the transcriptomic changes along malignancy continuum.log2FC in expression of this searched gene in stem-like cells from each diseased tissue sample relative to stem-like cells in normal samples in each tissue plotted against the malignancy continuum. Samples are colored based on if they are from different disease stage.AK: Actinic keratosis
cSCC: Cutaneous squamous cell carcinoma
SCCIS:squamous cell carcinoma in situ
ThyroidThe image shows the transcriptomic changes along malignancy continuum.log2FC in expression of this searched gene in stem-like cells from each diseased tissue sample relative to stem-like cells in normal samples in each tissue plotted against the malignancy continuum. Samples are colored based on if they are from different disease stage.
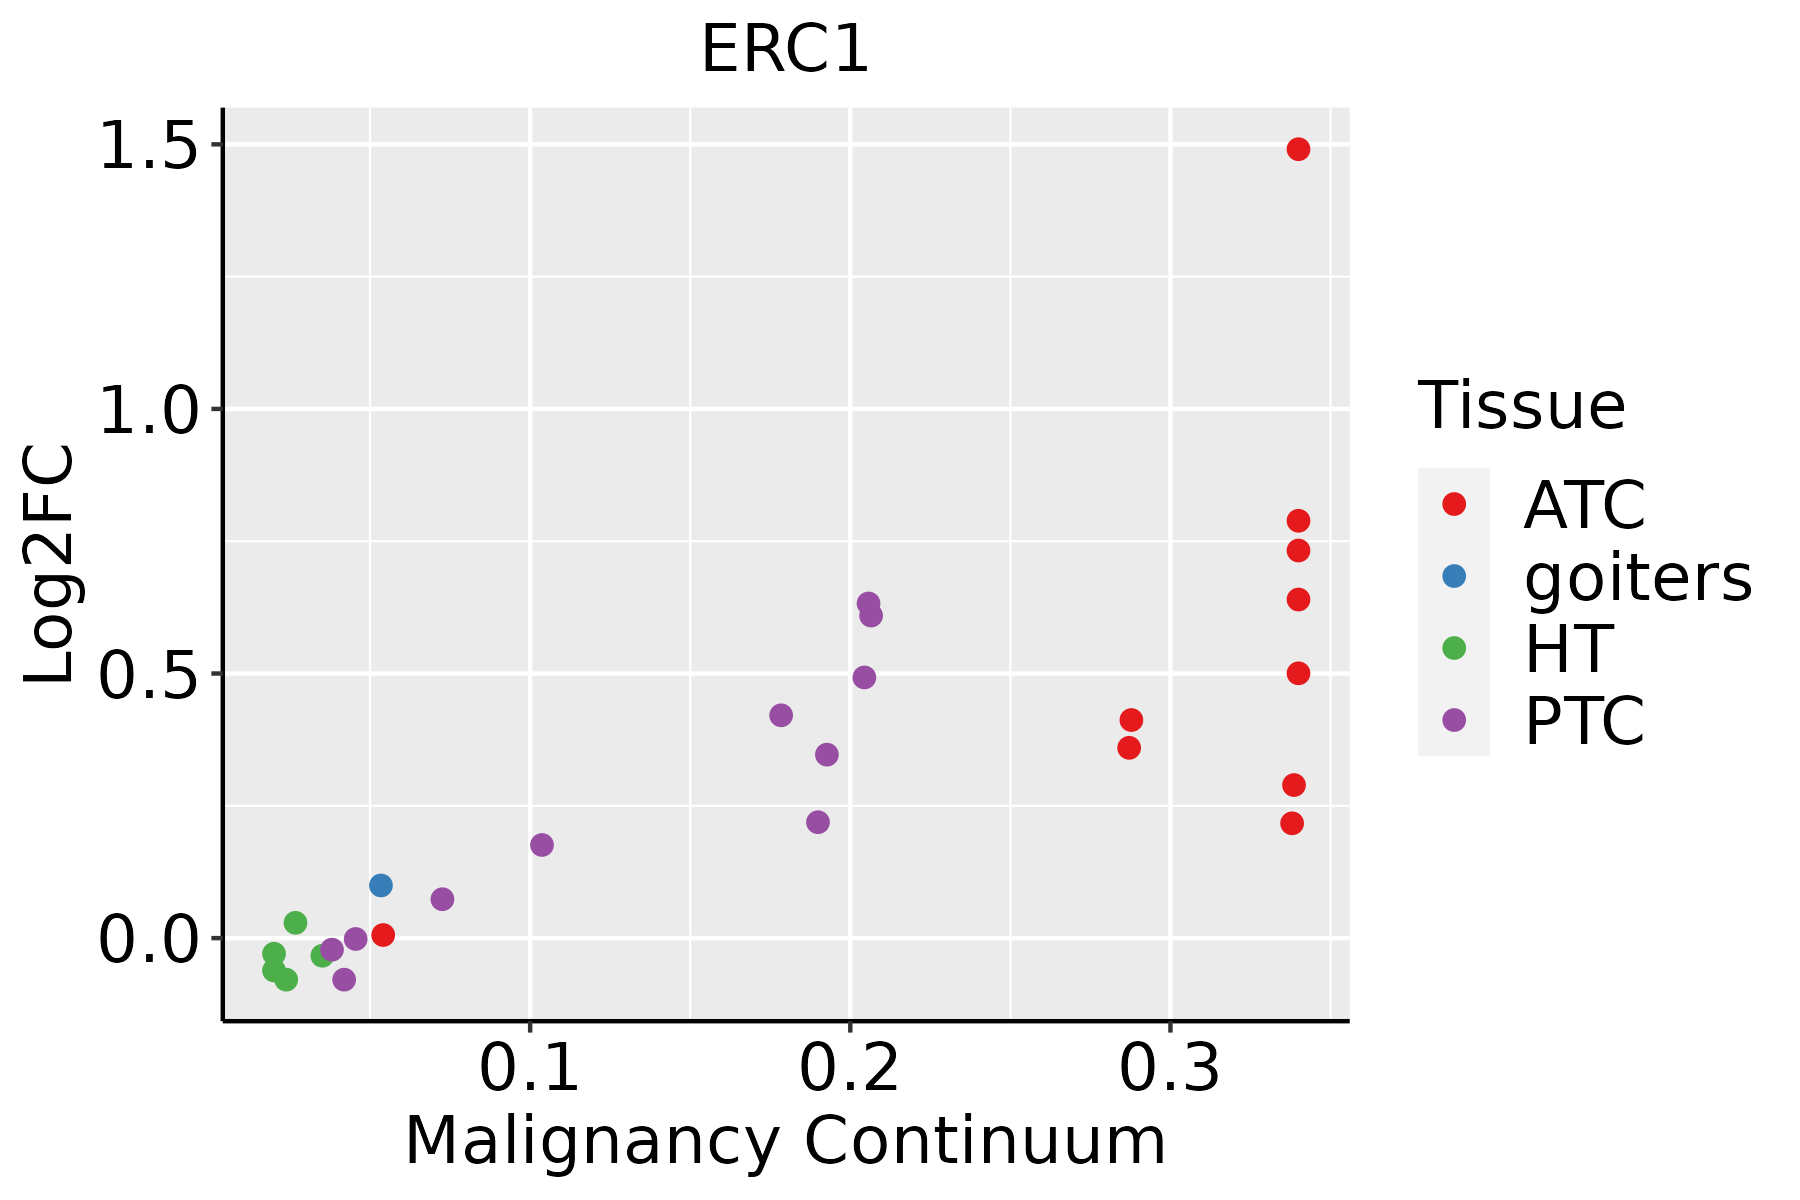
ATC: Anaplastic thyroid cancer
HT: Hashimoto's thyroiditis
PTC: Papillary thyroid cancer
∗log2FC in expression of this searched gene in stem-like cells from each diseased tissue sample relative to stem-like cells in normal samples in each tissue plotted against the malignancy continuum. Samples are colored based on if they are from different disease stage.

Top

Malignant transformation related pathway analysis

check buttonFind out the enriched GO biological processes and KEGG pathways involved in transition from healthy to precancer to cancer
check button Figure of enriched GO biological processes.
TissueDisease StageEnriched GO biological Processes
ColorectumADGO analysis - Figure of enriched GO biological processes: Top 15 enriched GO BP terms are showed in the bar plot of each disease state in each tissue. Each row represents a significant GO biological process which is colored according to the -log10(p.adjust).
ColorectumSERGO analysis - Figure of enriched GO biological processes: Top 15 enriched GO BP terms are showed in the bar plot of each disease state in each tissue. Each row represents a significant GO biological process which is colored according to the -log10(p.adjust).
ColorectumMSSGO analysis - Figure of enriched GO biological processes: Top 15 enriched GO BP terms are showed in the bar plot of each disease state in each tissue. Each row represents a significant GO biological process which is colored according to the -log10(p.adjust).
ColorectumMSI-HGO analysis - Figure of enriched GO biological processes: Top 15 enriched GO BP terms are showed in the bar plot of each disease state in each tissue. Each row represents a significant GO biological process which is colored according to the -log10(p.adjust).
ColorectumFAPGO analysis - Figure of enriched GO biological processes: Top 15 enriched GO BP terms are showed in the bar plot of each disease state in each tissue. Each row represents a significant GO biological process which is colored according to the -log10(p.adjust).
∗Top 15 enriched GO BP terms are showed in the bar plot of each disease state in each tissue. Each row represents a significant GO biological process which is colored according to the -log10(p.adjust).
Page: 1 2 3 4 5 6 7 8 9 

check button Enriched GO biological processes.
GO IDTissueDisease StageDescriptionGene RatioBg Ratiopvaluep.adjustCount
GO:000989519Oral cavityOSCCnegative regulation of catabolic process180/7305320/187232.44e-106.86e-09180
GO:003133020Oral cavityOSCCnegative regulation of cellular catabolic process152/7305262/187233.04e-108.28e-09152
GO:00510907Oral cavityOSCCregulation of DNA-binding transcription factor activity221/7305440/187239.06e-071.23e-05221
GO:00510917Oral cavityOSCCpositive regulation of DNA-binding transcription factor activity134/7305260/187232.52e-052.35e-04134
GO:00421476Oral cavityOSCCretrograde transport, endosome to Golgi55/730591/187232.79e-052.59e-0455
GO:00105075Oral cavityOSCCnegative regulation of autophagy51/730585/187237.08e-055.62e-0451
GO:00510925Oral cavityOSCCpositive regulation of NF-kappaB transcription factor activity82/7305152/187231.28e-049.13e-0482
GO:001050615Oral cavityLPregulation of autophagy132/4623317/187231.82e-111.28e-09132
GO:0009895110Oral cavityLPnegative regulation of catabolic process128/4623320/187238.36e-103.91e-08128
GO:0031330110Oral cavityLPnegative regulation of cellular catabolic process107/4623262/187235.25e-092.16e-07107
GO:001050711Oral cavityLPnegative regulation of autophagy38/462385/187234.36e-056.24e-0438
GO:001050622Oral cavityEOLPregulation of autophagy74/2218317/187235.84e-093.07e-0774
GO:003133025Oral cavityEOLPnegative regulation of cellular catabolic process64/2218262/187239.72e-094.77e-0764
GO:000989525Oral cavityEOLPnegative regulation of catabolic process73/2218320/187232.07e-088.84e-0773
GO:001648223Oral cavityEOLPcytosolic transport44/2218168/187232.40e-077.45e-0644
GO:000724924Oral cavityEOLPI-kappaB kinase/NF-kappaB signaling62/2218281/187238.00e-072.02e-0562
GO:005109021Oral cavityEOLPregulation of DNA-binding transcription factor activity80/2218440/187235.77e-057.31e-0480
GO:001619722Oral cavityEOLPendosomal transport45/2218230/187234.63e-044.07e-0345
GO:004214722Oral cavityEOLPretrograde transport, endosome to Golgi21/221891/187231.89e-031.21e-0221
GO:001050721Oral cavityEOLPnegative regulation of autophagy19/221885/187234.41e-032.40e-0219
Page: 1 2 3 4 5 6 7 8 9 10 11 12 

check button Enriched KEGG pathways.
Pathway IDTissueDisease StageDescriptionGene RatioBg Ratiopvaluep.adjustqvalueCount
hsa040645EsophagusESCCNF-kappa B signaling pathway67/4205104/84651.62e-034.89e-032.50e-0367
hsa0406412EsophagusESCCNF-kappa B signaling pathway67/4205104/84651.62e-034.89e-032.50e-0367
hsa040644Oral cavityOSCCNF-kappa B signaling pathway67/3704104/84651.57e-056.75e-053.44e-0567
hsa0406411Oral cavityOSCCNF-kappa B signaling pathway67/3704104/84651.57e-056.75e-053.44e-0567
hsa040642Oral cavityEOLPNF-kappa B signaling pathway31/1218104/84653.72e-051.82e-041.07e-0431
hsa040643Oral cavityEOLPNF-kappa B signaling pathway31/1218104/84653.72e-051.82e-041.07e-0431
Page: 1 

Top

Cell-cell communication analysis

check buttonIdentification of potential cell-cell interactions between two cell types and their ligand-receptor pairs for different disease states
LigandReceptorLRpairPathwayTissueDisease Stage
Page: 1 

Top

Single-cell gene regulatory network inference analysis

check buttonFind out the significant the regulons (TFs) and the target genes of each regulon across cell types for different disease states
TFCell TypeTissueDisease StageTarget GeneRSSRegulon Activity
∗The dot plots of a searched regulon are shown for all cell subpopulations in each disease state of each tissue based on the regulon specific score inferred using pySCENIC and by calculating the average expression.
Page: 1 

Top

Somatic mutation of malignant transformation related genes

check buttonAnnotation of somatic variants for genes involved in malignant transformation
Hugo SymbolVariant ClassVariant ClassificationdbSNP RSHGVScHGVSpHGVSp ShortSWISSPROTBIOTYPESIFTPolyPhenTumor Sample BarcodeTissueHistologySexAgeStageTherapy TypesDrugsOutcome
ERC1SNVMissense_Mutationc.2334N>Cp.Lys778Asnp.K778NQ8IUD2protein_codingdeleterious(0)probably_damaging(0.983)TCGA-A2-A0YK-01Breastbreast invasive carcinomaFemale<65I/IIChemotherapycytoxanSD
ERC1SNVMissense_Mutationnovelc.3131G>Tp.Gly1044Valp.G1044VQ8IUD2protein_codingdeleterious_low_confidence(0.03)benign(0.011)TCGA-A2-A25A-01Breastbreast invasive carcinomaFemale<65I/IIUnspecificCytoxanSD
ERC1SNVMissense_Mutationc.3016N>Gp.Pro1006Alap.P1006AQ8IUD2protein_codingdeleterious_low_confidence(0)possibly_damaging(0.813)TCGA-A2-A25E-01Breastbreast invasive carcinomaFemale<65III/IVChemotherapycytoxanPD
ERC1SNVMissense_Mutationc.3139C>Tp.Pro1047Serp.P1047SQ8IUD2protein_codingtolerated_low_confidence(0.08)probably_damaging(0.994)TCGA-A7-A0D9-01Breastbreast invasive carcinomaFemale<65I/IIChemotherapytaxotereSD
ERC1SNVMissense_Mutationnovelc.430N>Tp.Arg144Cysp.R144CQ8IUD2protein_codingdeleterious(0)probably_damaging(0.943)TCGA-AN-A046-01Breastbreast invasive carcinomaFemale>=65I/IIUnknownUnknownSD
ERC1SNVMissense_Mutationnovelc.2843N>Tp.Ser948Leup.S948LQ8IUD2protein_codingdeleterious(0)probably_damaging(0.999)TCGA-AN-A046-01Breastbreast invasive carcinomaFemale>=65I/IIUnknownUnknownSD
ERC1SNVMissense_Mutationc.1783A>Tp.Ser595Cysp.S595CQ8IUD2protein_codingtolerated(0.07)probably_damaging(0.926)TCGA-AO-A12H-01Breastbreast invasive carcinomaFemale>=65I/IIHormone TherapyarimidexSD
ERC1SNVMissense_Mutationc.1120N>Cp.Ser374Prop.S374PQ8IUD2protein_codingtolerated(0.66)benign(0.012)TCGA-BH-A18G-01Breastbreast invasive carcinomaFemale>=65I/IIUnknownUnknownSD
ERC1SNVMissense_Mutationc.2738G>Ap.Arg913Glnp.R913QQ8IUD2protein_codingtolerated(0.14)probably_damaging(0.989)TCGA-E2-A573-01Breastbreast invasive carcinomaFemale<65I/IIChemotherapytaxotereCR
ERC1insertionFrame_Shift_Insnovelc.3210_3211insATp.Gln1071IlefsTer7p.Q1071Ifs*7Q8IUD2protein_codingTCGA-AN-A03X-01Breastbreast invasive carcinomaFemale>=65I/IIUnknownUnknownSD
Page: 1 2 3 4 5 6 7 8 9 10 11 

Top

Related drugs of malignant transformation related genes

check buttonIdentification of chemicals and drugs interact with genes involved in malignant transfromation
(DGIdb 4.0)
Entrez IDSymbolCategoryInteraction TypesDrug Claim NameDrug NamePMIDs
Page: 1