| Tissue | Expression Dynamics | Abbreviation |
| Esophagus |  | ESCC: Esophageal squamous cell carcinoma |
| HGIN: High-grade intraepithelial neoplasias |
| LGIN: Low-grade intraepithelial neoplasias |
| Liver | 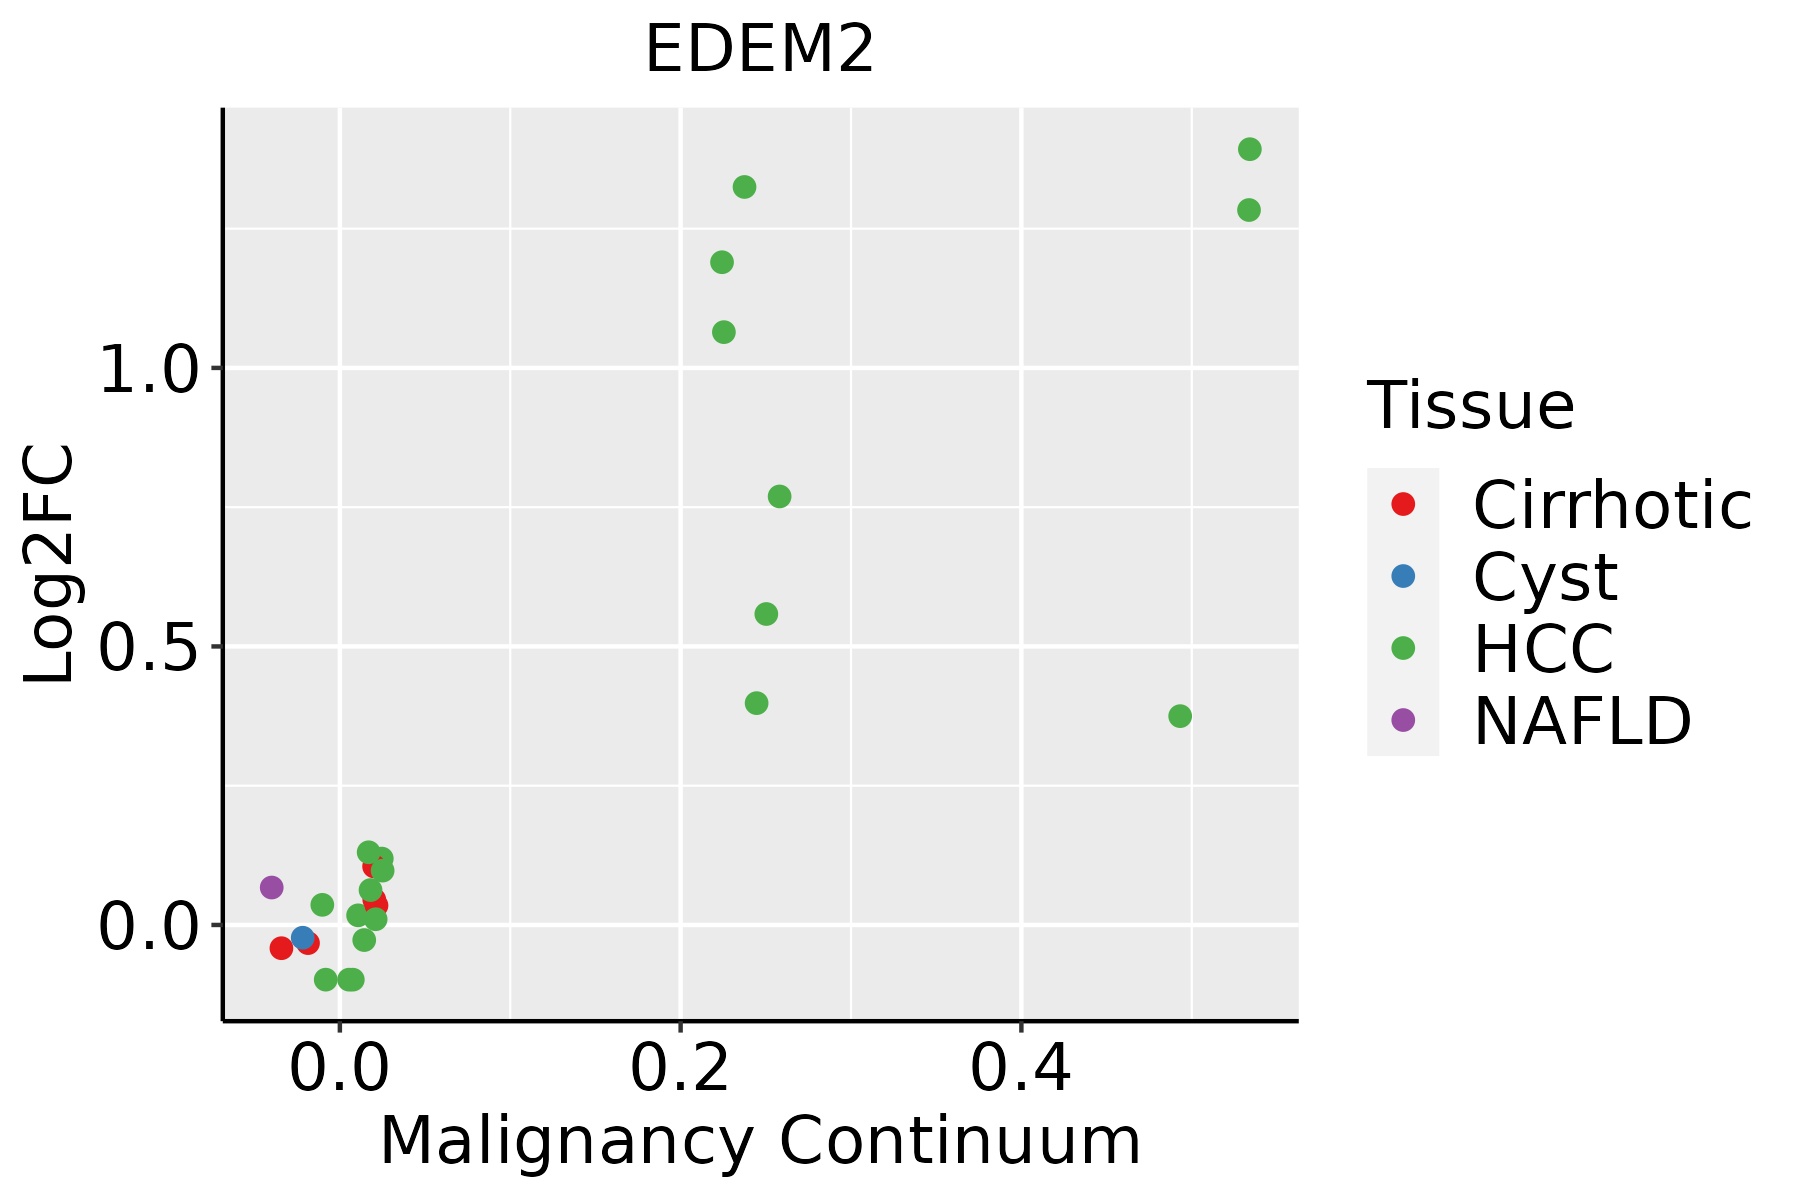 | HCC: Hepatocellular carcinoma |
| NAFLD: Non-alcoholic fatty liver disease |
| Oral Cavity | 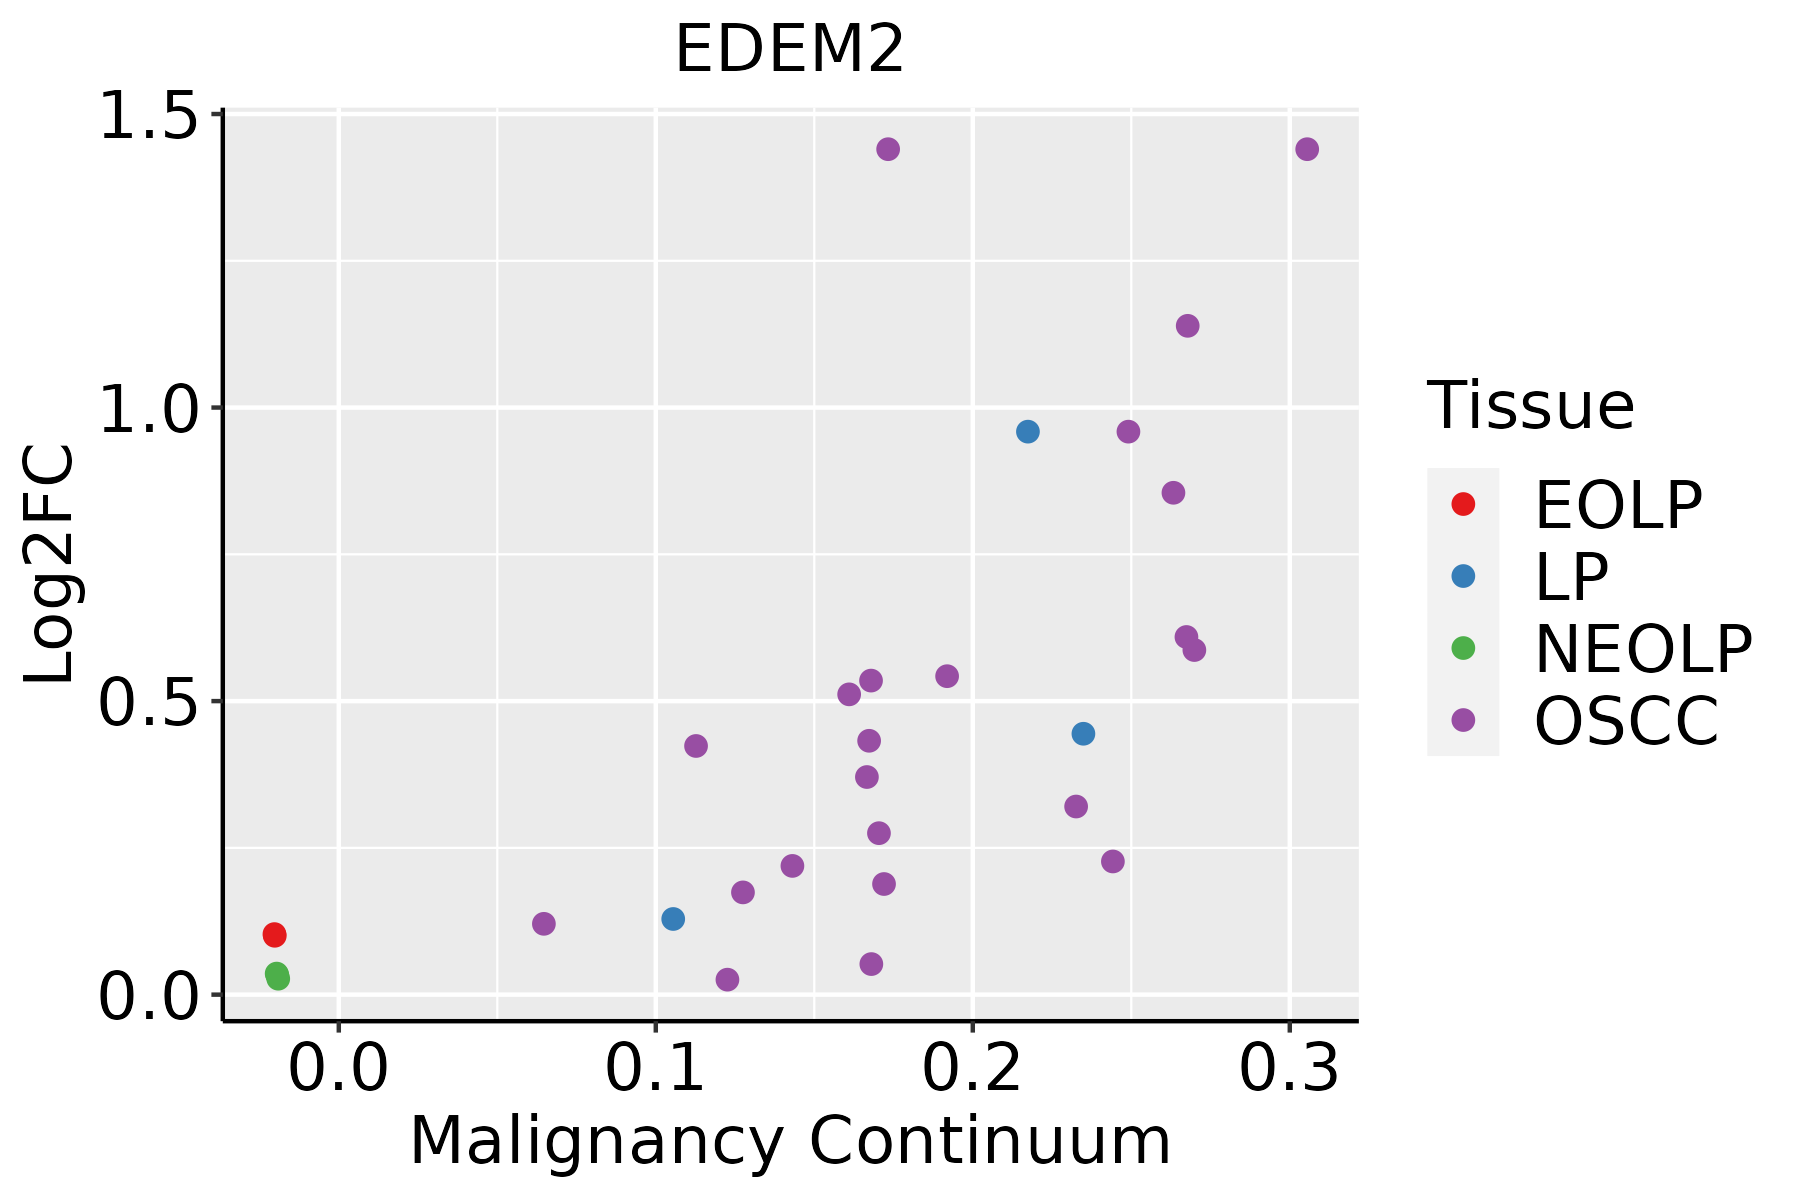 | EOLP: Erosive Oral lichen planus |
| LP: leukoplakia |
| NEOLP: Non-erosive oral lichen planus |
| OSCC: Oral squamous cell carcinoma |
| Thyroid | 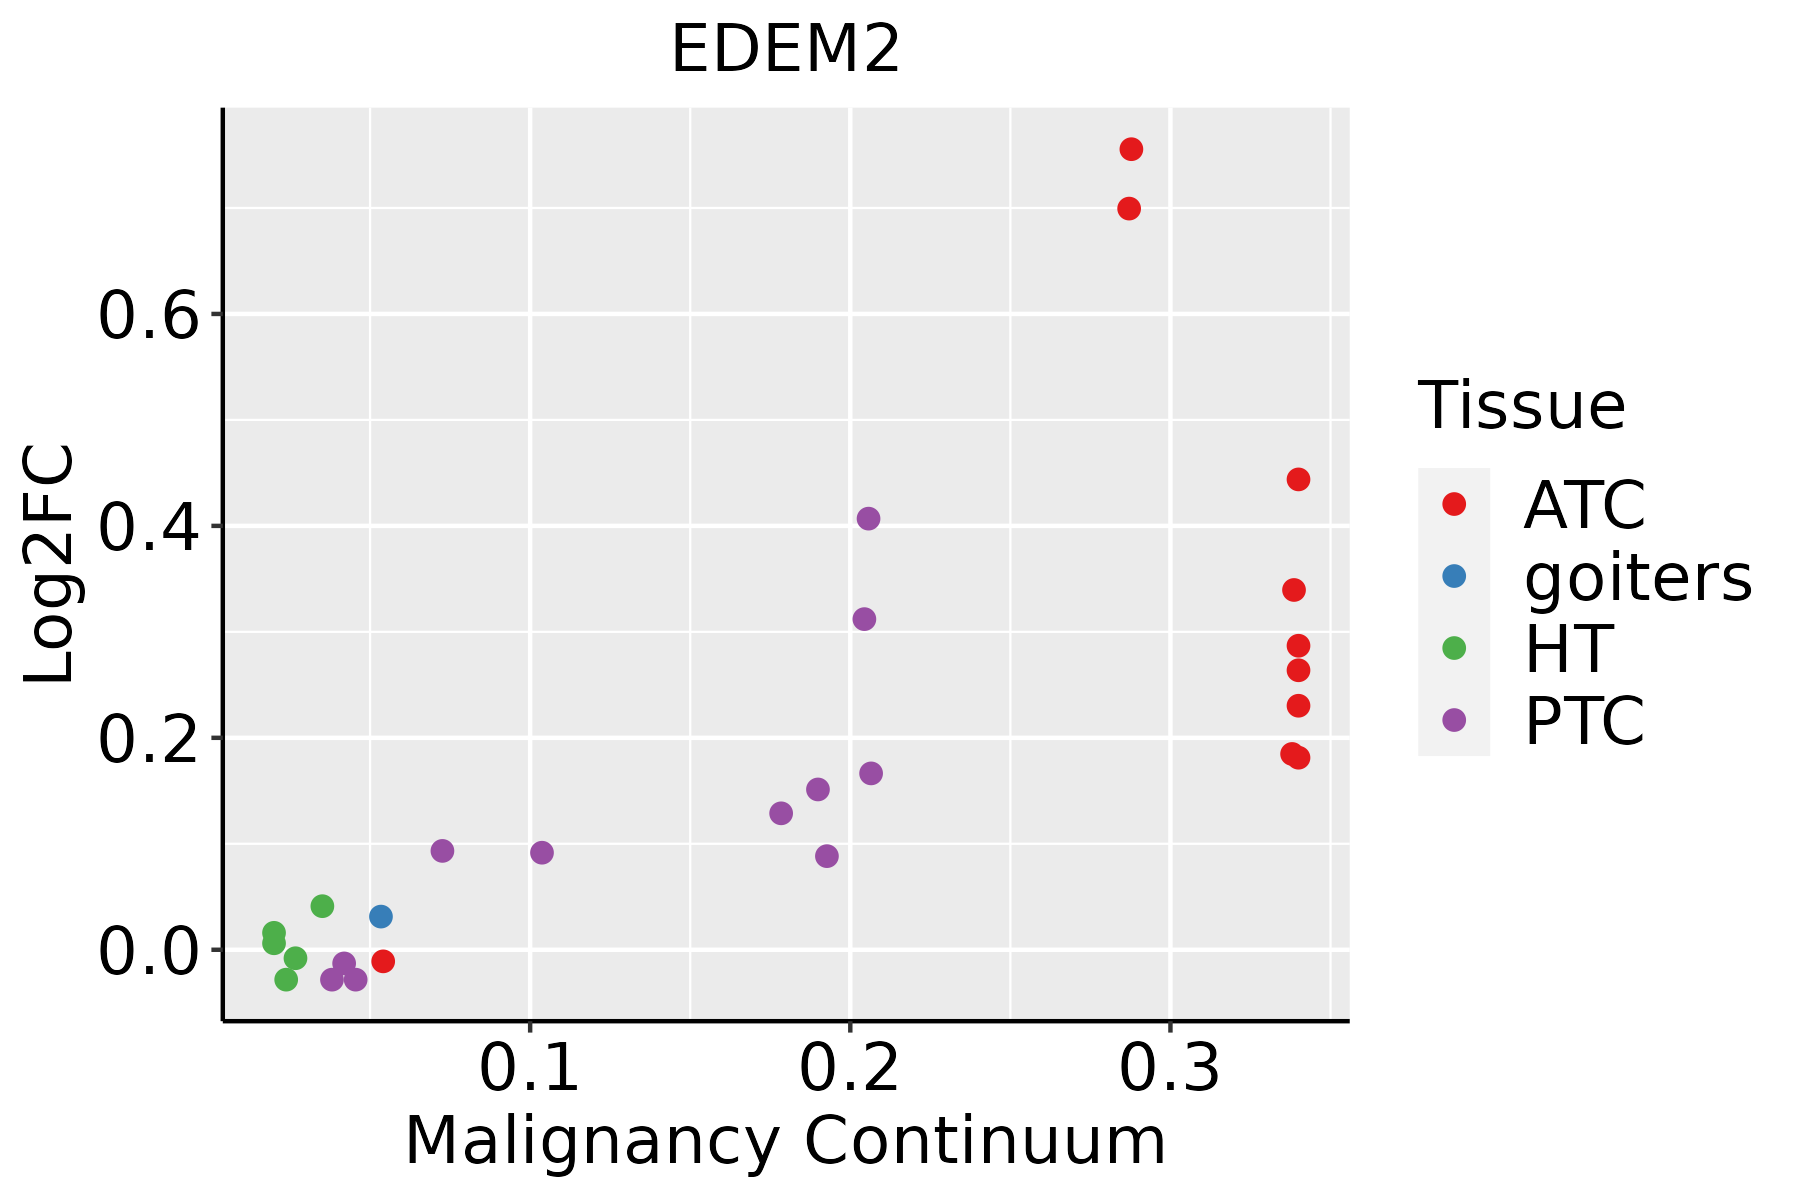 | ATC: Anaplastic thyroid cancer |
| HT: Hashimoto's thyroiditis |
| PTC: Papillary thyroid cancer |
| GO ID | Tissue | Disease Stage | Description | Gene Ratio | Bg Ratio | pvalue | p.adjust | Count |
| GO:001603234 | Thyroid | ATC | viral process | 241/6293 | 415/18723 | 5.50e-25 | 2.04e-22 | 241 |
| GO:003238632 | Thyroid | ATC | regulation of intracellular transport | 203/6293 | 337/18723 | 6.16e-24 | 1.85e-21 | 203 |
| GO:003315726 | Thyroid | ATC | regulation of intracellular protein transport | 147/6293 | 229/18723 | 2.01e-21 | 4.38e-19 | 147 |
| GO:003238825 | Thyroid | ATC | positive regulation of intracellular transport | 131/6293 | 202/18723 | 8.20e-20 | 1.24e-17 | 131 |
| GO:009031624 | Thyroid | ATC | positive regulation of intracellular protein transport | 107/6293 | 160/18723 | 6.82e-18 | 7.84e-16 | 107 |
| GO:190495128 | Thyroid | ATC | positive regulation of establishment of protein localization | 177/6293 | 319/18723 | 5.43e-16 | 4.29e-14 | 177 |
| GO:003596633 | Thyroid | ATC | response to topologically incorrect protein | 102/6293 | 159/18723 | 2.87e-15 | 1.99e-13 | 102 |
| GO:005122234 | Thyroid | ATC | positive regulation of protein transport | 165/6293 | 303/18723 | 4.94e-14 | 2.69e-12 | 165 |
| GO:000698633 | Thyroid | ATC | response to unfolded protein | 88/6293 | 137/18723 | 2.04e-13 | 9.91e-12 | 88 |
| GO:003650322 | Thyroid | ATC | ERAD pathway | 72/6293 | 107/18723 | 1.05e-12 | 4.41e-11 | 72 |
| GO:003043322 | Thyroid | ATC | ubiquitin-dependent ERAD pathway | 60/6293 | 85/18723 | 3.38e-12 | 1.38e-10 | 60 |
| GO:001908023 | Thyroid | ATC | viral gene expression | 64/6293 | 94/18723 | 8.44e-12 | 3.16e-10 | 64 |
| GO:003097015 | Thyroid | ATC | retrograde protein transport, ER to cytosol | 23/6293 | 29/18723 | 5.84e-07 | 8.19e-06 | 23 |
| GO:190351315 | Thyroid | ATC | endoplasmic reticulum to cytosol transport | 23/6293 | 29/18723 | 5.84e-07 | 8.19e-06 | 23 |
| GO:003252715 | Thyroid | ATC | protein exit from endoplasmic reticulum | 32/6293 | 48/18723 | 2.88e-06 | 3.30e-05 | 32 |
| GO:001908213 | Thyroid | ATC | viral protein processing | 18/6293 | 29/18723 | 1.58e-03 | 7.98e-03 | 18 |
| GO:007086113 | Thyroid | ATC | regulation of protein exit from endoplasmic reticulum | 17/6293 | 27/18723 | 1.70e-03 | 8.47e-03 | 17 |
| GO:190415212 | Thyroid | ATC | regulation of retrograde protein transport, ER to cytosol | 10/6293 | 14/18723 | 4.31e-03 | 1.80e-02 | 10 |
| GO:000910011 | Thyroid | ATC | glycoprotein metabolic process | 153/6293 | 387/18723 | 7.90e-03 | 3.06e-02 | 153 |
| GO:19011363 | Thyroid | ATC | carbohydrate derivative catabolic process | 73/6293 | 172/18723 | 9.43e-03 | 3.47e-02 | 73 |
| Pathway ID | Tissue | Disease Stage | Description | Gene Ratio | Bg Ratio | pvalue | p.adjust | qvalue | Count |
| hsa04141211 | Esophagus | ESCC | Protein processing in endoplasmic reticulum | 147/4205 | 174/8465 | 3.29e-22 | 1.10e-19 | 5.64e-20 | 147 |
| hsa04141310 | Esophagus | ESCC | Protein processing in endoplasmic reticulum | 147/4205 | 174/8465 | 3.29e-22 | 1.10e-19 | 5.64e-20 | 147 |
| hsa0414122 | Liver | HCC | Protein processing in endoplasmic reticulum | 146/4020 | 174/8465 | 7.34e-24 | 2.46e-21 | 1.37e-21 | 146 |
| hsa0414132 | Liver | HCC | Protein processing in endoplasmic reticulum | 146/4020 | 174/8465 | 7.34e-24 | 2.46e-21 | 1.37e-21 | 146 |
| hsa0414130 | Oral cavity | OSCC | Protein processing in endoplasmic reticulum | 143/3704 | 174/8465 | 6.82e-26 | 2.28e-23 | 1.16e-23 | 143 |
| hsa04141113 | Oral cavity | OSCC | Protein processing in endoplasmic reticulum | 143/3704 | 174/8465 | 6.82e-26 | 2.28e-23 | 1.16e-23 | 143 |
| hsa04141210 | Oral cavity | LP | Protein processing in endoplasmic reticulum | 113/2418 | 174/8465 | 8.74e-24 | 5.82e-22 | 3.76e-22 | 113 |
| hsa0414138 | Oral cavity | LP | Protein processing in endoplasmic reticulum | 113/2418 | 174/8465 | 8.74e-24 | 5.82e-22 | 3.76e-22 | 113 |
| hsa0414145 | Oral cavity | EOLP | Protein processing in endoplasmic reticulum | 70/1218 | 174/8465 | 2.84e-17 | 3.06e-15 | 1.81e-15 | 70 |
| hsa0414155 | Oral cavity | EOLP | Protein processing in endoplasmic reticulum | 70/1218 | 174/8465 | 2.84e-17 | 3.06e-15 | 1.81e-15 | 70 |
| Hugo Symbol | Variant Class | Variant Classification | dbSNP RS | HGVSc | HGVSp | HGVSp Short | SWISSPROT | BIOTYPE | SIFT | PolyPhen | Tumor Sample Barcode | Tissue | Histology | Sex | Age | Stage | Therapy Types | Drugs | Outcome |
| EDEM2 | SNV | Missense_Mutation | | c.1079C>A | p.Thr360Lys | p.T360K | Q9BV94 | protein_coding | deleterious(0.03) | possibly_damaging(0.725) | TCGA-A8-A075-01 | Breast | breast invasive carcinoma | Female | <65 | I/II | Chemotherapy | epirubicin | CR |
| EDEM2 | SNV | Missense_Mutation | rs140405715 | c.1132N>G | p.Met378Val | p.M378V | Q9BV94 | protein_coding | deleterious(0.04) | possibly_damaging(0.718) | TCGA-A8-A08S-01 | Breast | breast invasive carcinoma | Female | >=65 | I/II | Hormone Therapy | anastrozole | SD |
| EDEM2 | SNV | Missense_Mutation | novel | c.772N>A | p.Asp258Asn | p.D258N | Q9BV94 | protein_coding | deleterious(0) | probably_damaging(1) | TCGA-AC-A62V-01 | Breast | breast invasive carcinoma | Male | <65 | III/IV | Targeted Molecular therapy | denosumab | PD |
| EDEM2 | SNV | Missense_Mutation | rs754555510 | c.476N>A | p.Arg159Gln | p.R159Q | Q9BV94 | protein_coding | tolerated(0.29) | benign(0.145) | TCGA-AN-A0AK-01 | Breast | breast invasive carcinoma | Female | >=65 | I/II | Unknown | Unknown | SD |
| EDEM2 | SNV | Missense_Mutation | rs146309337 | c.1565N>T | p.Ser522Leu | p.S522L | Q9BV94 | protein_coding | tolerated(0.32) | benign(0) | TCGA-B6-A402-01 | Breast | breast invasive carcinoma | Female | <65 | I/II | Chemotherapy | cyclophosphamide | PD |
| EDEM2 | SNV | Missense_Mutation | | c.1706T>C | p.Leu569Ser | p.L569S | Q9BV94 | protein_coding | deleterious_low_confidence(0) | benign(0.075) | TCGA-D8-A1XQ-01 | Breast | breast invasive carcinoma | Female | >=65 | I/II | Unknown | Unknown | SD |
| EDEM2 | SNV | Missense_Mutation | novel | c.1042N>C | p.Gly348Arg | p.G348R | Q9BV94 | protein_coding | tolerated(0.06) | probably_damaging(0.964) | TCGA-GI-A2C9-01 | Breast | breast invasive carcinoma | Female | <65 | I/II | Unspecific | | SD |
| EDEM2 | insertion | In_Frame_Ins | novel | c.300_301insTCATTCTTATAC | p.Val100_Leu101insSerPheLeuTyr | p.V100_L101insSFLY | Q9BV94 | protein_coding | | | TCGA-B6-A0IA-01 | Breast | breast invasive carcinoma | Female | <65 | I/II | Unknown | Unknown | SD |
| EDEM2 | insertion | Nonsense_Mutation | novel | c.299_300insTTGTCATCTGTAAATGAAG | p.Leu101CysfsTer4 | p.L101Cfs*4 | Q9BV94 | protein_coding | | | TCGA-B6-A0IA-01 | Breast | breast invasive carcinoma | Female | <65 | I/II | Unknown | Unknown | SD |
| EDEM2 | insertion | Frame_Shift_Ins | novel | c.761_762insAGTGCCTGCAGAATCAGTTCTGAATTCAGAGTCACTAT | p.Ala255ValfsTer24 | p.A255Vfs*24 | Q9BV94 | protein_coding | | | TCGA-BH-A0DP-01 | Breast | breast invasive carcinoma | Female | <65 | I/II | Hormone Therapy | arimidex | SD |


