
|
|||||
|
 | |
| |
| |
| |
| |
| |
|
Gene: DRG1 |
Gene summary for DRG1 |
| Gene information | Species | Human | Gene symbol | DRG1 | Gene ID | 4733 |
| Gene name | developmentally regulated GTP binding protein 1 | |
| Gene Alias | NEDD3 | |
| Cytomap | 22q12.2 | |
| Gene Type | protein-coding | GO ID | GO:0000226 | UniProtAcc | Q9Y295 |
Top |
Malignant transformation analysis |
| Identification of the aberrant gene expression in precancerous and cancerous lesions by comparing the gene expression of stem-like cells in diseased tissues with normal stem cells |
| Entrez ID | Symbol | Replicates | Species | Organ | Tissue | Adj P-value | Log2FC | Malignancy |
| 4733 | DRG1 | LZE4T | Human | Esophagus | ESCC | 2.63e-20 | 4.10e-01 | 0.0811 |
| 4733 | DRG1 | LZE7T | Human | Esophagus | ESCC | 7.88e-14 | 8.02e-01 | 0.0667 |
| 4733 | DRG1 | LZE8T | Human | Esophagus | ESCC | 3.29e-10 | 3.70e-01 | 0.067 |
| 4733 | DRG1 | LZE20T | Human | Esophagus | ESCC | 1.13e-04 | 1.14e-01 | 0.0662 |
| 4733 | DRG1 | LZE24T | Human | Esophagus | ESCC | 1.10e-25 | 5.86e-01 | 0.0596 |
| 4733 | DRG1 | LZE21T | Human | Esophagus | ESCC | 6.09e-07 | 3.31e-01 | 0.0655 |
| 4733 | DRG1 | LZE6T | Human | Esophagus | ESCC | 5.66e-06 | 3.69e-01 | 0.0845 |
| 4733 | DRG1 | P1T-E | Human | Esophagus | ESCC | 5.41e-12 | 6.16e-01 | 0.0875 |
| 4733 | DRG1 | P2T-E | Human | Esophagus | ESCC | 4.16e-38 | 6.69e-01 | 0.1177 |
| 4733 | DRG1 | P4T-E | Human | Esophagus | ESCC | 2.78e-38 | 8.10e-01 | 0.1323 |
| 4733 | DRG1 | P5T-E | Human | Esophagus | ESCC | 3.34e-22 | 3.03e-01 | 0.1327 |
| 4733 | DRG1 | P8T-E | Human | Esophagus | ESCC | 2.63e-31 | 6.08e-01 | 0.0889 |
| 4733 | DRG1 | P9T-E | Human | Esophagus | ESCC | 1.31e-20 | 4.95e-01 | 0.1131 |
| 4733 | DRG1 | P10T-E | Human | Esophagus | ESCC | 5.54e-47 | 7.47e-01 | 0.116 |
| 4733 | DRG1 | P11T-E | Human | Esophagus | ESCC | 5.90e-24 | 8.70e-01 | 0.1426 |
| 4733 | DRG1 | P12T-E | Human | Esophagus | ESCC | 1.77e-38 | 7.23e-01 | 0.1122 |
| 4733 | DRG1 | P15T-E | Human | Esophagus | ESCC | 3.26e-31 | 6.50e-01 | 0.1149 |
| 4733 | DRG1 | P16T-E | Human | Esophagus | ESCC | 3.56e-58 | 9.95e-01 | 0.1153 |
| 4733 | DRG1 | P17T-E | Human | Esophagus | ESCC | 3.04e-11 | 6.77e-01 | 0.1278 |
| 4733 | DRG1 | P19T-E | Human | Esophagus | ESCC | 6.28e-08 | 7.63e-01 | 0.1662 |
| Page: 1 2 3 4 5 6 |
| Tissue | Expression Dynamics | Abbreviation |
| Esophagus | 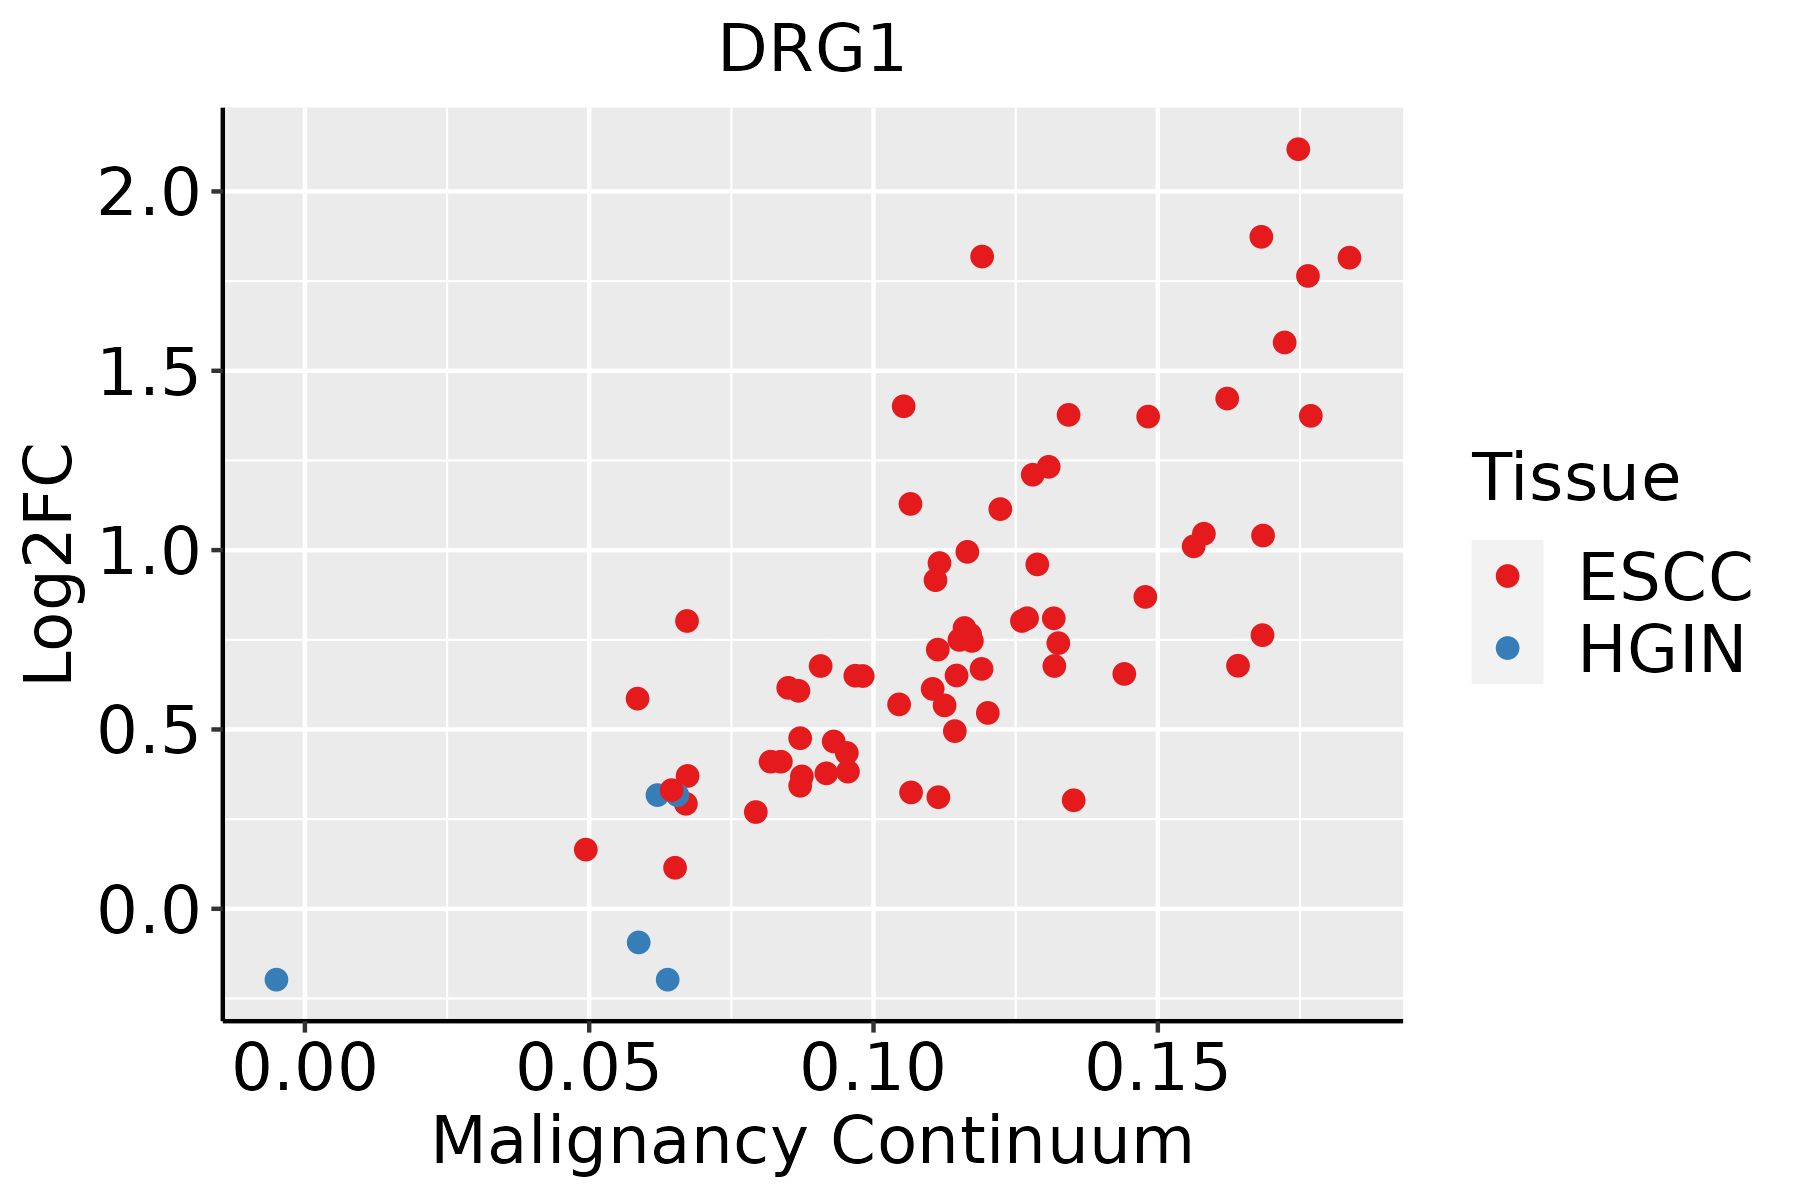 | ESCC: Esophageal squamous cell carcinoma |
| HGIN: High-grade intraepithelial neoplasias | ||
| LGIN: Low-grade intraepithelial neoplasias | ||
| Liver | 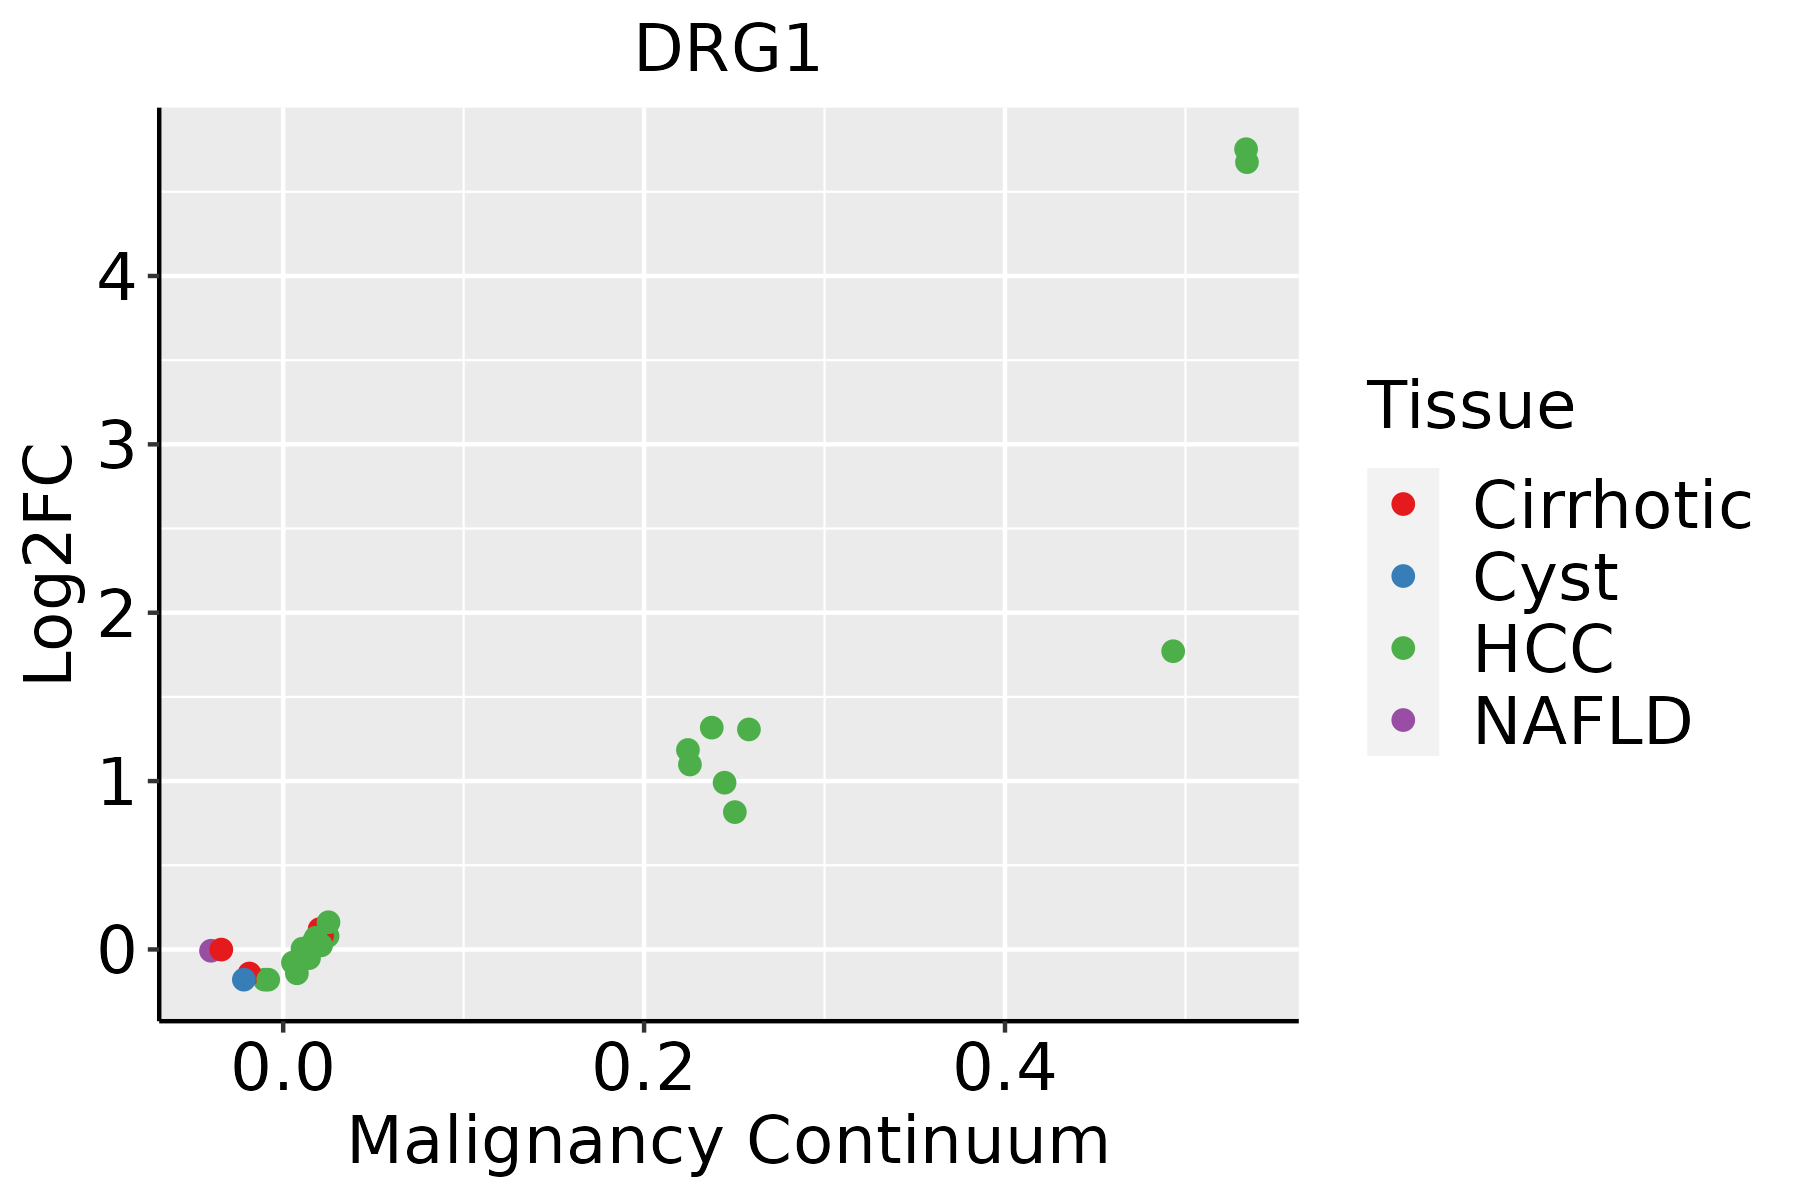 | HCC: Hepatocellular carcinoma |
| NAFLD: Non-alcoholic fatty liver disease | ||
| Oral Cavity | 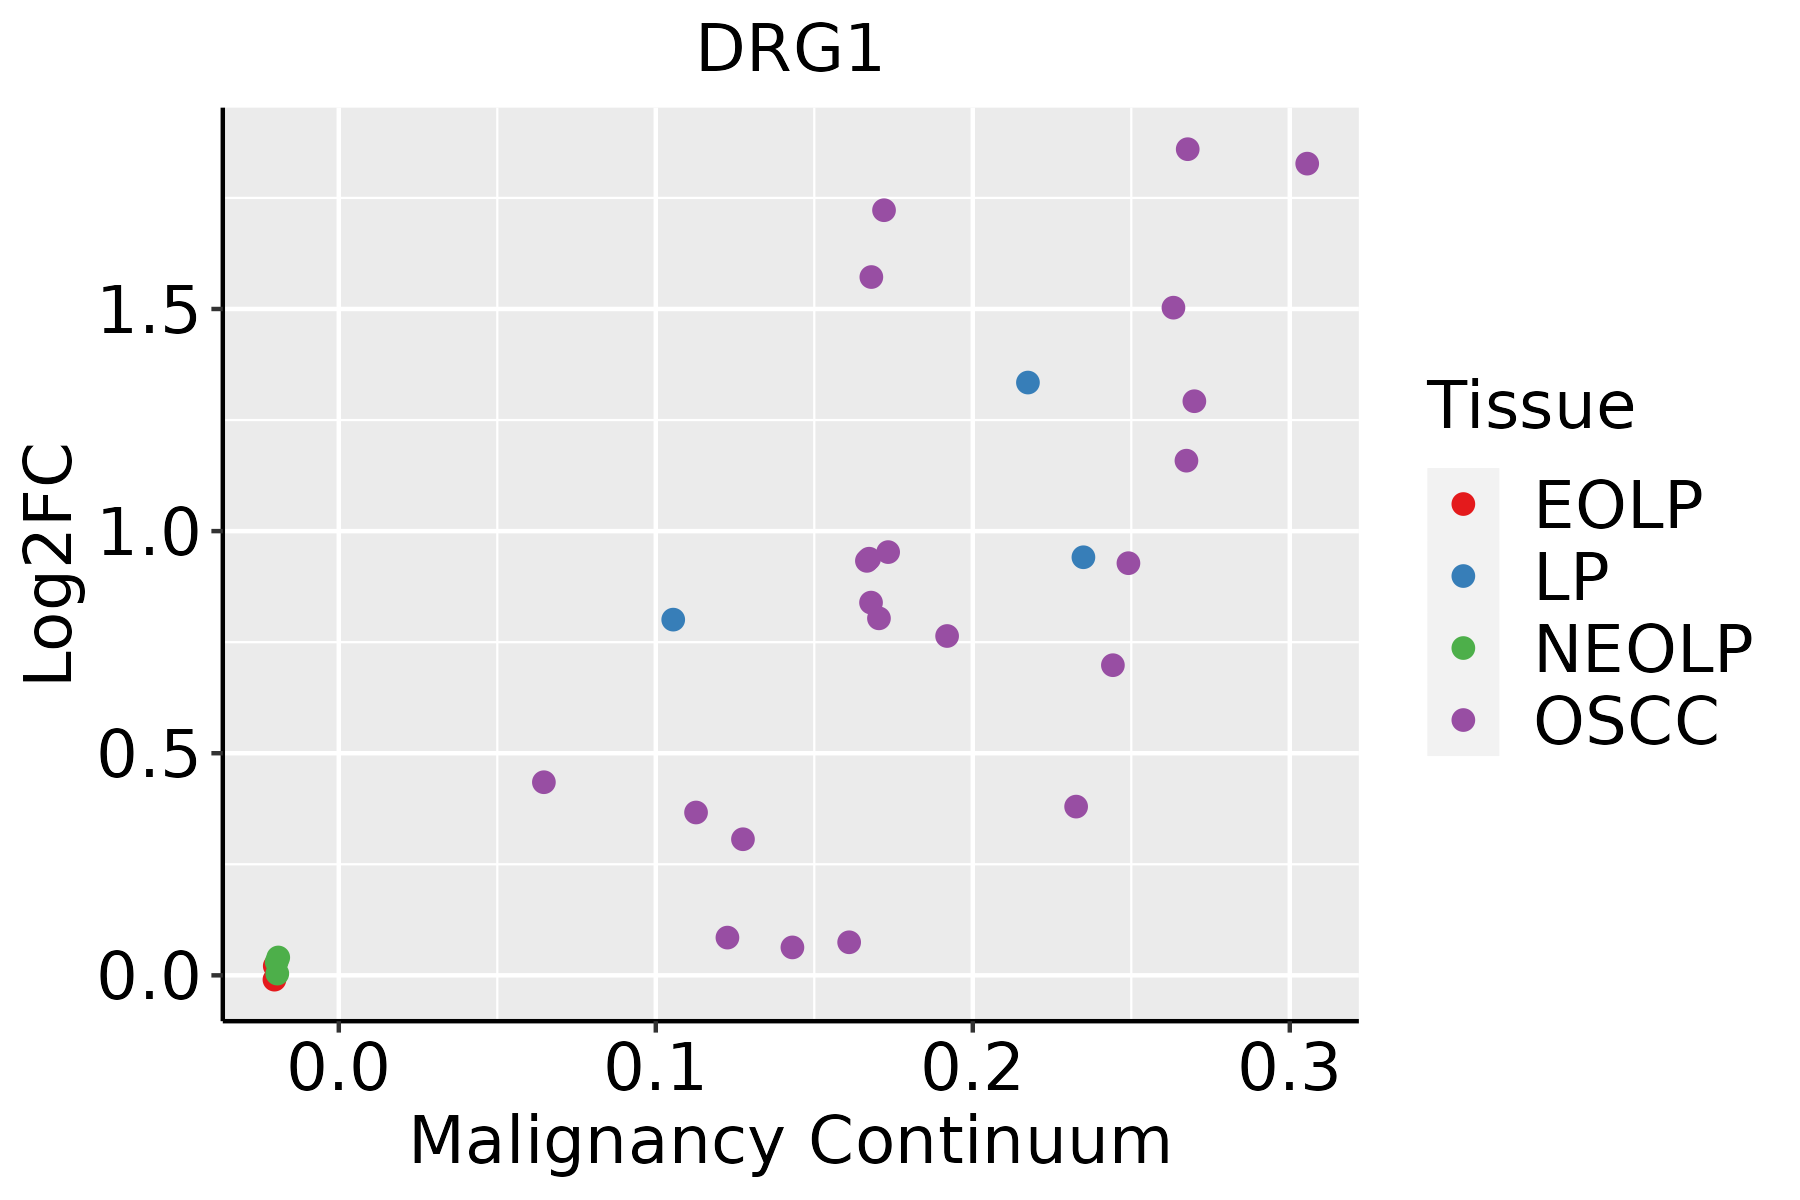 | EOLP: Erosive Oral lichen planus |
| LP: leukoplakia | ||
| NEOLP: Non-erosive oral lichen planus | ||
| OSCC: Oral squamous cell carcinoma | ||
| Skin |  | AK: Actinic keratosis |
| cSCC: Cutaneous squamous cell carcinoma | ||
| SCCIS:squamous cell carcinoma in situ |
| ∗log2FC in expression of this searched gene in stem-like cells from each diseased tissue sample relative to stem-like cells in normal samples in each tissue plotted against the malignancy continuum. Samples are colored based on if they are from different disease stage. |
Top |
Malignant transformation related pathway analysis |
| Find out the enriched GO biological processes and KEGG pathways involved in transition from healthy to precancer to cancer |
| Tissue | Disease Stage | Enriched GO biological Processes |
| Colorectum | AD |  |
| Colorectum | SER |  |
| Colorectum | MSS |  |
| Colorectum | MSI-H |  |
| Colorectum | FAP |  |
| ∗Top 15 enriched GO BP terms are showed in the bar plot of each disease state in each tissue. Each row represents a significant GO biological process which is colored according to the -log10(p.adjust). |
| Page: 1 2 3 4 5 6 7 8 9 |
| GO ID | Tissue | Disease Stage | Description | Gene Ratio | Bg Ratio | pvalue | p.adjust | Count |
| GO:0071453110 | Esophagus | ESCC | cellular response to oxygen levels | 114/8552 | 177/18723 | 3.63e-07 | 5.06e-06 | 114 |
| GO:0036294110 | Esophagus | ESCC | cellular response to decreased oxygen levels | 105/8552 | 161/18723 | 4.20e-07 | 5.73e-06 | 105 |
| GO:0032271111 | Esophagus | ESCC | regulation of protein polymerization | 143/8552 | 233/18723 | 9.21e-07 | 1.17e-05 | 143 |
| GO:0030330110 | Esophagus | ESCC | DNA damage response, signal transduction by p53 class mediator | 53/8552 | 72/18723 | 1.34e-06 | 1.63e-05 | 53 |
| GO:007145616 | Esophagus | ESCC | cellular response to hypoxia | 97/8552 | 151/18723 | 3.12e-06 | 3.51e-05 | 97 |
| GO:190211514 | Esophagus | ESCC | regulation of organelle assembly | 116/8552 | 186/18723 | 3.15e-06 | 3.53e-05 | 116 |
| GO:009022413 | Esophagus | ESCC | regulation of spindle organization | 32/8552 | 39/18723 | 3.27e-06 | 3.65e-05 | 32 |
| GO:006023614 | Esophagus | ESCC | regulation of mitotic spindle organization | 29/8552 | 35/18723 | 6.61e-06 | 6.75e-05 | 29 |
| GO:00425524 | Esophagus | ESCC | myelination | 85/8552 | 134/18723 | 2.51e-05 | 2.13e-04 | 85 |
| GO:00072724 | Esophagus | ESCC | ensheathment of neurons | 86/8552 | 136/18723 | 2.68e-05 | 2.24e-04 | 86 |
| GO:00083664 | Esophagus | ESCC | axon ensheathment | 86/8552 | 136/18723 | 2.68e-05 | 2.24e-04 | 86 |
| GO:00420636 | Esophagus | ESCC | gliogenesis | 172/8552 | 301/18723 | 3.75e-05 | 3.04e-04 | 172 |
| GO:00311128 | Esophagus | ESCC | positive regulation of microtubule polymerization or depolymerization | 29/8552 | 37/18723 | 4.97e-05 | 3.86e-04 | 29 |
| GO:001003827 | Esophagus | ESCC | response to metal ion | 208/8552 | 373/18723 | 5.02e-05 | 3.90e-04 | 208 |
| GO:00311094 | Esophagus | ESCC | microtubule polymerization or depolymerization | 77/8552 | 122/18723 | 7.60e-05 | 5.68e-04 | 77 |
| GO:009016914 | Esophagus | ESCC | regulation of spindle assembly | 21/8552 | 25/18723 | 9.12e-05 | 6.54e-04 | 21 |
| GO:00311168 | Esophagus | ESCC | positive regulation of microtubule polymerization | 26/8552 | 33/18723 | 1.06e-04 | 7.43e-04 | 26 |
| GO:00467856 | Esophagus | ESCC | microtubule polymerization | 55/8552 | 83/18723 | 1.21e-04 | 8.31e-04 | 55 |
| GO:00311104 | Esophagus | ESCC | regulation of microtubule polymerization or depolymerization | 57/8552 | 88/18723 | 2.32e-04 | 1.44e-03 | 57 |
| GO:00100016 | Esophagus | ESCC | glial cell differentiation | 129/8552 | 225/18723 | 2.73e-04 | 1.65e-03 | 129 |
| Page: 1 2 3 4 5 6 7 8 9 10 11 12 13 14 15 16 17 18 19 20 21 22 23 24 25 26 27 28 |
| Pathway ID | Tissue | Disease Stage | Description | Gene Ratio | Bg Ratio | pvalue | p.adjust | qvalue | Count |
| Page: 1 |
Top |
Cell-cell communication analysis |
| Identification of potential cell-cell interactions between two cell types and their ligand-receptor pairs for different disease states |
| Ligand | Receptor | LRpair | Pathway | Tissue | Disease Stage |
| Page: 1 |
Top |
Single-cell gene regulatory network inference analysis |
| Find out the significant the regulons (TFs) and the target genes of each regulon across cell types for different disease states |
| TF | Cell Type | Tissue | Disease Stage | Target Gene | RSS | Regulon Activity |
| ∗The dot plots of a searched regulon are shown for all cell subpopulations in each disease state of each tissue based on the regulon specific score inferred using pySCENIC and by calculating the average expression. |
| Page: 1 |
Top |
Somatic mutation of malignant transformation related genes |
| Annotation of somatic variants for genes involved in malignant transformation |
| Hugo Symbol | Variant Class | Variant Classification | dbSNP RS | HGVSc | HGVSp | HGVSp Short | SWISSPROT | BIOTYPE | SIFT | PolyPhen | Tumor Sample Barcode | Tissue | Histology | Sex | Age | Stage | Therapy Types | Drugs | Outcome |
| DRG1 | SNV | Missense_Mutation | c.732C>G | p.Ile244Met | p.I244M | Q9Y295 | protein_coding | deleterious(0.01) | possibly_damaging(0.648) | TCGA-AN-A0XW-01 | Breast | breast invasive carcinoma | Female | <65 | III/IV | Unknown | Unknown | SD | |
| DRG1 | SNV | Missense_Mutation | c.639N>C | p.Lys213Asn | p.K213N | Q9Y295 | protein_coding | deleterious(0.01) | probably_damaging(0.931) | TCGA-C8-A1HM-01 | Breast | breast invasive carcinoma | Female | >=65 | I/II | Chemotherapy | doxorubicin | CR | |
| DRG1 | SNV | Missense_Mutation | c.824N>C | p.Arg275Pro | p.R275P | Q9Y295 | protein_coding | tolerated(0.2) | benign(0.125) | TCGA-E9-A1NI-01 | Breast | breast invasive carcinoma | Female | <65 | I/II | Chemotherapy | doxorubicin | CR | |
| DRG1 | insertion | Nonsense_Mutation | novel | c.826_827insGACATCAGACCA | p.Trp276delinsTer | p.W276delins* | Q9Y295 | protein_coding | TCGA-E9-A1NI-01 | Breast | breast invasive carcinoma | Female | <65 | I/II | Chemotherapy | doxorubicin | CR | ||
| DRG1 | SNV | Missense_Mutation | novel | c.920N>T | p.Ser307Phe | p.S307F | Q9Y295 | protein_coding | deleterious(0) | possibly_damaging(0.489) | TCGA-C5-A1M7-01 | Cervix | cervical & endocervical cancer | Female | <65 | I/II | Unknown | Unknown | SD |
| DRG1 | SNV | Missense_Mutation | c.682N>A | p.Asp228Asn | p.D228N | Q9Y295 | protein_coding | deleterious(0) | possibly_damaging(0.77) | TCGA-DS-A1OC-01 | Cervix | cervical & endocervical cancer | Female | <65 | I/II | Chemotherapy | gemcitabine | SD | |
| DRG1 | SNV | Missense_Mutation | novel | c.467G>A | p.Gly156Glu | p.G156E | Q9Y295 | protein_coding | tolerated(1) | benign(0) | TCGA-A6-6141-01 | Colorectum | colon adenocarcinoma | Male | <65 | I/II | Chemotherapy | 5-fu | SD |
| DRG1 | SNV | Missense_Mutation | rs369620921 | c.824N>A | p.Arg275His | p.R275H | Q9Y295 | protein_coding | tolerated(0.12) | benign(0) | TCGA-AA-3510-01 | Colorectum | colon adenocarcinoma | Male | >=65 | I/II | Unknown | Unknown | SD |
| DRG1 | SNV | Missense_Mutation | c.179N>T | p.Ala60Val | p.A60V | Q9Y295 | protein_coding | tolerated(0.09) | benign(0.014) | TCGA-CM-6674-01 | Colorectum | colon adenocarcinoma | Male | <65 | I/II | Unknown | Unknown | SD | |
| DRG1 | SNV | Missense_Mutation | c.250N>A | p.Leu84Met | p.L84M | Q9Y295 | protein_coding | tolerated(0.1) | possibly_damaging(0.511) | TCGA-D5-6928-01 | Colorectum | colon adenocarcinoma | Male | >=65 | I/II | Unknown | Unknown | SD |
| Page: 1 2 3 4 |
Top |
Related drugs of malignant transformation related genes |
| Identification of chemicals and drugs interact with genes involved in malignant transfromation |
| (DGIdb 4.0) |
| Entrez ID | Symbol | Category | Interaction Types | Drug Claim Name | Drug Name | PMIDs |
| Page: 1 |

Copyright 2023-Present -The University of Texas Health Science Center at Houston |