
|
|||||
|
 | |
| |
| |
| |
| |
| |
|
Gene: DEK |
Gene summary for DEK |
| Gene information | Species | Human | Gene symbol | DEK | Gene ID | 7913 |
| Gene name | DEK proto-oncogene | |
| Gene Alias | D6S231E | |
| Cytomap | 6p22.3 | |
| Gene Type | protein-coding | GO ID | GO:0006139 | UniProtAcc | P35659 |
Top |
Malignant transformation analysis |
| Identification of the aberrant gene expression in precancerous and cancerous lesions by comparing the gene expression of stem-like cells in diseased tissues with normal stem cells |
| Entrez ID | Symbol | Replicates | Species | Organ | Tissue | Adj P-value | Log2FC | Malignancy |
| 7913 | DEK | GSM4909281 | Human | Breast | IDC | 1.38e-62 | 8.81e-01 | 0.21 |
| 7913 | DEK | GSM4909282 | Human | Breast | IDC | 2.90e-71 | 9.17e-01 | -0.0288 |
| 7913 | DEK | GSM4909285 | Human | Breast | IDC | 6.44e-22 | 5.03e-01 | 0.21 |
| 7913 | DEK | GSM4909286 | Human | Breast | IDC | 8.45e-17 | 4.33e-01 | 0.1081 |
| 7913 | DEK | GSM4909287 | Human | Breast | IDC | 7.86e-08 | 3.00e-01 | 0.2057 |
| 7913 | DEK | GSM4909288 | Human | Breast | IDC | 2.36e-11 | 2.97e-01 | 0.0988 |
| 7913 | DEK | GSM4909289 | Human | Breast | IDC | 2.55e-22 | 8.93e-01 | 0.1064 |
| 7913 | DEK | GSM4909293 | Human | Breast | IDC | 2.38e-05 | 2.17e-01 | 0.1581 |
| 7913 | DEK | GSM4909294 | Human | Breast | IDC | 2.76e-07 | -3.76e-01 | 0.2022 |
| 7913 | DEK | GSM4909296 | Human | Breast | IDC | 7.10e-11 | -3.20e-01 | 0.1524 |
| 7913 | DEK | GSM4909297 | Human | Breast | IDC | 1.91e-13 | -2.51e-01 | 0.1517 |
| 7913 | DEK | GSM4909298 | Human | Breast | IDC | 9.09e-04 | 2.08e-01 | 0.1551 |
| 7913 | DEK | GSM4909302 | Human | Breast | IDC | 1.62e-02 | -2.79e-01 | 0.1545 |
| 7913 | DEK | GSM4909311 | Human | Breast | IDC | 1.46e-31 | -3.46e-01 | 0.1534 |
| 7913 | DEK | GSM4909312 | Human | Breast | IDC | 1.83e-15 | 3.17e-02 | 0.1552 |
| 7913 | DEK | GSM4909313 | Human | Breast | IDC | 2.61e-02 | -1.37e-01 | 0.0391 |
| 7913 | DEK | GSM4909316 | Human | Breast | IDC | 3.23e-02 | -2.89e-01 | 0.21 |
| 7913 | DEK | GSM4909319 | Human | Breast | IDC | 6.96e-40 | -3.08e-01 | 0.1563 |
| 7913 | DEK | GSM4909320 | Human | Breast | IDC | 3.41e-08 | -2.13e-01 | 0.1575 |
| 7913 | DEK | GSM4909321 | Human | Breast | IDC | 4.35e-18 | -2.95e-01 | 0.1559 |
| Page: 1 2 3 4 5 6 7 8 9 10 11 12 |
| Tissue | Expression Dynamics | Abbreviation |
| Breast | 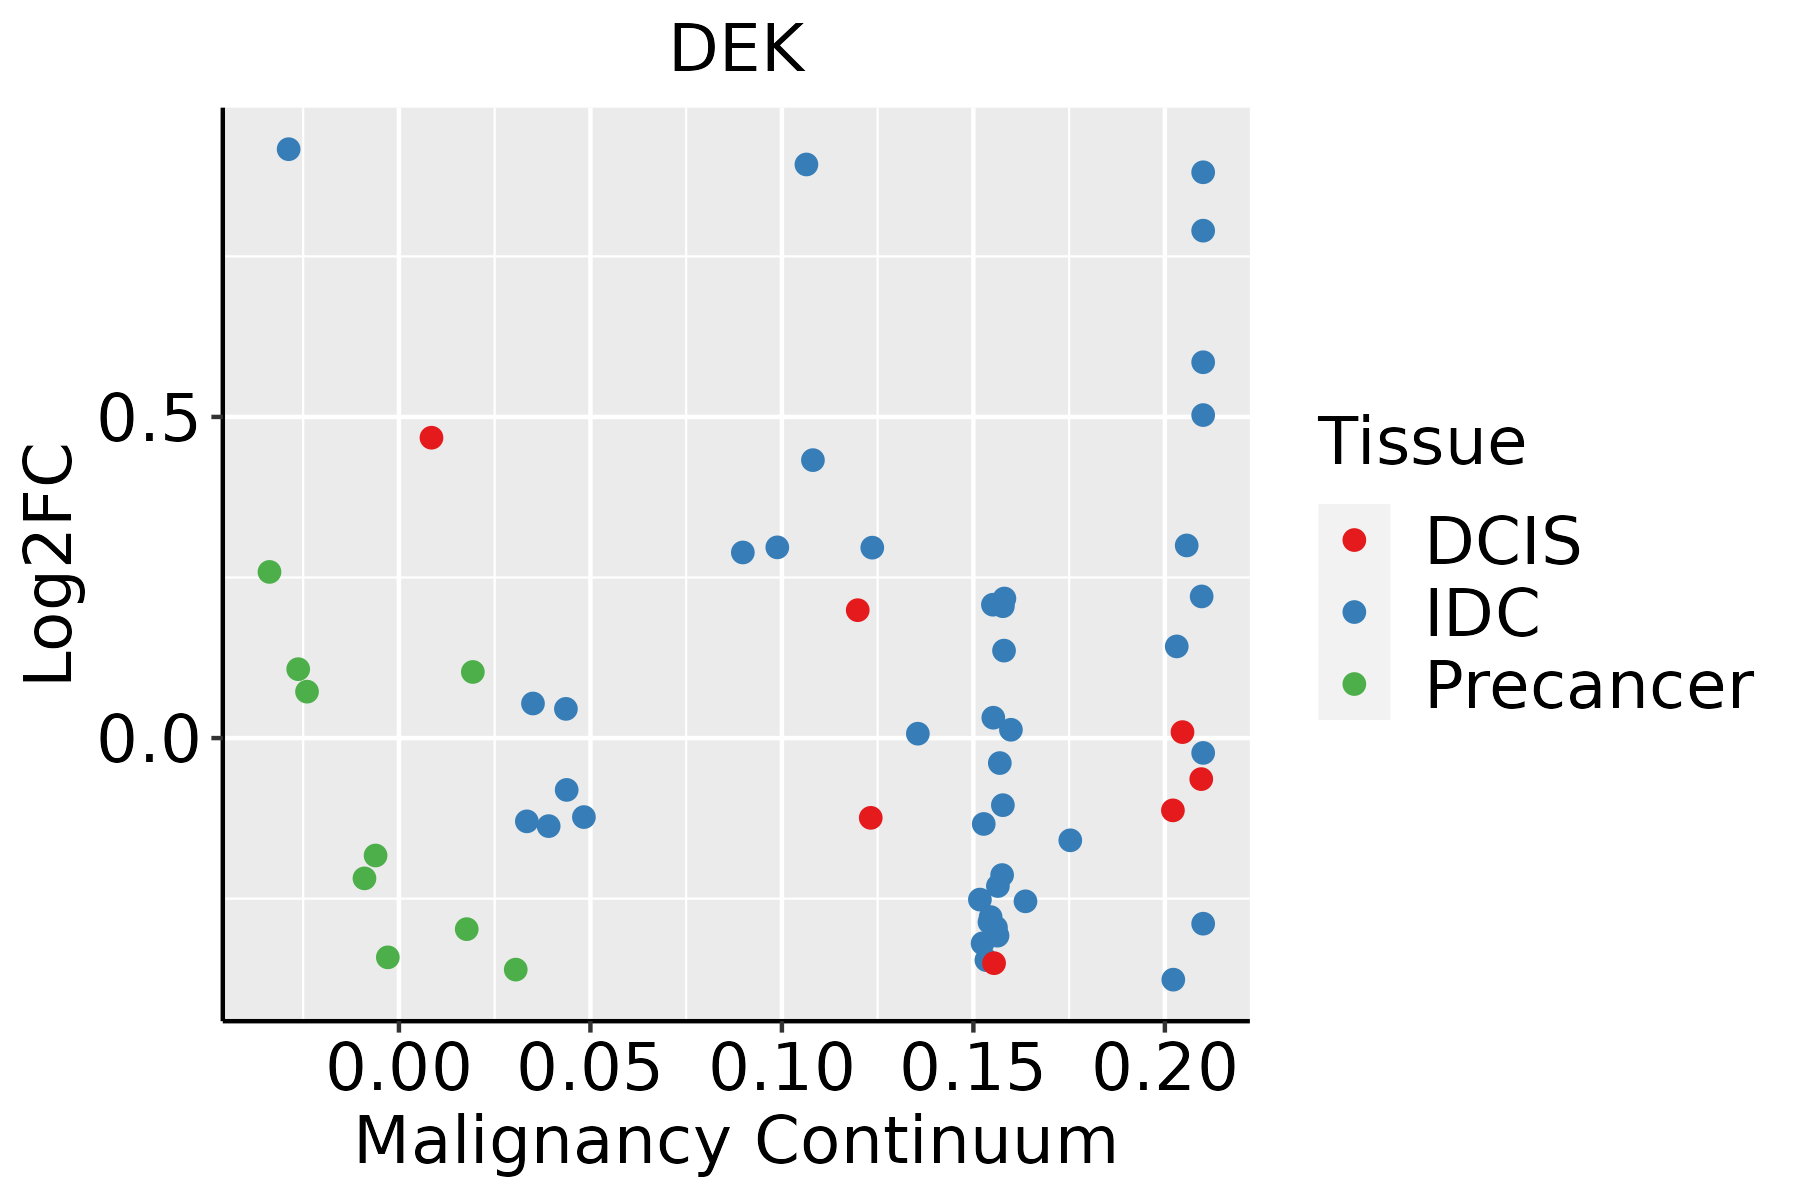 | IDC: Invasive ductal carcinoma |
| DCIS: Ductal carcinoma in situ | ||
| Precancer(BRCA1-mut): Precancerous lesion from BRCA1 mutation carriers | ||
| Colorectum (GSE201348) |  | FAP: Familial adenomatous polyposis |
| CRC: Colorectal cancer | ||
| Colorectum (HTA11) |  | AD: Adenomas |
| SER: Sessile serrated lesions | ||
| MSI-H: Microsatellite-high colorectal cancer | ||
| MSS: Microsatellite stable colorectal cancer | ||
| Endometrium | 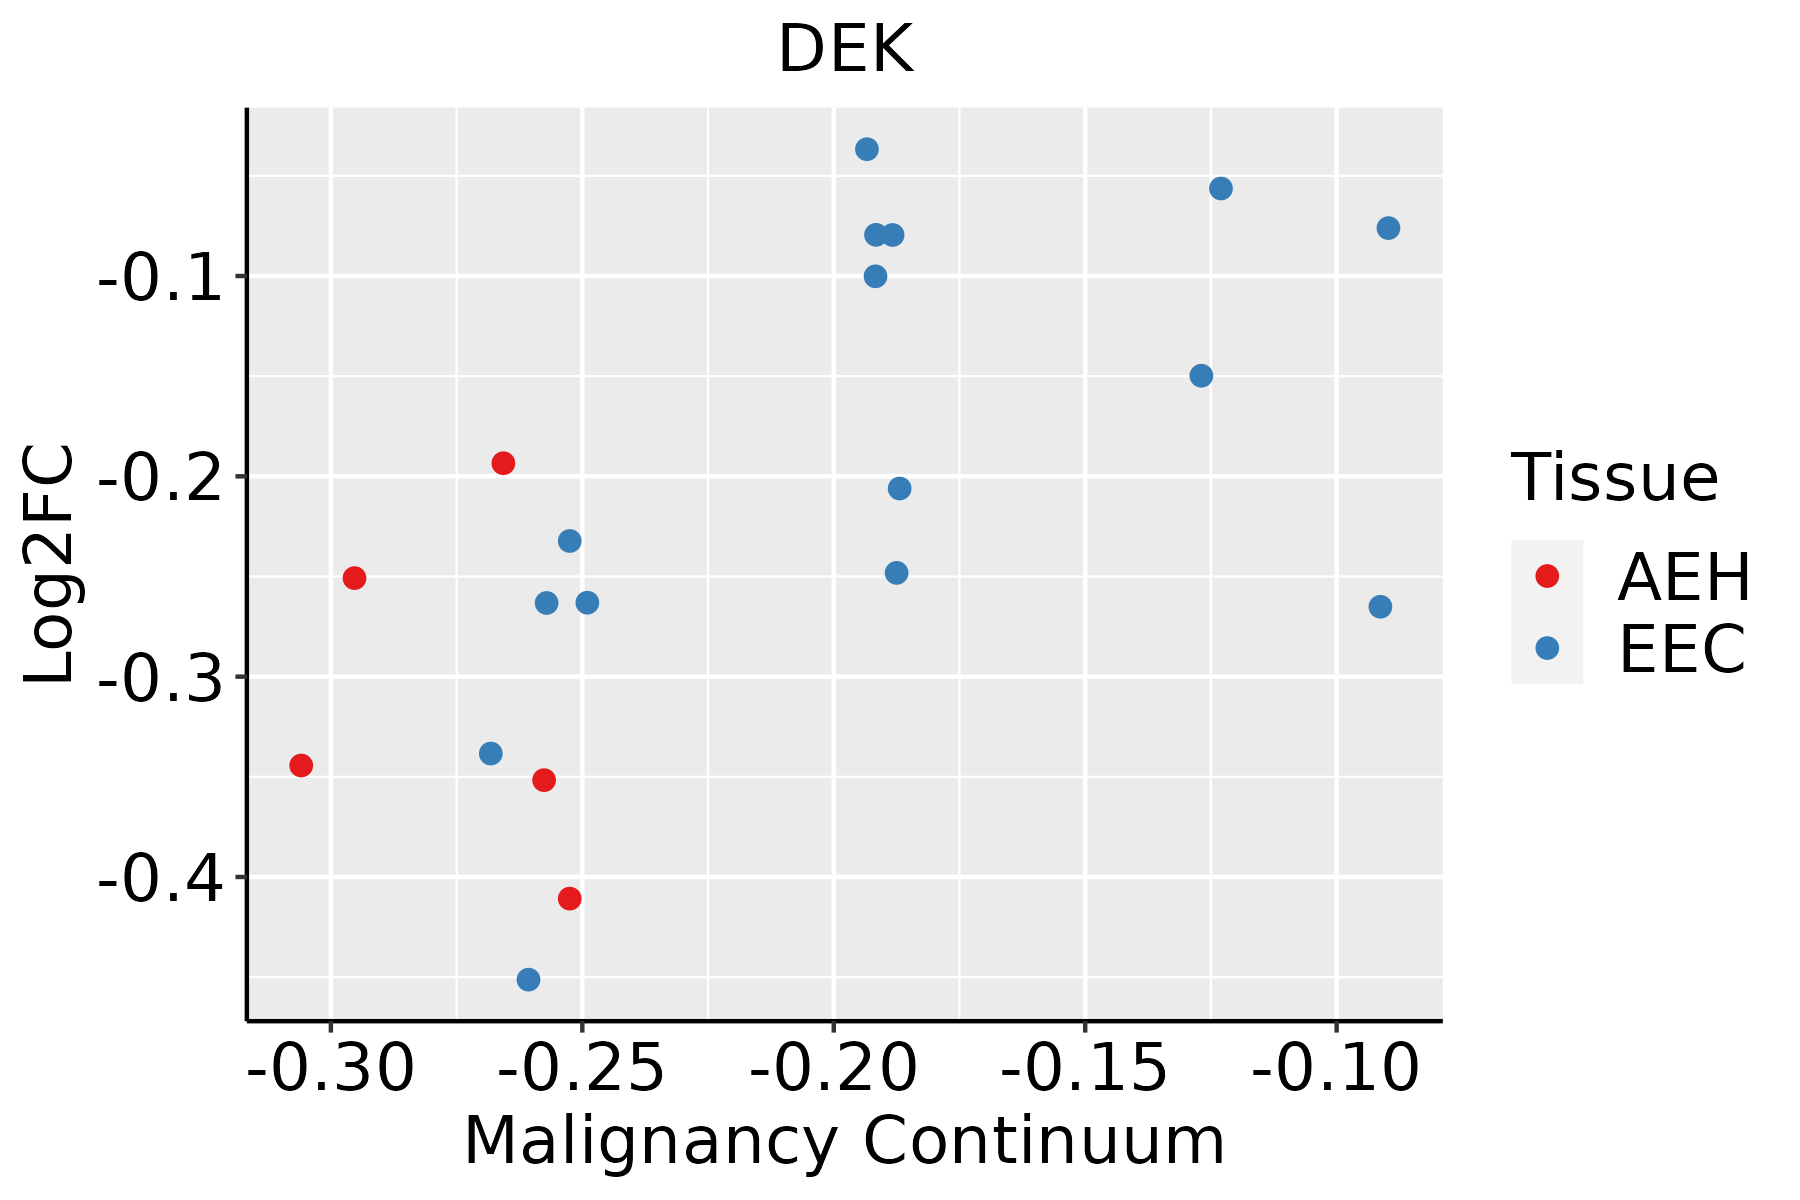 | AEH: Atypical endometrial hyperplasia |
| EEC: Endometrioid Cancer | ||
| Esophagus | 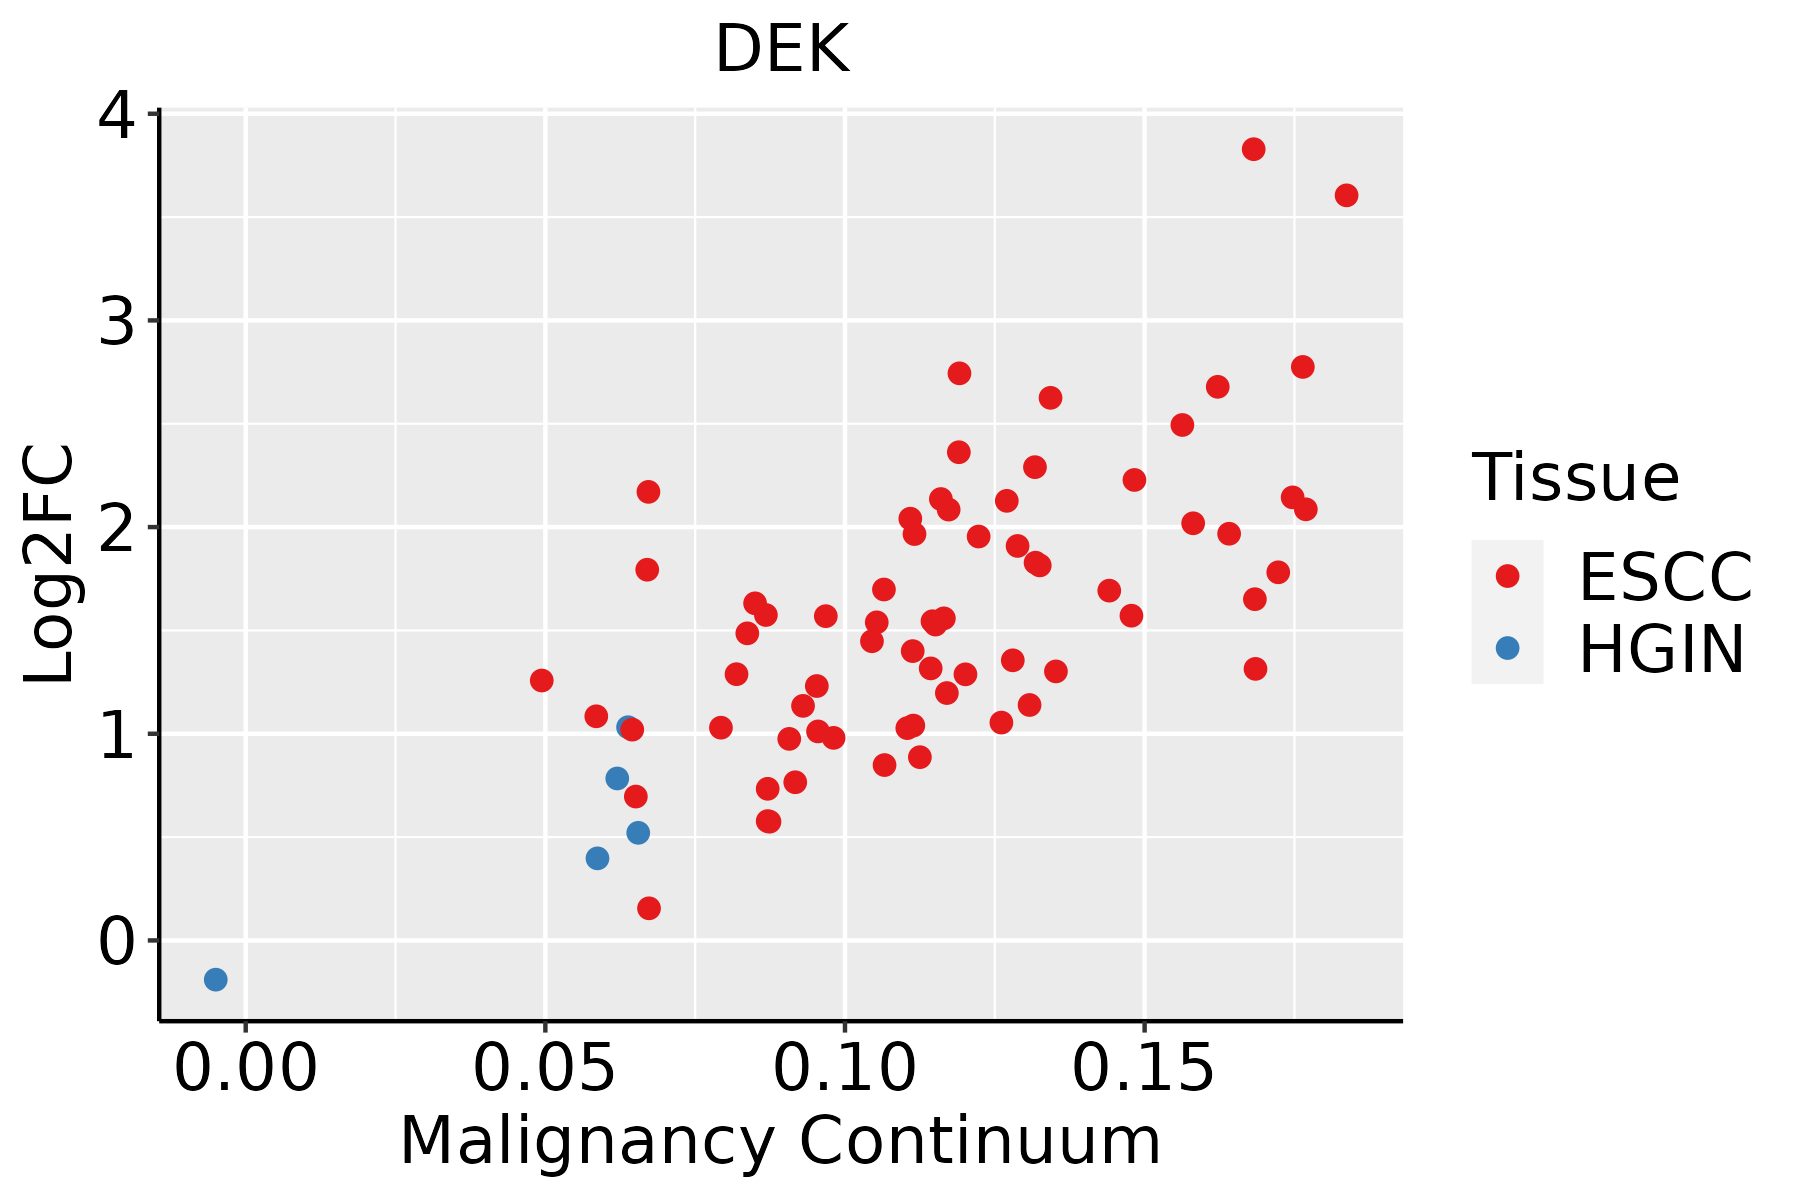 | ESCC: Esophageal squamous cell carcinoma |
| HGIN: High-grade intraepithelial neoplasias | ||
| LGIN: Low-grade intraepithelial neoplasias | ||
| Liver | 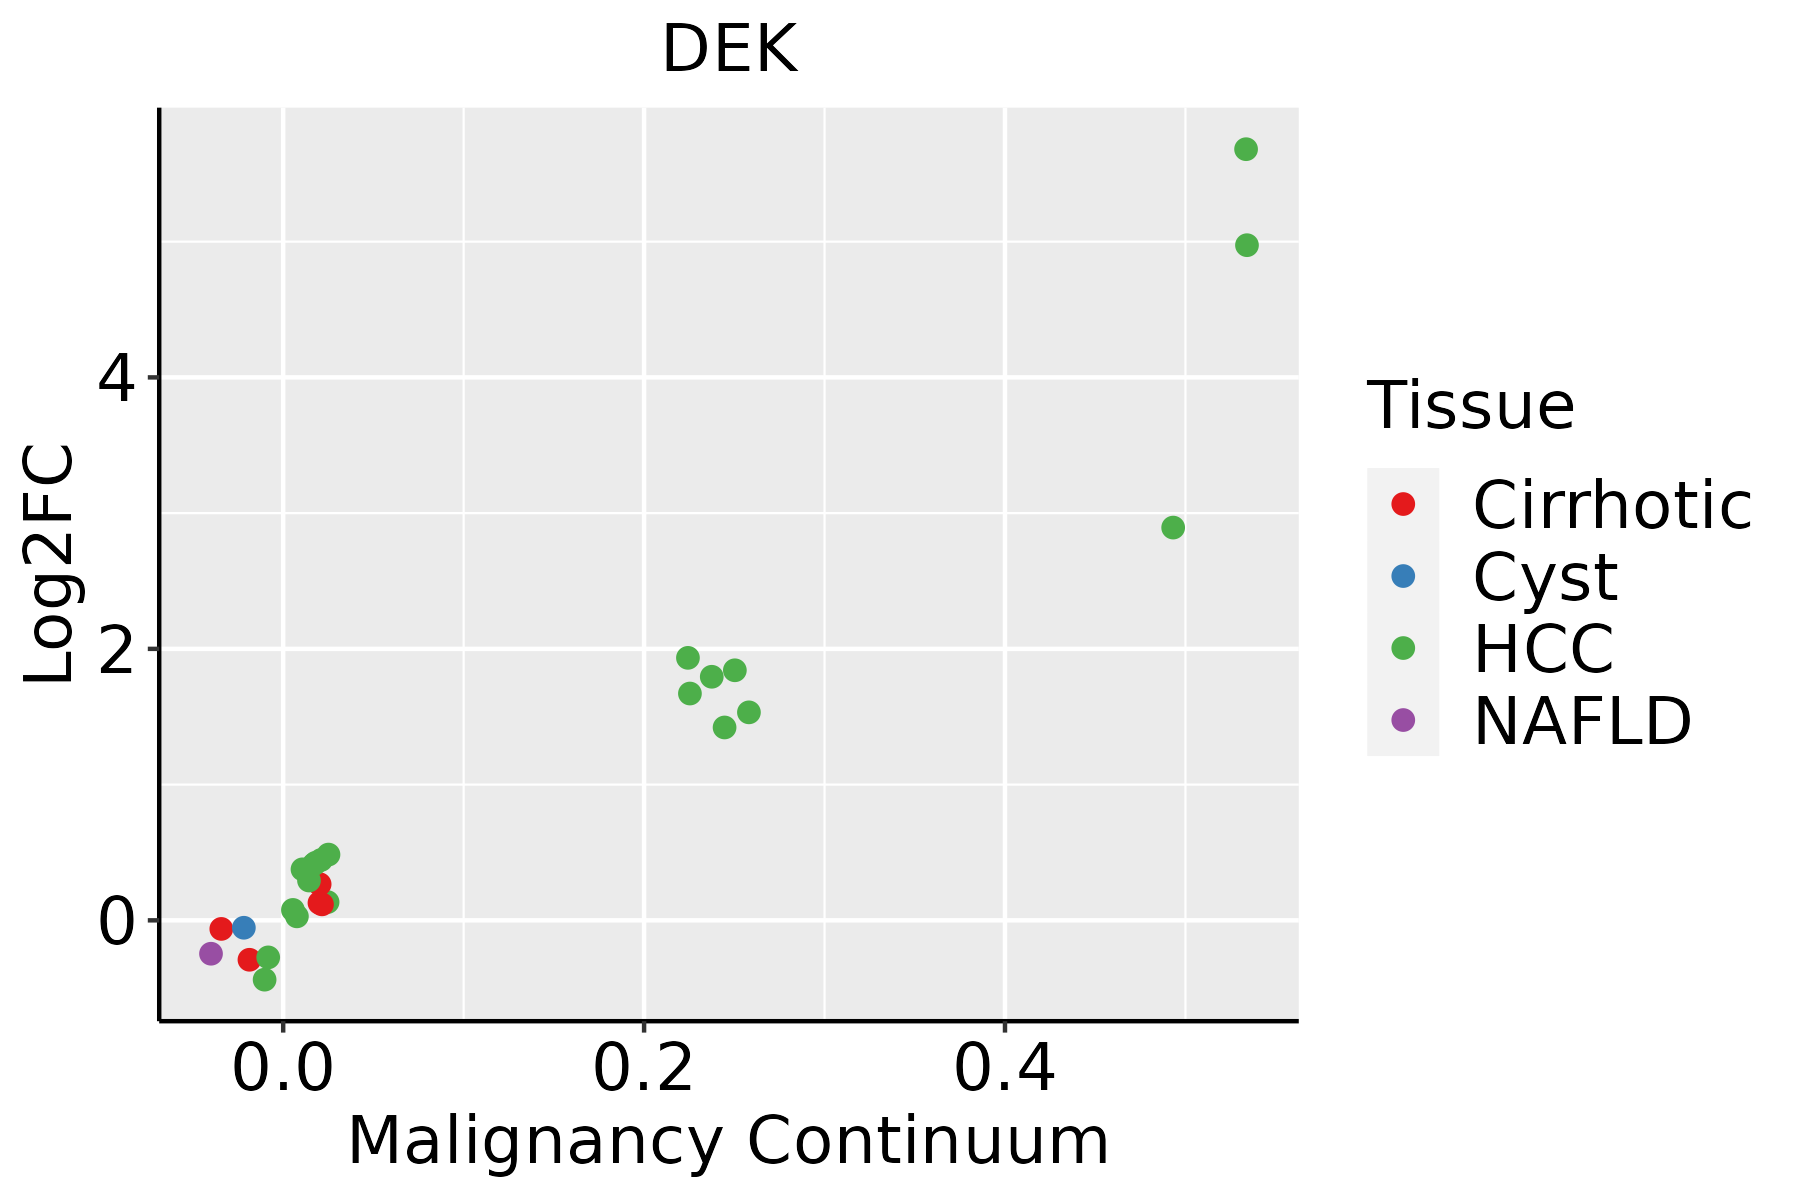 | HCC: Hepatocellular carcinoma |
| NAFLD: Non-alcoholic fatty liver disease | ||
| Oral Cavity | 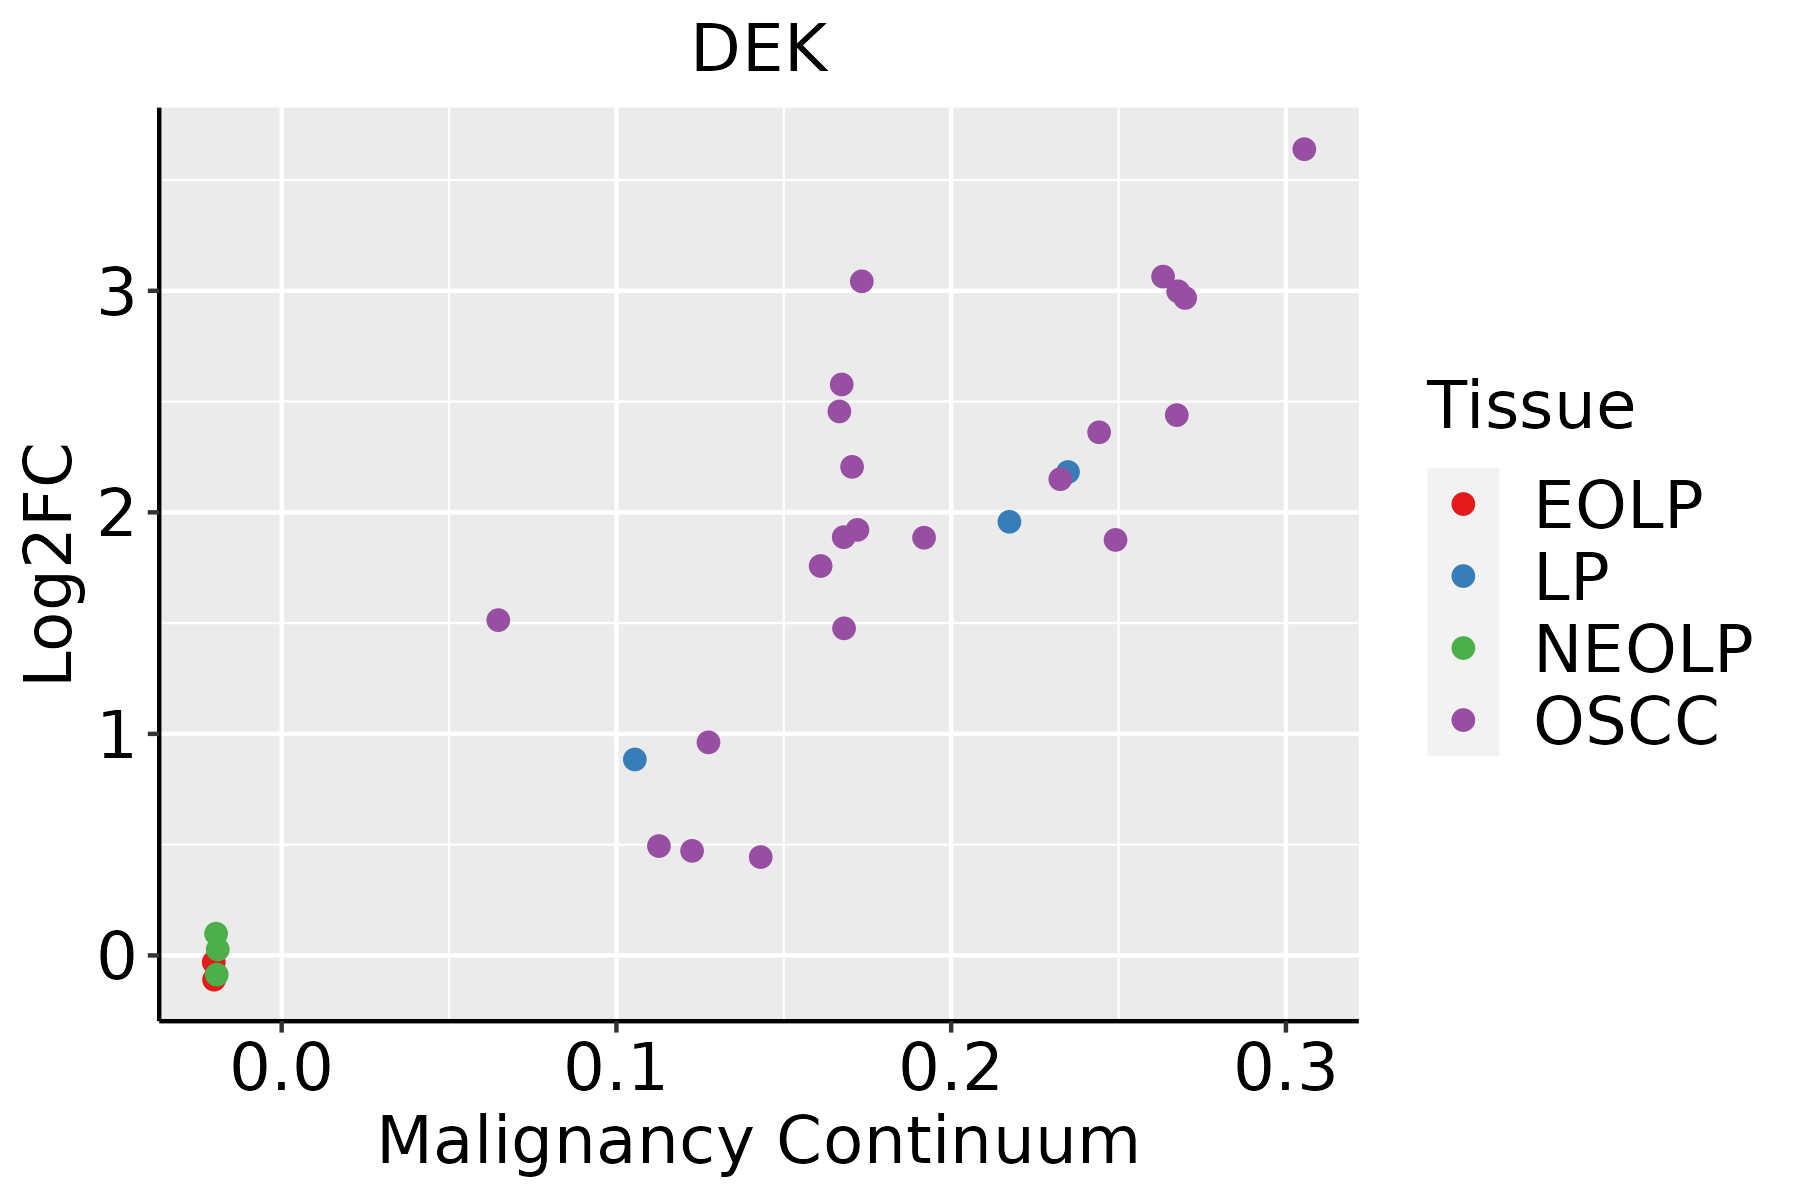 | EOLP: Erosive Oral lichen planus |
| LP: leukoplakia | ||
| NEOLP: Non-erosive oral lichen planus | ||
| OSCC: Oral squamous cell carcinoma | ||
| Prostate |  | BPH: Benign Prostatic Hyperplasia |
| Skin | 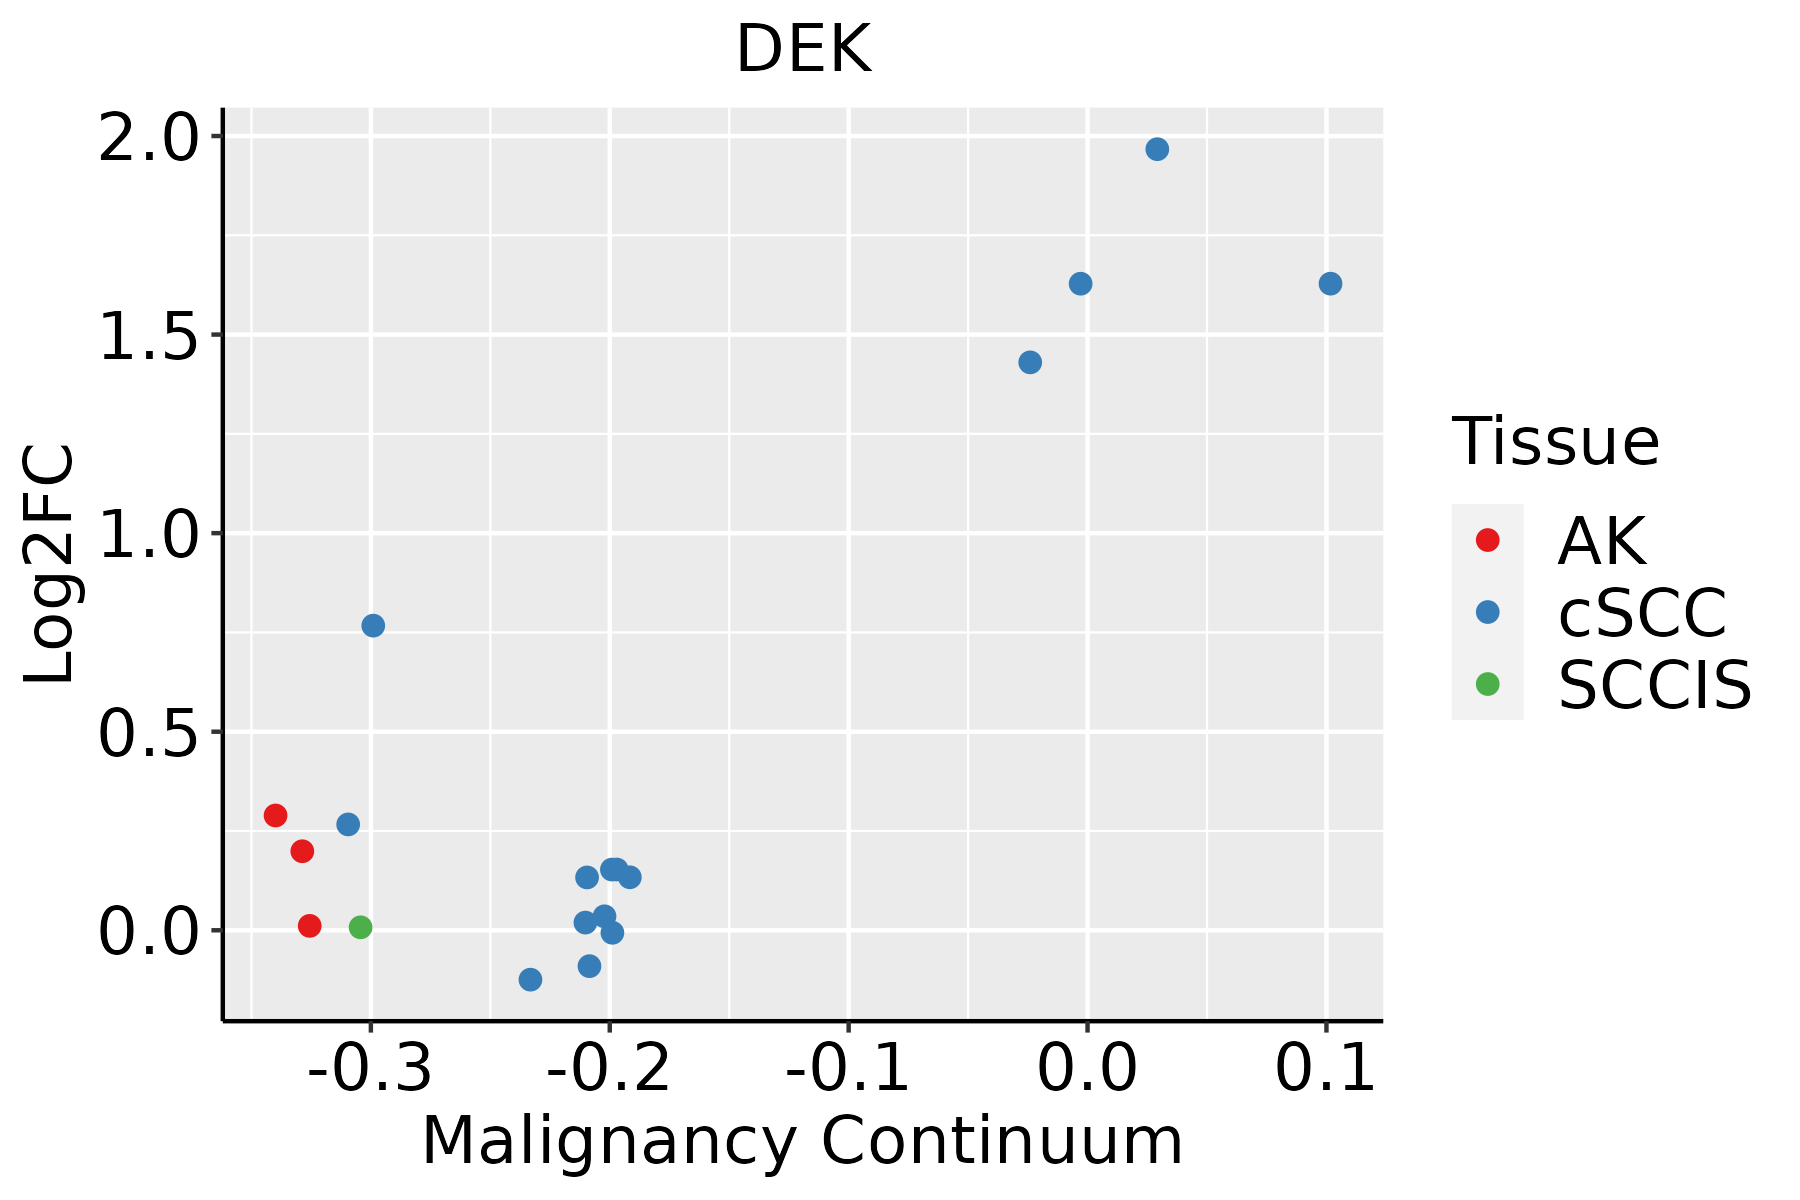 | AK: Actinic keratosis |
| cSCC: Cutaneous squamous cell carcinoma | ||
| SCCIS:squamous cell carcinoma in situ | ||
| Thyroid | 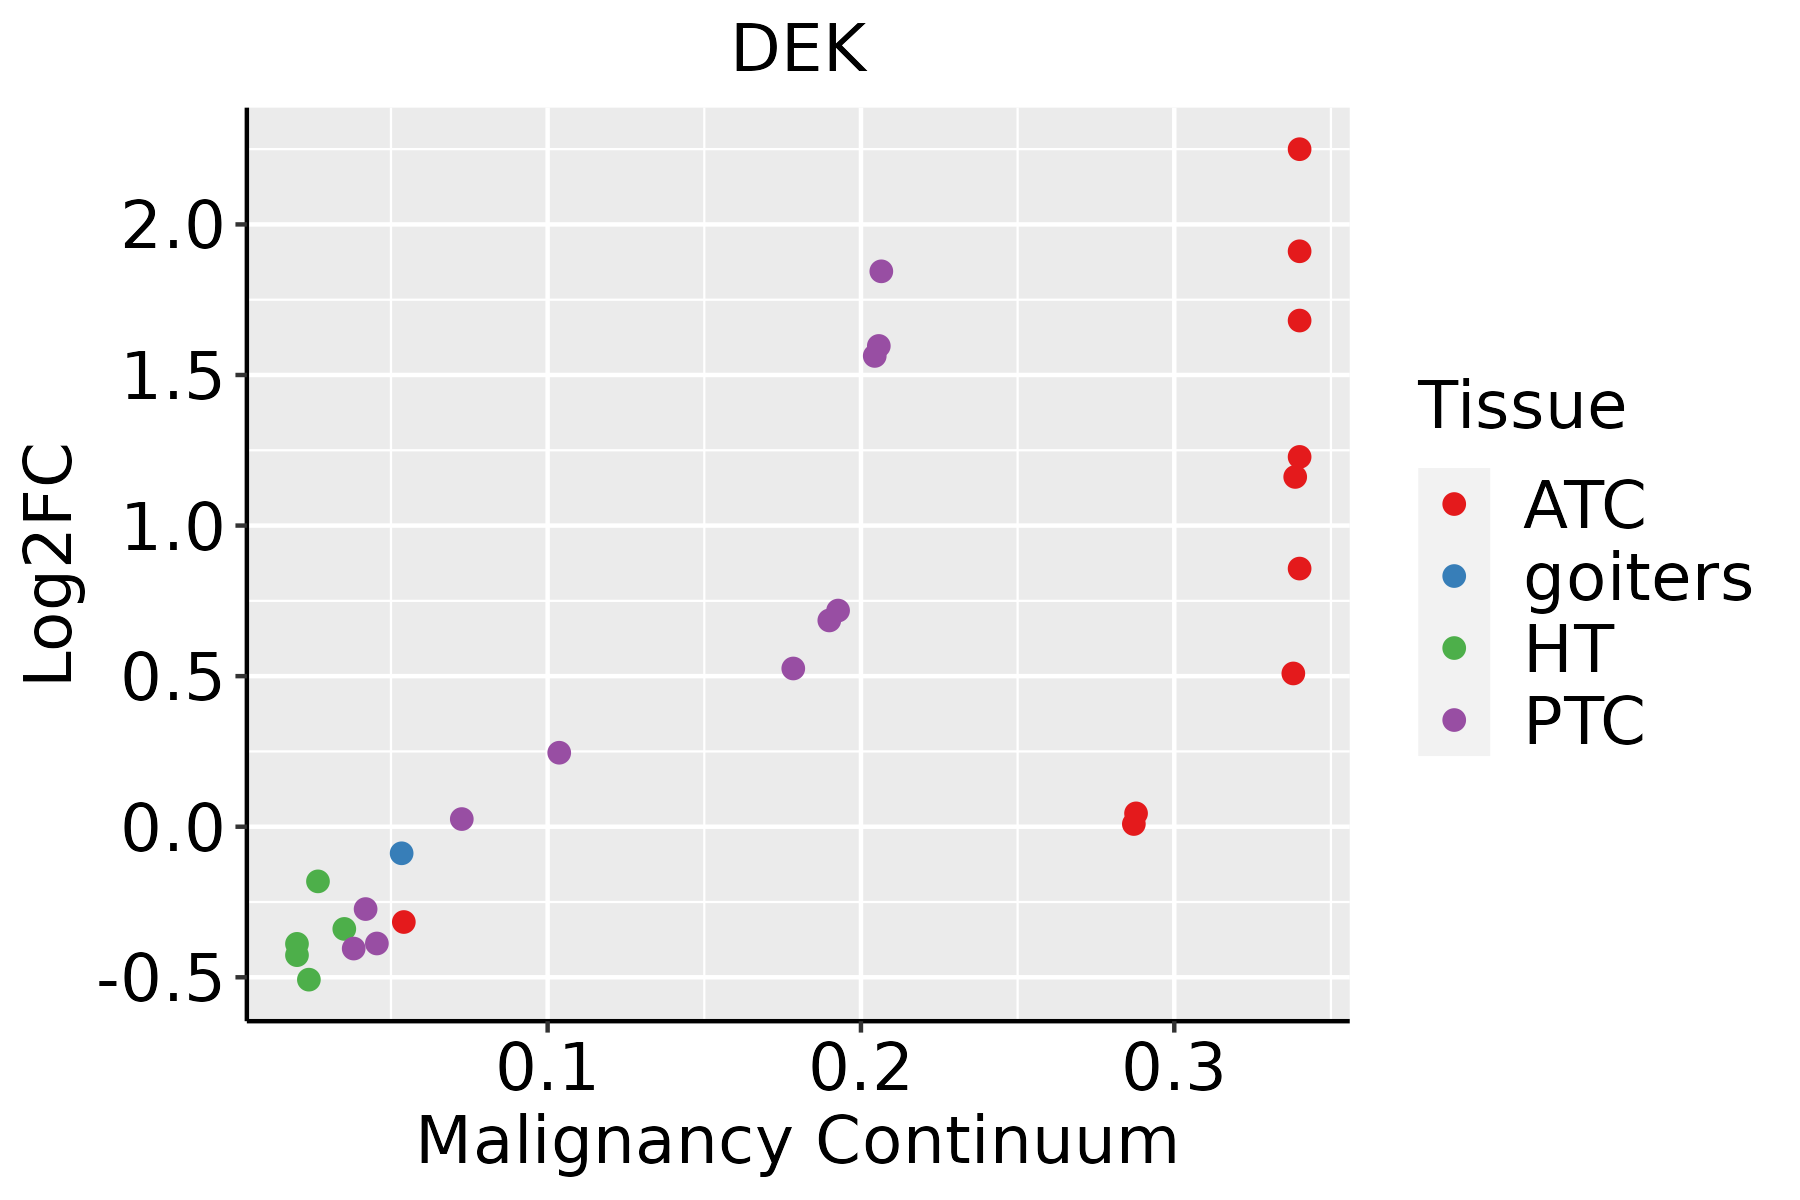 | ATC: Anaplastic thyroid cancer |
| HT: Hashimoto's thyroiditis | ||
| PTC: Papillary thyroid cancer |
| ∗log2FC in expression of this searched gene in stem-like cells from each diseased tissue sample relative to stem-like cells in normal samples in each tissue plotted against the malignancy continuum. Samples are colored based on if they are from different disease stage. |
Top |
Malignant transformation related pathway analysis |
| Find out the enriched GO biological processes and KEGG pathways involved in transition from healthy to precancer to cancer |
| Tissue | Disease Stage | Enriched GO biological Processes |
| Colorectum | AD |  |
| Colorectum | SER |  |
| Colorectum | MSS |  |
| Colorectum | MSI-H |  |
| Colorectum | FAP |  |
| ∗Top 15 enriched GO BP terms are showed in the bar plot of each disease state in each tissue. Each row represents a significant GO biological process which is colored according to the -log10(p.adjust). |
| Page: 1 2 3 4 5 6 7 8 9 |
| GO ID | Tissue | Disease Stage | Description | Gene Ratio | Bg Ratio | pvalue | p.adjust | Count |
| GO:00062828 | Thyroid | PTC | regulation of DNA repair | 65/5968 | 130/18723 | 1.25e-05 | 1.36e-04 | 65 |
| GO:20007794 | Thyroid | PTC | regulation of double-strand break repair | 42/5968 | 85/18723 | 5.59e-04 | 3.56e-03 | 42 |
| GO:00063026 | Thyroid | PTC | double-strand break repair | 103/5968 | 251/18723 | 1.30e-03 | 7.40e-03 | 103 |
| GO:2001032 | Thyroid | PTC | regulation of double-strand break repair via nonhomologous end joining | 17/5968 | 29/18723 | 2.65e-03 | 1.35e-02 | 17 |
| GO:00063032 | Thyroid | PTC | double-strand break repair via nonhomologous end joining | 32/5968 | 66/18723 | 3.55e-03 | 1.71e-02 | 32 |
| GO:001603234 | Thyroid | ATC | viral process | 241/6293 | 415/18723 | 5.50e-25 | 2.04e-22 | 241 |
| GO:001905835 | Thyroid | ATC | viral life cycle | 173/6293 | 317/18723 | 9.22e-15 | 5.50e-13 | 173 |
| GO:005105219 | Thyroid | ATC | regulation of DNA metabolic process | 183/6293 | 359/18723 | 5.97e-12 | 2.30e-10 | 183 |
| GO:200102026 | Thyroid | ATC | regulation of response to DNA damage stimulus | 121/6293 | 219/18723 | 3.22e-11 | 1.08e-09 | 121 |
| GO:001907929 | Thyroid | ATC | viral genome replication | 78/6293 | 131/18723 | 9.92e-10 | 2.55e-08 | 78 |
| GO:0006325110 | Thyroid | ATC | chromatin organization | 189/6293 | 409/18723 | 6.40e-08 | 1.13e-06 | 189 |
| GO:000628211 | Thyroid | ATC | regulation of DNA repair | 68/6293 | 130/18723 | 8.19e-06 | 8.27e-05 | 68 |
| GO:200077911 | Thyroid | ATC | regulation of double-strand break repair | 45/6293 | 85/18723 | 1.83e-04 | 1.24e-03 | 45 |
| GO:000630212 | Thyroid | ATC | double-strand break repair | 110/6293 | 251/18723 | 4.48e-04 | 2.65e-03 | 110 |
| GO:00063031 | Thyroid | ATC | double-strand break repair via nonhomologous end joining | 33/6293 | 66/18723 | 4.27e-03 | 1.80e-02 | 33 |
| GO:20010321 | Thyroid | ATC | regulation of double-strand break repair via nonhomologous end joining | 17/6293 | 29/18723 | 4.95e-03 | 2.03e-02 | 17 |
| Page: 1 2 3 4 5 6 7 8 |
| Pathway ID | Tissue | Disease Stage | Description | Gene Ratio | Bg Ratio | pvalue | p.adjust | qvalue | Count |
| Page: 1 |
Top |
Cell-cell communication analysis |
| Identification of potential cell-cell interactions between two cell types and their ligand-receptor pairs for different disease states |
| Ligand | Receptor | LRpair | Pathway | Tissue | Disease Stage |
| Page: 1 |
Top |
Single-cell gene regulatory network inference analysis |
| Find out the significant the regulons (TFs) and the target genes of each regulon across cell types for different disease states |
| TF | Cell Type | Tissue | Disease Stage | Target Gene | RSS | Regulon Activity |
| ∗The dot plots of a searched regulon are shown for all cell subpopulations in each disease state of each tissue based on the regulon specific score inferred using pySCENIC and by calculating the average expression. |
| Page: 1 |
Top |
Somatic mutation of malignant transformation related genes |
| Annotation of somatic variants for genes involved in malignant transformation |
| Hugo Symbol | Variant Class | Variant Classification | dbSNP RS | HGVSc | HGVSp | HGVSp Short | SWISSPROT | BIOTYPE | SIFT | PolyPhen | Tumor Sample Barcode | Tissue | Histology | Sex | Age | Stage | Therapy Types | Drugs | Outcome |
| DEK | SNV | Missense_Mutation | c.904G>A | p.Glu302Lys | p.E302K | P35659 | protein_coding | tolerated(0.26) | benign(0.112) | TCGA-D8-A1JA-01 | Breast | breast invasive carcinoma | Female | <65 | III/IV | Chemotherapy | adriamycin | PD | |
| DEK | SNV | Missense_Mutation | c.700N>A | p.Glu234Lys | p.E234K | P35659 | protein_coding | tolerated(0.08) | probably_damaging(0.98) | TCGA-D8-A27G-01 | Breast | breast invasive carcinoma | Female | >=65 | I/II | Unknown | Unknown | SD | |
| DEK | insertion | Nonsense_Mutation | novel | c.949_950insTTCTGCTTCTTTAAACTAACATAAACTAAGGATACATCAAT | p.Lys317IlefsTer5 | p.K317Ifs*5 | P35659 | protein_coding | TCGA-B6-A0IA-01 | Breast | breast invasive carcinoma | Female | <65 | I/II | Unknown | Unknown | SD | ||
| DEK | SNV | Missense_Mutation | c.904G>C | p.Glu302Gln | p.E302Q | P35659 | protein_coding | tolerated(0.16) | benign(0.249) | TCGA-C5-A1BM-01 | Cervix | cervical & endocervical cancer | Female | >=65 | I/II | Unknown | Unknown | SD | |
| DEK | SNV | Missense_Mutation | novel | c.1081N>A | p.Glu361Lys | p.E361K | P35659 | protein_coding | tolerated(0.29) | possibly_damaging(0.83) | TCGA-C5-A7CK-01 | Cervix | cervical & endocervical cancer | Female | <65 | I/II | Chemotherapy | cisplatin | SD |
| DEK | SNV | Missense_Mutation | c.476G>A | p.Ser159Asn | p.S159N | P35659 | protein_coding | tolerated(0.43) | benign(0) | TCGA-AA-A00N-01 | Colorectum | colon adenocarcinoma | Male | >=65 | I/II | Unknown | Unknown | PD | |
| DEK | SNV | Missense_Mutation | novel | c.524N>G | p.Leu175Arg | p.L175R | P35659 | protein_coding | deleterious(0) | probably_damaging(0.963) | TCGA-CA-6717-01 | Colorectum | colon adenocarcinoma | Male | <65 | I/II | Chemotherapy | oxaliplatin | CR |
| DEK | deletion | Frame_Shift_Del | novel | c.1113delN | p.Glu372SerfsTer2 | p.E372Sfs*2 | P35659 | protein_coding | TCGA-AA-3877-01 | Colorectum | colon adenocarcinoma | Female | >=65 | I/II | Unknown | Unknown | SD | ||
| DEK | deletion | Frame_Shift_Del | c.31delG | p.Glu11ArgfsTer53 | p.E11Rfs*53 | P35659 | protein_coding | TCGA-NH-A5IV-01 | Colorectum | colon adenocarcinoma | Female | >=65 | I/II | Unknown | Unknown | SD | |||
| DEK | deletion | Frame_Shift_Del | c.773delN | p.Lys258ArgfsTer20 | p.K258Rfs*20 | P35659 | protein_coding | TCGA-AG-A02N-01 | Colorectum | rectum adenocarcinoma | Male | >=65 | I/II | Chemotherapy | folinic | CR |
| Page: 1 2 3 4 5 |
Top |
Related drugs of malignant transformation related genes |
| Identification of chemicals and drugs interact with genes involved in malignant transfromation |
| (DGIdb 4.0) |
| Entrez ID | Symbol | Category | Interaction Types | Drug Claim Name | Drug Name | PMIDs |
| Page: 1 |

Copyright 2023-Present -The University of Texas Health Science Center at Houston |