
|
|||||
|
 | |
| |
| |
| |
| |
| |
|
Gene: CREB1 |
Gene summary for CREB1 |
| Gene information | Species | Human | Gene symbol | CREB1 | Gene ID | 1385 |
| Gene name | cAMP responsive element binding protein 1 | |
| Gene Alias | CREB | |
| Cytomap | 2q33.3 | |
| Gene Type | protein-coding | GO ID | GO:0000902 | UniProtAcc | B7Z5C6 |
Top |
Malignant transformation analysis |
| Identification of the aberrant gene expression in precancerous and cancerous lesions by comparing the gene expression of stem-like cells in diseased tissues with normal stem cells |
| Entrez ID | Symbol | Replicates | Species | Organ | Tissue | Adj P-value | Log2FC | Malignancy |
| 1385 | CREB1 | LZE4T | Human | Esophagus | ESCC | 2.89e-16 | 3.57e-01 | 0.0811 |
| 1385 | CREB1 | LZE7T | Human | Esophagus | ESCC | 1.53e-05 | 5.02e-01 | 0.0667 |
| 1385 | CREB1 | LZE20T | Human | Esophagus | ESCC | 4.43e-07 | 1.23e-01 | 0.0662 |
| 1385 | CREB1 | LZE21D1 | Human | Esophagus | HGIN | 4.85e-02 | 2.45e-01 | 0.0632 |
| 1385 | CREB1 | LZE24T | Human | Esophagus | ESCC | 4.07e-15 | 3.95e-01 | 0.0596 |
| 1385 | CREB1 | LZE21T | Human | Esophagus | ESCC | 8.01e-05 | 1.82e-01 | 0.0655 |
| 1385 | CREB1 | LZE6T | Human | Esophagus | ESCC | 3.95e-07 | 2.23e-01 | 0.0845 |
| 1385 | CREB1 | P1T-E | Human | Esophagus | ESCC | 1.61e-07 | 3.62e-01 | 0.0875 |
| 1385 | CREB1 | P2T-E | Human | Esophagus | ESCC | 1.04e-39 | 6.38e-01 | 0.1177 |
| 1385 | CREB1 | P4T-E | Human | Esophagus | ESCC | 4.50e-31 | 7.65e-01 | 0.1323 |
| 1385 | CREB1 | P5T-E | Human | Esophagus | ESCC | 8.82e-17 | 2.61e-01 | 0.1327 |
| 1385 | CREB1 | P8T-E | Human | Esophagus | ESCC | 6.18e-37 | 6.00e-01 | 0.0889 |
| 1385 | CREB1 | P9T-E | Human | Esophagus | ESCC | 2.99e-11 | 3.07e-01 | 0.1131 |
| 1385 | CREB1 | P10T-E | Human | Esophagus | ESCC | 1.67e-28 | 5.54e-01 | 0.116 |
| 1385 | CREB1 | P11T-E | Human | Esophagus | ESCC | 5.70e-09 | 4.79e-01 | 0.1426 |
| 1385 | CREB1 | P12T-E | Human | Esophagus | ESCC | 1.15e-44 | 8.80e-01 | 0.1122 |
| 1385 | CREB1 | P15T-E | Human | Esophagus | ESCC | 2.71e-38 | 7.90e-01 | 0.1149 |
| 1385 | CREB1 | P16T-E | Human | Esophagus | ESCC | 3.56e-32 | 5.78e-01 | 0.1153 |
| 1385 | CREB1 | P17T-E | Human | Esophagus | ESCC | 6.97e-04 | 3.92e-01 | 0.1278 |
| 1385 | CREB1 | P19T-E | Human | Esophagus | ESCC | 5.09e-09 | 2.88e-01 | 0.1662 |
| Page: 1 2 3 4 5 |
| Tissue | Expression Dynamics | Abbreviation |
| Esophagus | 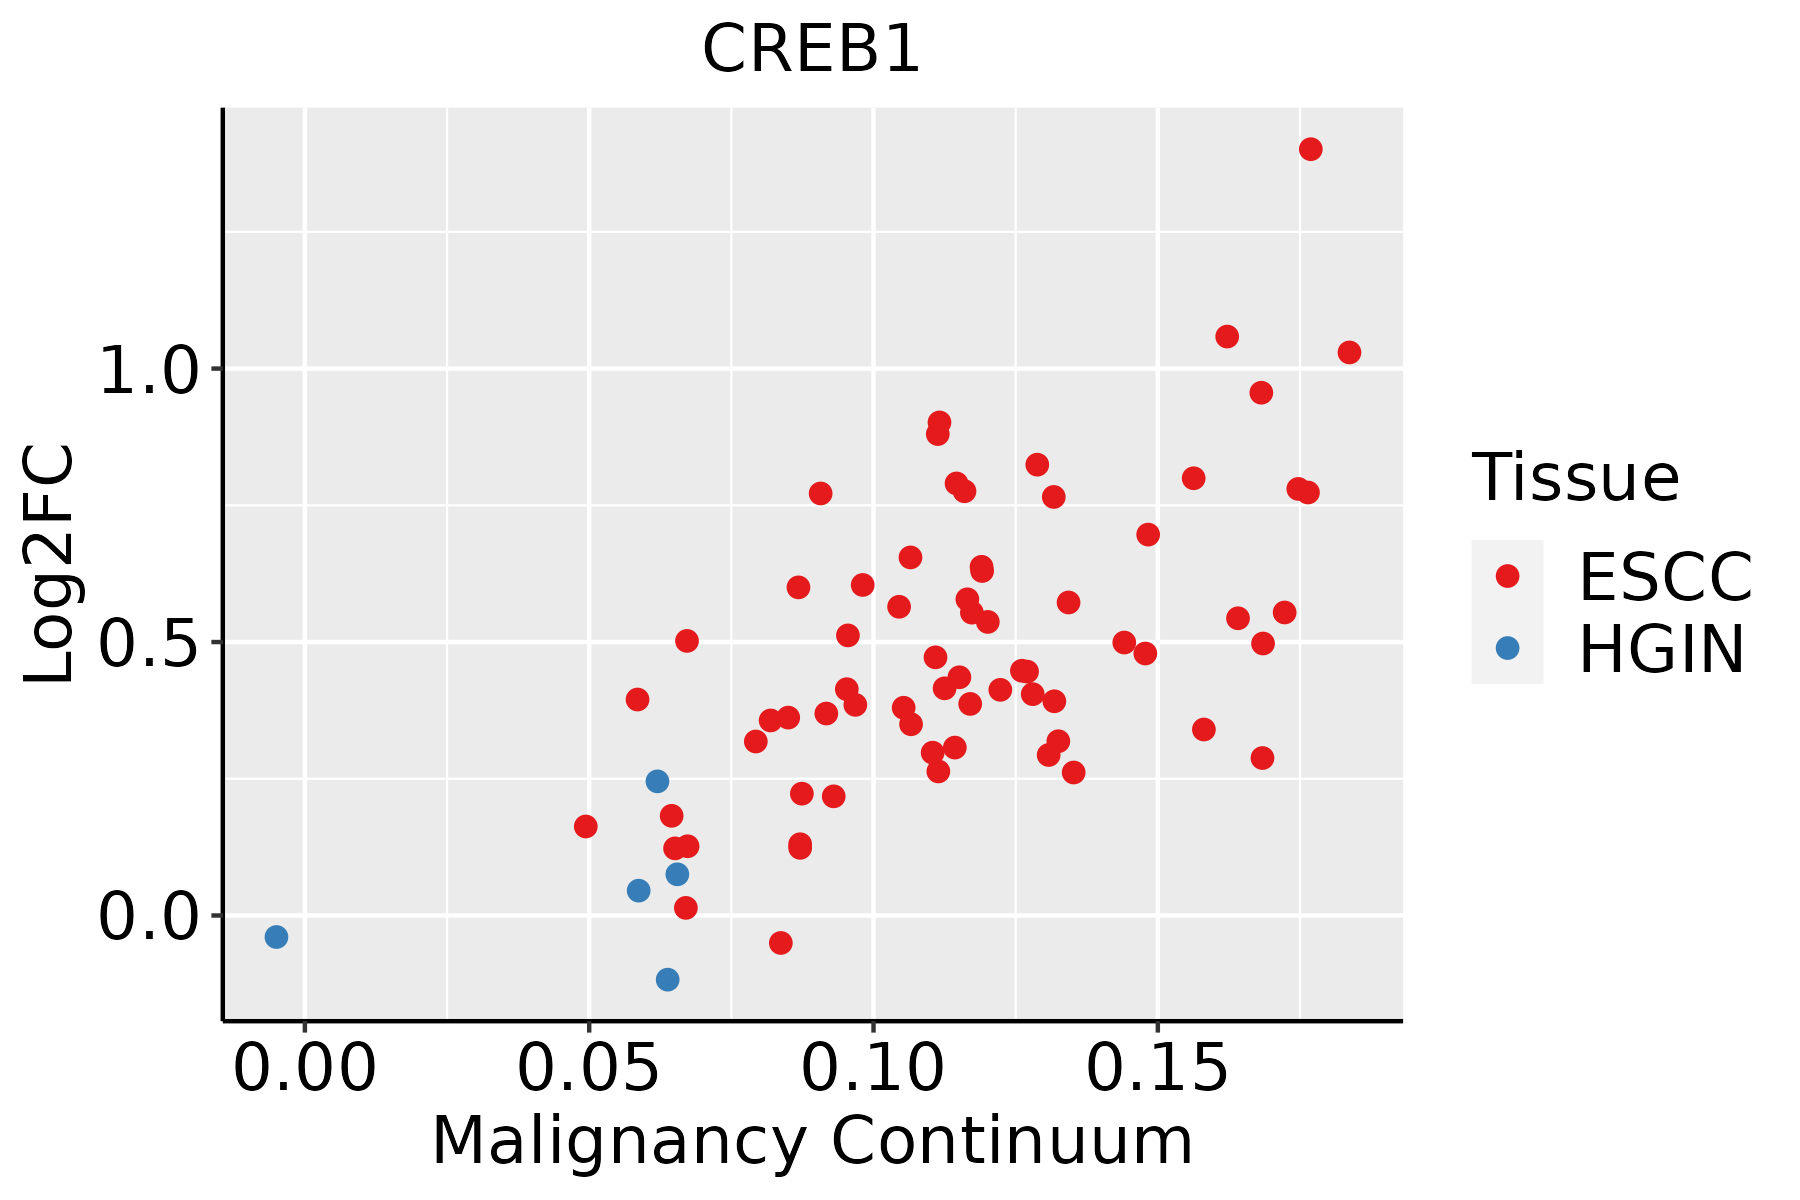 | ESCC: Esophageal squamous cell carcinoma |
| HGIN: High-grade intraepithelial neoplasias | ||
| LGIN: Low-grade intraepithelial neoplasias | ||
| Liver | 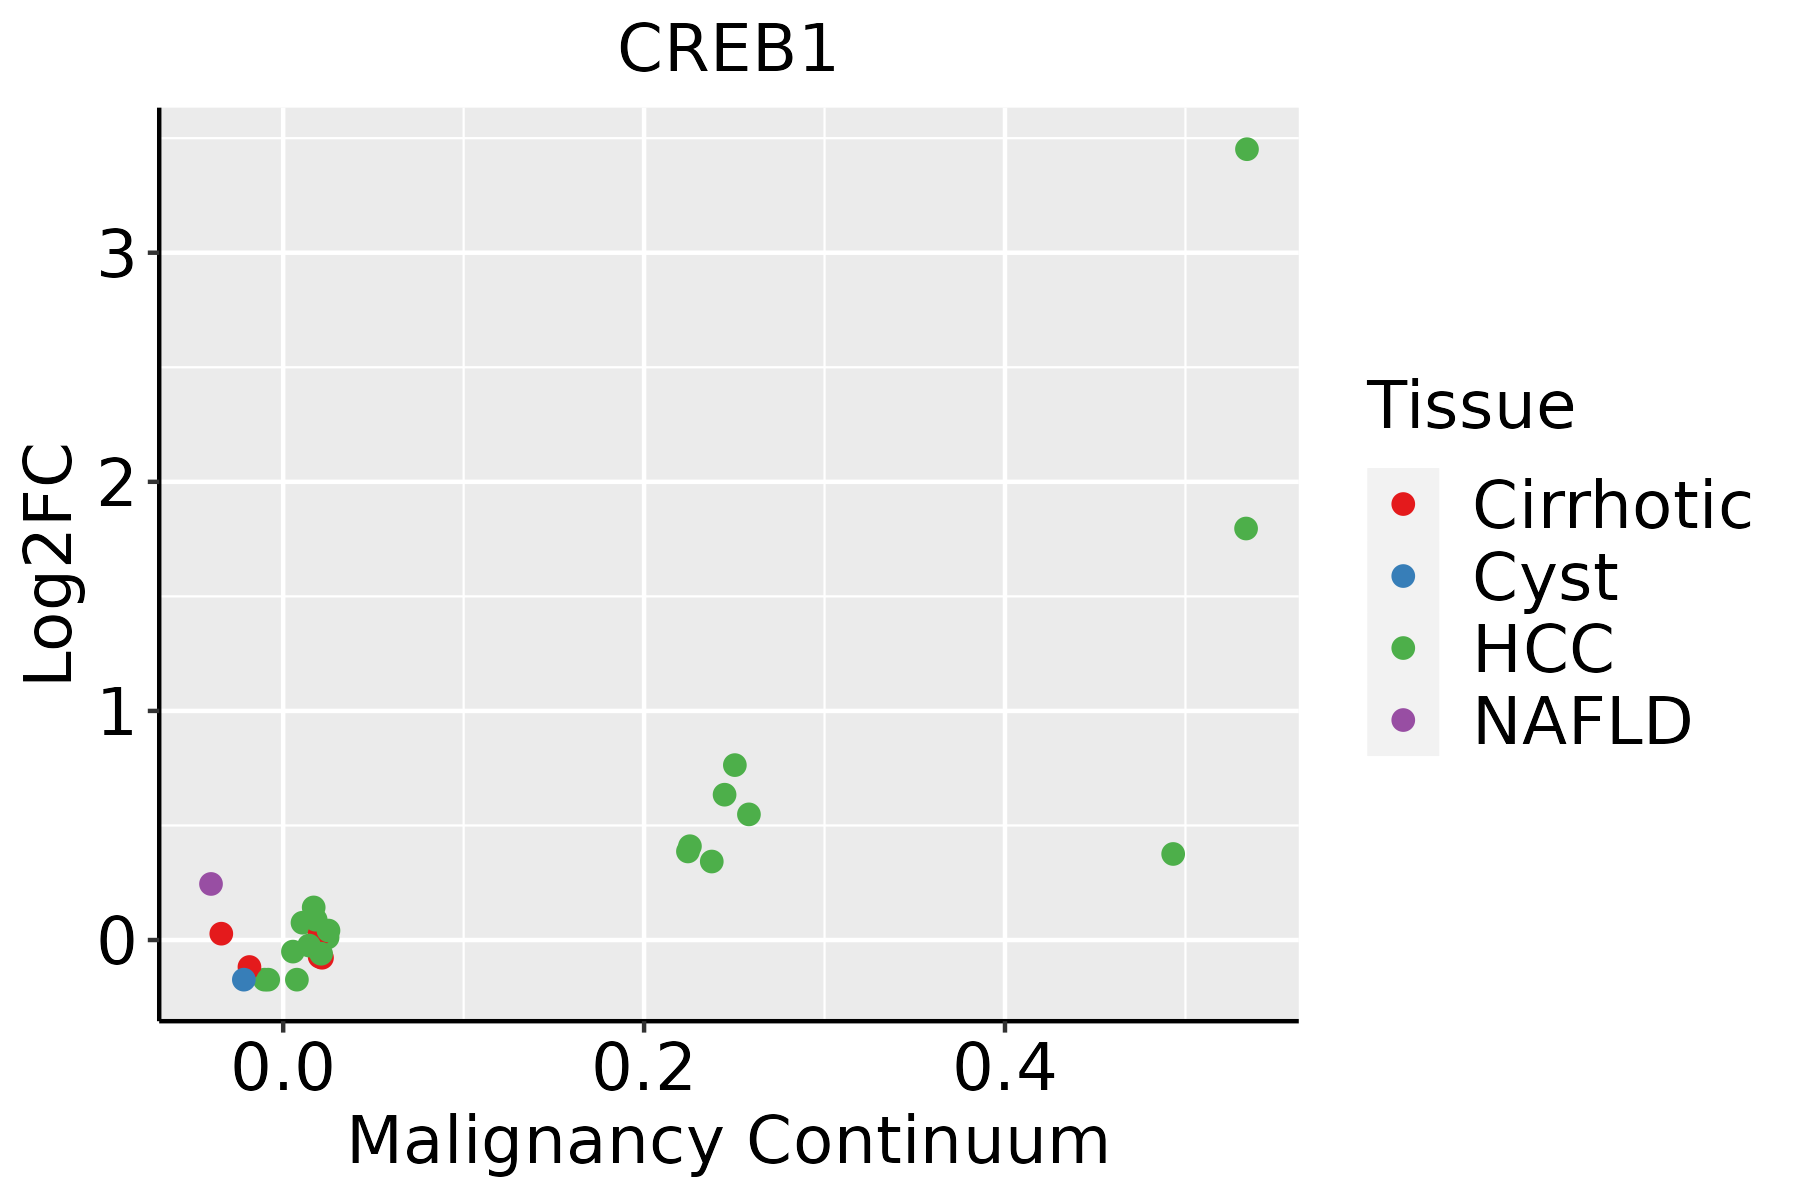 | HCC: Hepatocellular carcinoma |
| NAFLD: Non-alcoholic fatty liver disease | ||
| Oral Cavity | 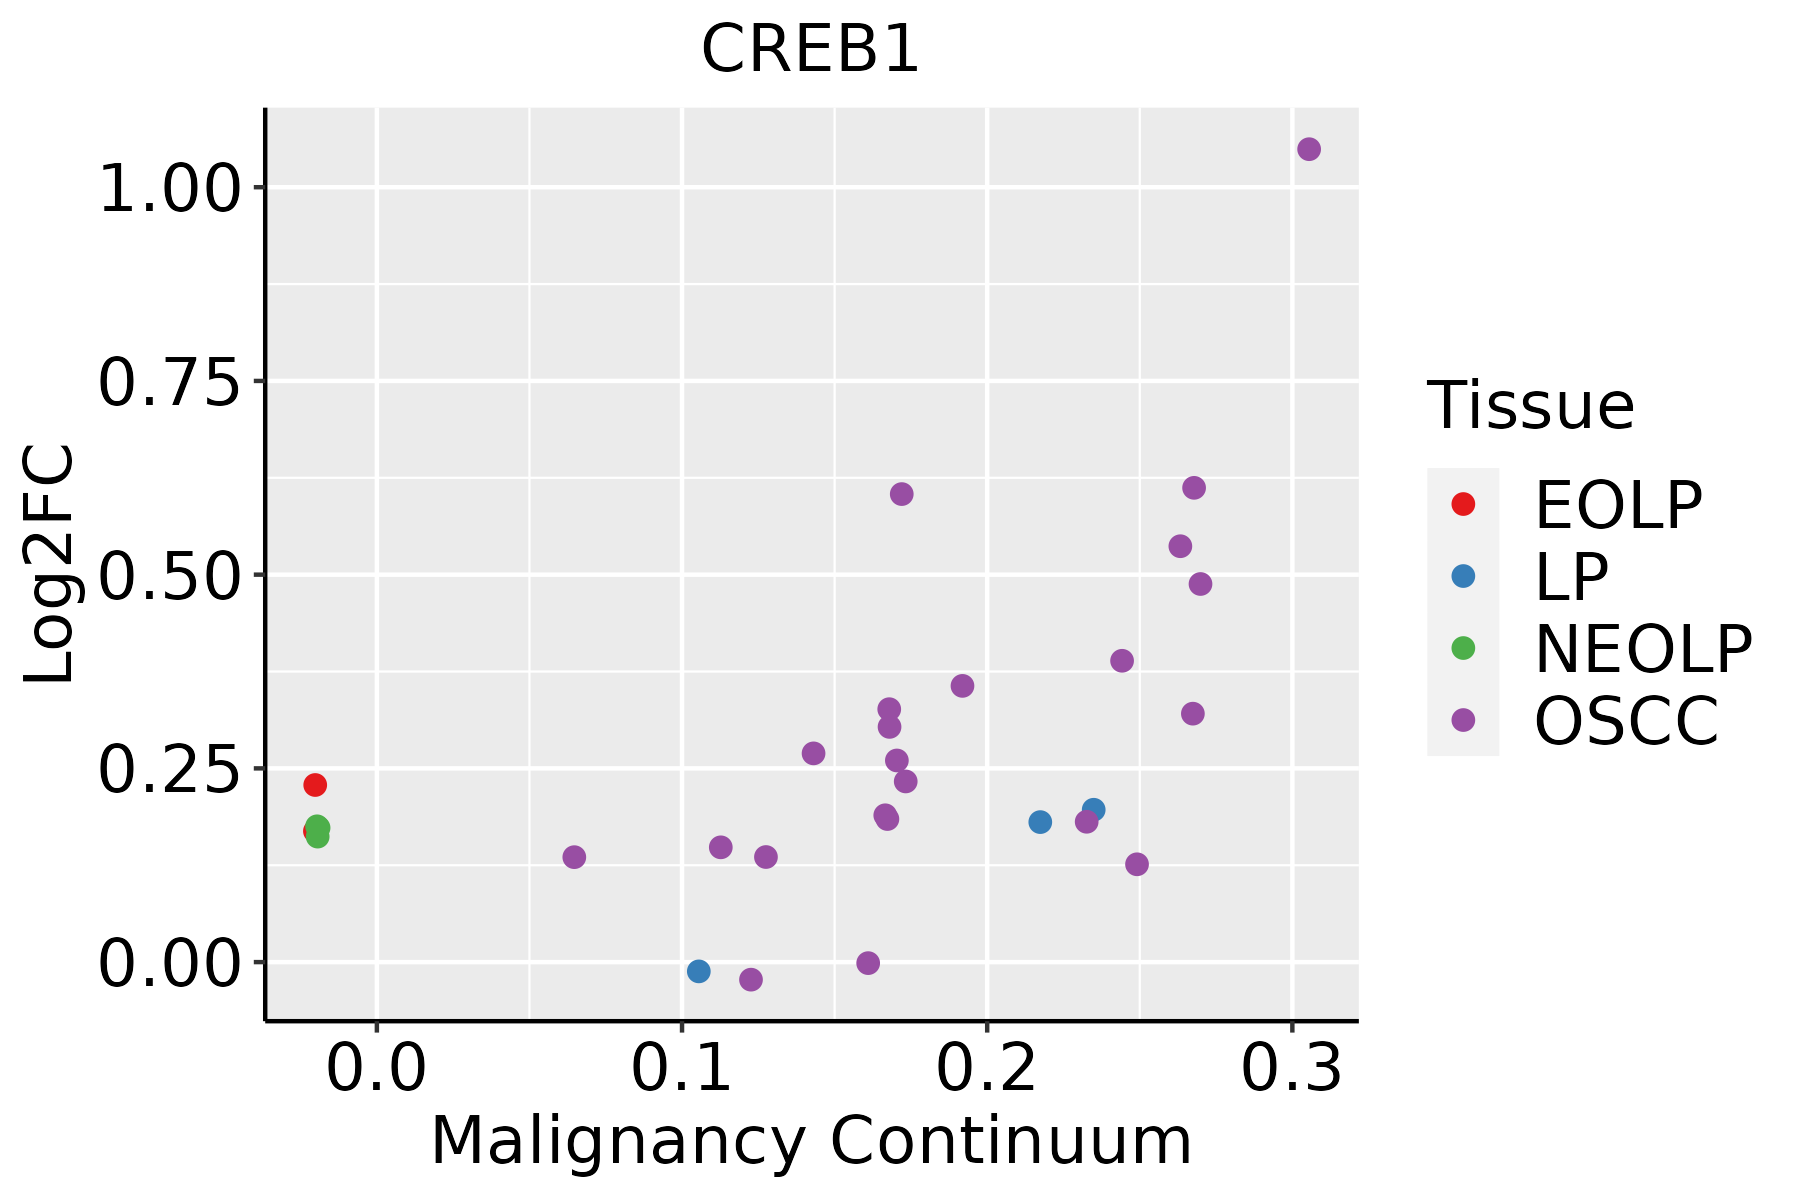 | EOLP: Erosive Oral lichen planus |
| LP: leukoplakia | ||
| NEOLP: Non-erosive oral lichen planus | ||
| OSCC: Oral squamous cell carcinoma | ||
| Skin | 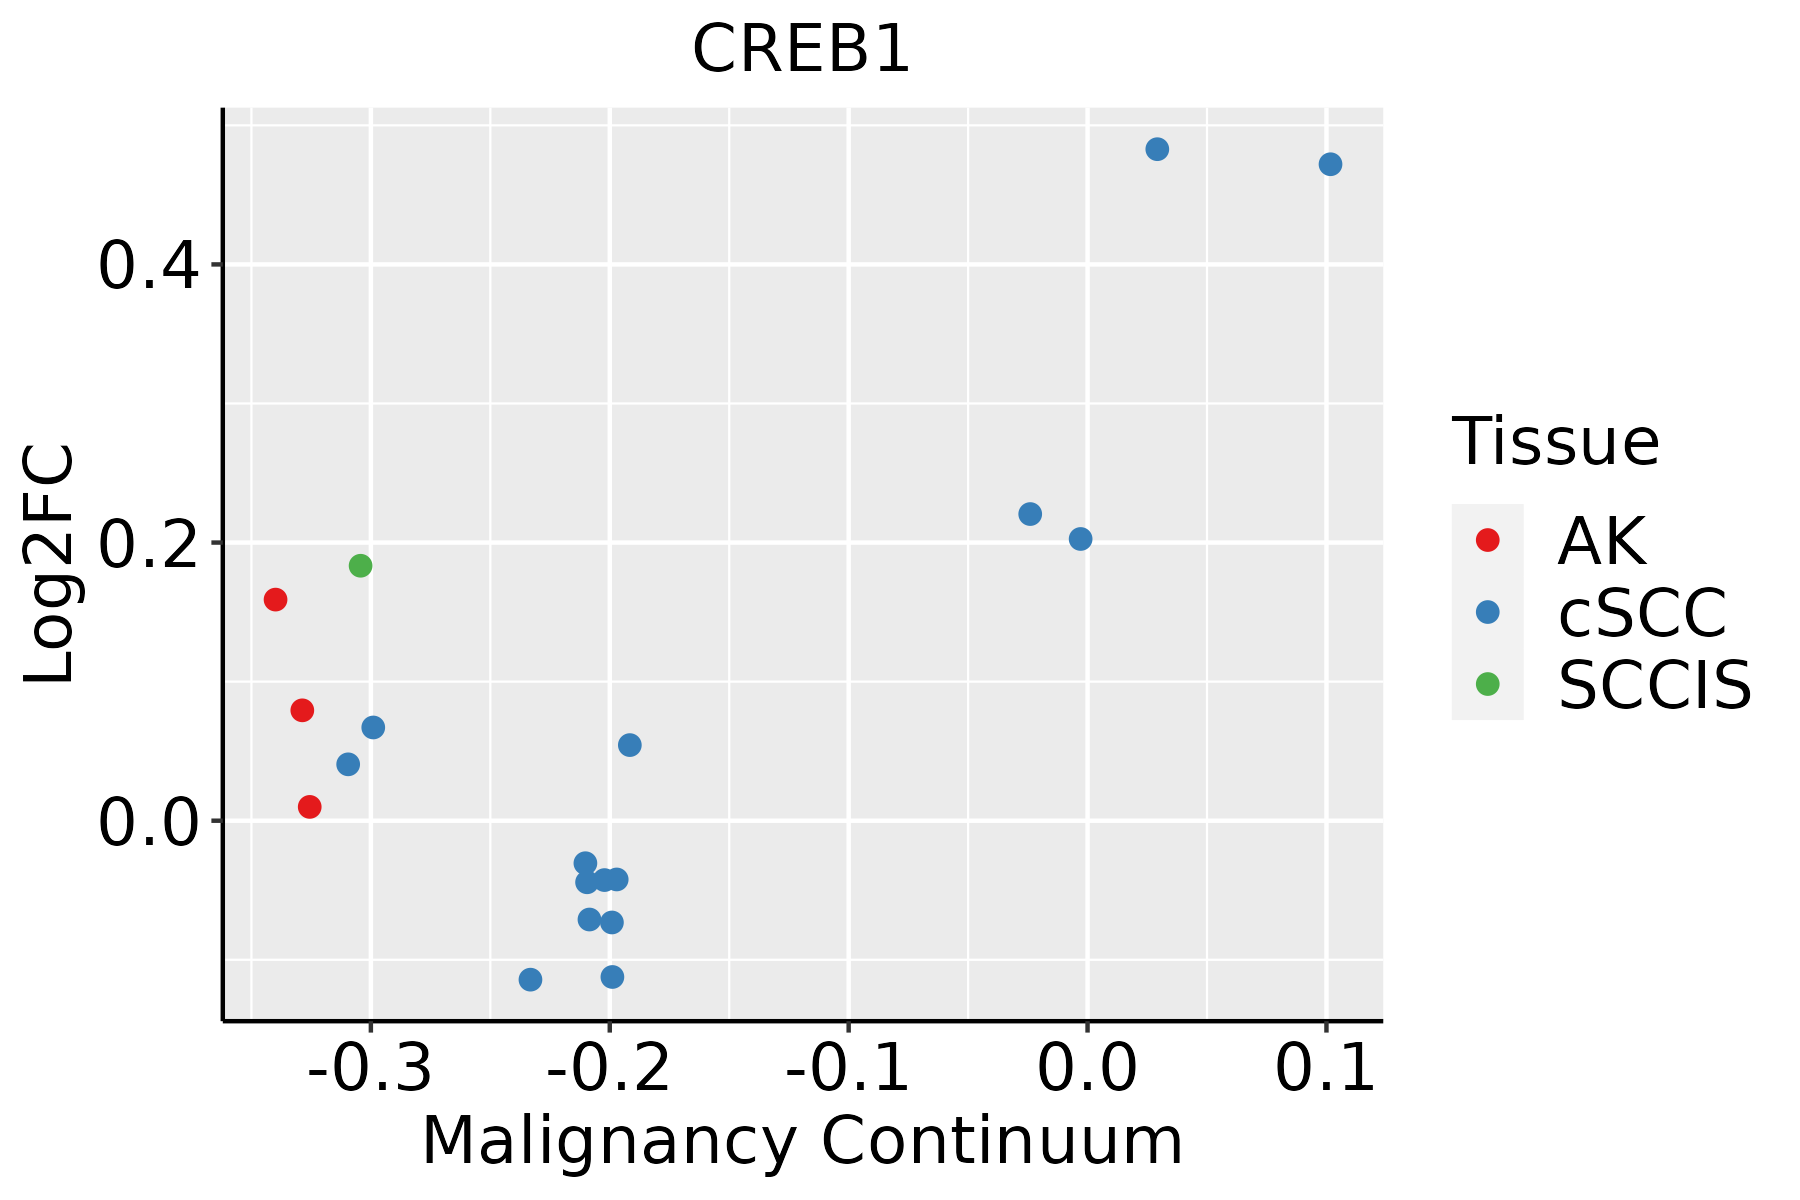 | AK: Actinic keratosis |
| cSCC: Cutaneous squamous cell carcinoma | ||
| SCCIS:squamous cell carcinoma in situ | ||
| Thyroid | 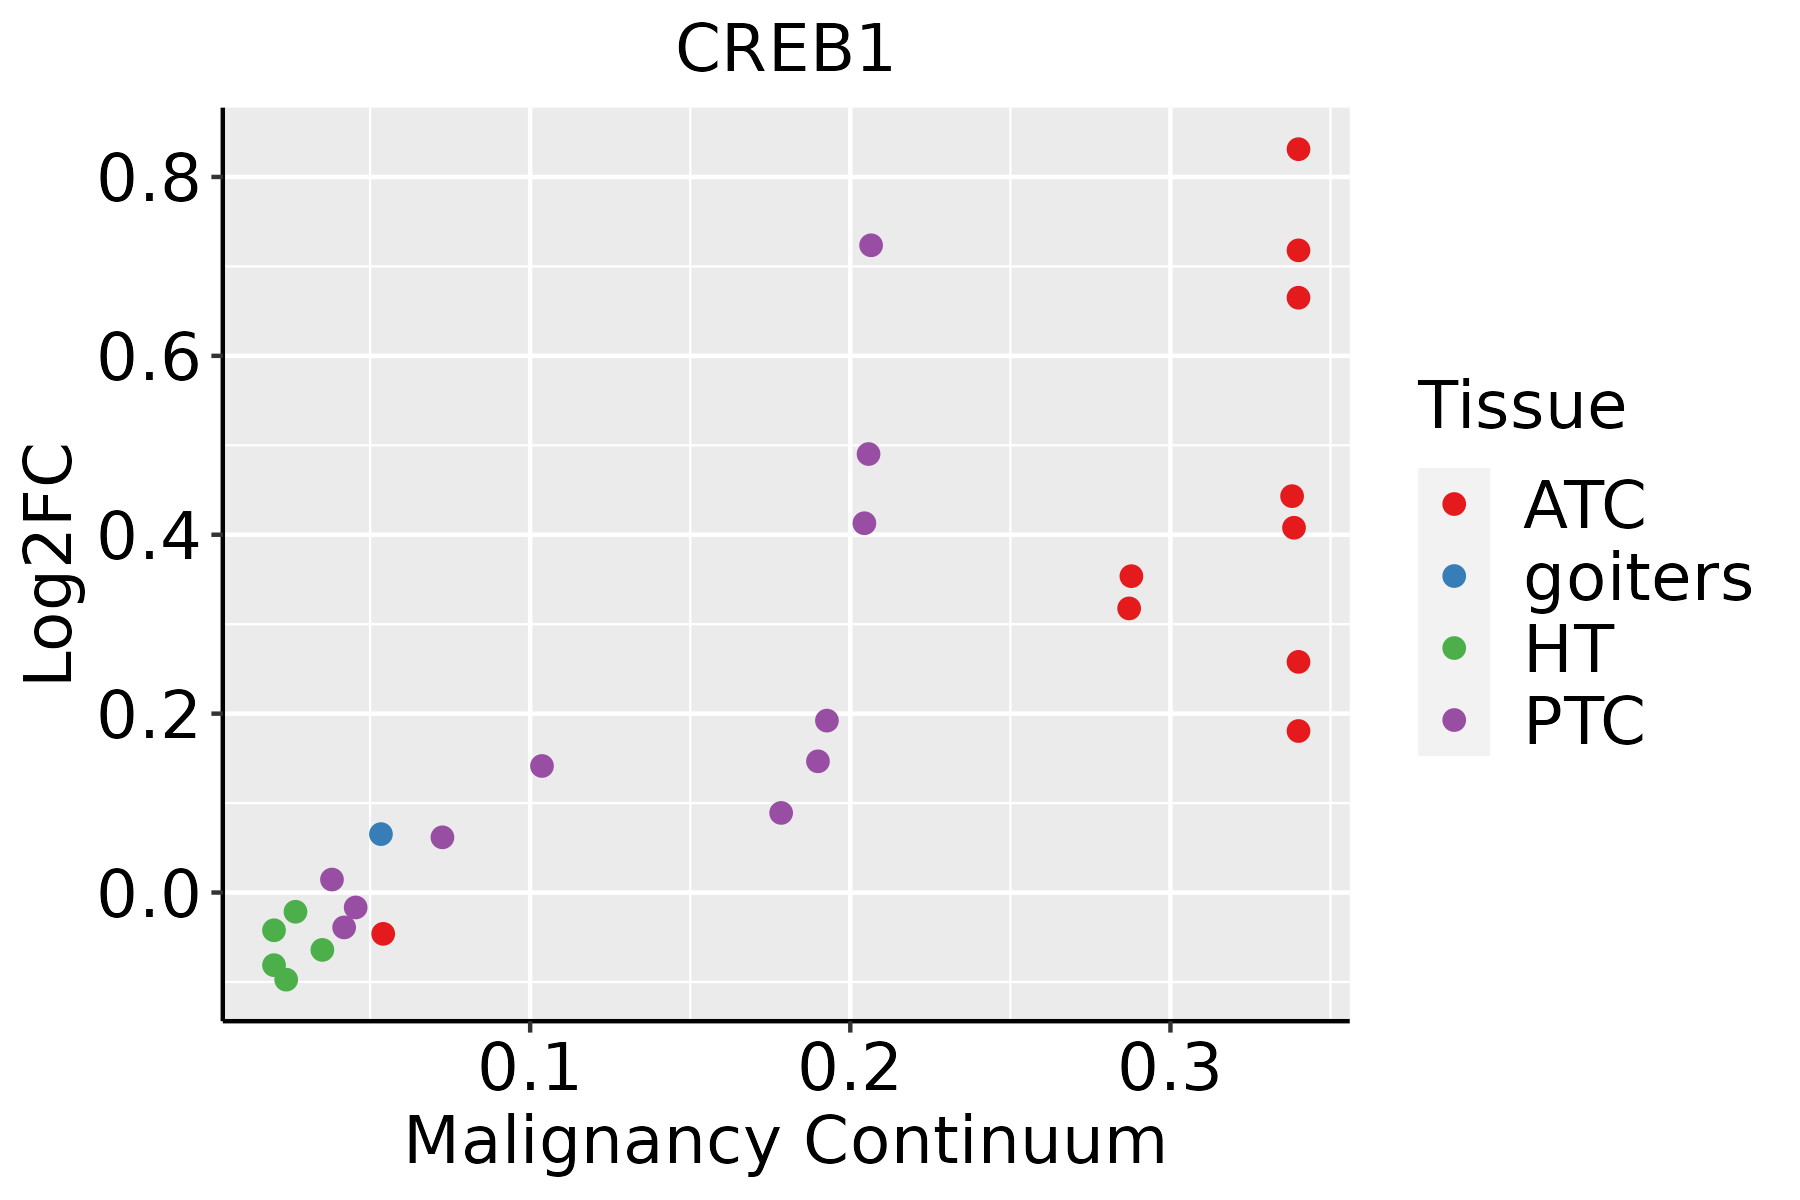 | ATC: Anaplastic thyroid cancer |
| HT: Hashimoto's thyroiditis | ||
| PTC: Papillary thyroid cancer |
| ∗log2FC in expression of this searched gene in stem-like cells from each diseased tissue sample relative to stem-like cells in normal samples in each tissue plotted against the malignancy continuum. Samples are colored based on if they are from different disease stage. |
Top |
Malignant transformation related pathway analysis |
| Find out the enriched GO biological processes and KEGG pathways involved in transition from healthy to precancer to cancer |
| Tissue | Disease Stage | Enriched GO biological Processes |
| Colorectum | AD |  |
| Colorectum | SER |  |
| Colorectum | MSS |  |
| Colorectum | MSI-H |  |
| Colorectum | FAP |  |
| ∗Top 15 enriched GO BP terms are showed in the bar plot of each disease state in each tissue. Each row represents a significant GO biological process which is colored according to the -log10(p.adjust). |
| Page: 1 2 3 4 5 6 7 8 9 |
| GO ID | Tissue | Disease Stage | Description | Gene Ratio | Bg Ratio | pvalue | p.adjust | Count |
| GO:003009922 | Liver | HCC | myeloid cell differentiation | 200/7958 | 381/18723 | 4.64e-05 | 4.49e-04 | 200 |
| GO:007156021 | Liver | HCC | cellular response to transforming growth factor beta stimulus | 137/7958 | 250/18723 | 5.47e-05 | 5.14e-04 | 137 |
| GO:000762321 | Liver | HCC | circadian rhythm | 117/7958 | 210/18723 | 7.29e-05 | 6.54e-04 | 117 |
| GO:000110111 | Liver | HCC | response to acid chemical | 79/7958 | 135/18723 | 1.24e-04 | 1.03e-03 | 79 |
| GO:199009021 | Liver | HCC | cellular response to nerve growth factor stimulus | 36/7958 | 53/18723 | 1.62e-04 | 1.29e-03 | 36 |
| GO:00468902 | Liver | HCC | regulation of lipid biosynthetic process | 96/7958 | 171/18723 | 2.14e-04 | 1.63e-03 | 96 |
| GO:199008921 | Liver | HCC | response to nerve growth factor | 37/7958 | 56/18723 | 3.13e-04 | 2.22e-03 | 37 |
| GO:004320011 | Liver | HCC | response to amino acid | 68/7958 | 116/18723 | 3.31e-04 | 2.33e-03 | 68 |
| GO:004851121 | Liver | HCC | rhythmic process | 156/7958 | 298/18723 | 3.54e-04 | 2.46e-03 | 156 |
| GO:190121512 | Liver | HCC | negative regulation of neuron death | 113/7958 | 208/18723 | 3.68e-04 | 2.54e-03 | 113 |
| GO:20001421 | Liver | HCC | regulation of DNA-templated transcription, initiation | 28/7958 | 40/18723 | 4.01e-04 | 2.71e-03 | 28 |
| GO:00602601 | Liver | HCC | regulation of transcription initiation from RNA polymerase II promoter | 24/7958 | 33/18723 | 4.24e-04 | 2.85e-03 | 24 |
| GO:0035729 | Liver | HCC | cellular response to hepatocyte growth factor stimulus | 14/7958 | 17/18723 | 9.39e-04 | 5.47e-03 | 14 |
| GO:00708971 | Liver | HCC | transcription preinitiation complex assembly | 25/7958 | 36/18723 | 9.87e-04 | 5.71e-03 | 25 |
| GO:005087822 | Liver | HCC | regulation of body fluid levels | 191/7958 | 379/18723 | 1.06e-03 | 6.11e-03 | 191 |
| GO:000717921 | Liver | HCC | transforming growth factor beta receptor signaling pathway | 106/7958 | 198/18723 | 1.09e-03 | 6.23e-03 | 106 |
| GO:007124112 | Liver | HCC | cellular response to inorganic substance | 119/7958 | 226/18723 | 1.26e-03 | 6.92e-03 | 119 |
| GO:0035728 | Liver | HCC | response to hepatocyte growth factor | 15/7958 | 19/18723 | 1.36e-03 | 7.28e-03 | 15 |
| GO:00454441 | Liver | HCC | fat cell differentiation | 120/7958 | 229/18723 | 1.52e-03 | 8.05e-03 | 120 |
| GO:00148231 | Liver | HCC | response to activity | 45/7958 | 76/18723 | 2.42e-03 | 1.18e-02 | 45 |
| Page: 1 2 3 4 5 6 7 8 9 10 11 12 13 14 15 16 17 18 19 20 21 22 23 |
| Pathway ID | Tissue | Disease Stage | Description | Gene Ratio | Bg Ratio | pvalue | p.adjust | qvalue | Count |
| hsa0501630 | Esophagus | HGIN | Huntington disease | 129/1383 | 306/8465 | 6.81e-28 | 7.41e-26 | 5.88e-26 | 129 |
| hsa0502030 | Esophagus | HGIN | Prion disease | 117/1383 | 273/8465 | 4.15e-26 | 3.38e-24 | 2.69e-24 | 117 |
| hsa0471439 | Esophagus | HGIN | Thermogenesis | 91/1383 | 232/8465 | 1.97e-17 | 5.36e-16 | 4.25e-16 | 91 |
| hsa0516730 | Esophagus | HGIN | Kaposi sarcoma-associated herpesvirus infection | 51/1383 | 194/8465 | 2.46e-04 | 2.69e-03 | 2.14e-03 | 51 |
| hsa052039 | Esophagus | HGIN | Viral carcinogenesis | 53/1383 | 204/8465 | 2.58e-04 | 2.71e-03 | 2.15e-03 | 53 |
| hsa0516639 | Esophagus | HGIN | Human T-cell leukemia virus 1 infection | 51/1383 | 222/8465 | 5.84e-03 | 4.05e-02 | 3.22e-02 | 51 |
| hsa0516330 | Esophagus | HGIN | Human cytomegalovirus infection | 51/1383 | 225/8465 | 7.67e-03 | 4.63e-02 | 3.68e-02 | 51 |
| hsa049627 | Esophagus | HGIN | Vasopressin-regulated water reabsorption | 14/1383 | 44/8465 | 8.21e-03 | 4.71e-02 | 3.74e-02 | 14 |
| hsa05016113 | Esophagus | HGIN | Huntington disease | 129/1383 | 306/8465 | 6.81e-28 | 7.41e-26 | 5.88e-26 | 129 |
| hsa05020113 | Esophagus | HGIN | Prion disease | 117/1383 | 273/8465 | 4.15e-26 | 3.38e-24 | 2.69e-24 | 117 |
| hsa04714114 | Esophagus | HGIN | Thermogenesis | 91/1383 | 232/8465 | 1.97e-17 | 5.36e-16 | 4.25e-16 | 91 |
| hsa05167114 | Esophagus | HGIN | Kaposi sarcoma-associated herpesvirus infection | 51/1383 | 194/8465 | 2.46e-04 | 2.69e-03 | 2.14e-03 | 51 |
| hsa0520315 | Esophagus | HGIN | Viral carcinogenesis | 53/1383 | 204/8465 | 2.58e-04 | 2.71e-03 | 2.15e-03 | 53 |
| hsa05166114 | Esophagus | HGIN | Human T-cell leukemia virus 1 infection | 51/1383 | 222/8465 | 5.84e-03 | 4.05e-02 | 3.22e-02 | 51 |
| hsa05163113 | Esophagus | HGIN | Human cytomegalovirus infection | 51/1383 | 225/8465 | 7.67e-03 | 4.63e-02 | 3.68e-02 | 51 |
| hsa0496214 | Esophagus | HGIN | Vasopressin-regulated water reabsorption | 14/1383 | 44/8465 | 8.21e-03 | 4.71e-02 | 3.74e-02 | 14 |
| hsa05016210 | Esophagus | ESCC | Huntington disease | 226/4205 | 306/8465 | 1.38e-18 | 8.72e-17 | 4.46e-17 | 226 |
| hsa05166211 | Esophagus | ESCC | Human T-cell leukemia virus 1 infection | 164/4205 | 222/8465 | 8.13e-14 | 2.09e-12 | 1.07e-12 | 164 |
| hsa05020210 | Esophagus | ESCC | Prion disease | 193/4205 | 273/8465 | 6.42e-13 | 1.34e-11 | 6.89e-12 | 193 |
| hsa04714211 | Esophagus | ESCC | Thermogenesis | 163/4205 | 232/8465 | 9.22e-11 | 1.14e-09 | 5.86e-10 | 163 |
| Page: 1 2 3 4 5 6 7 |
Top |
Cell-cell communication analysis |
| Identification of potential cell-cell interactions between two cell types and their ligand-receptor pairs for different disease states |
| Ligand | Receptor | LRpair | Pathway | Tissue | Disease Stage |
| Page: 1 |
Top |
Single-cell gene regulatory network inference analysis |
| Find out the significant the regulons (TFs) and the target genes of each regulon across cell types for different disease states |
| TF | Cell Type | Tissue | Disease Stage | Target Gene | RSS | Regulon Activity |
| CREB1 | TRANS | Cervix | ADJ | METTL21A,GJB4,IL33, etc. | 1.35e-01 |  |
| CREB1 | CD8TEXP | Oral cavity | NEOLP | OSBPL7,ZC3H12C,DLEU1, etc. | 3.04e-01 |  |
| CREB1 | EE | Stomach | Healthy | CPD,PLD3,DBNL, etc. | 2.33e-01 |  |
| ∗The dot plots of a searched regulon are shown for all cell subpopulations in each disease state of each tissue based on the regulon specific score inferred using pySCENIC and by calculating the average expression. |
| Page: 1 |
Top |
Somatic mutation of malignant transformation related genes |
| Annotation of somatic variants for genes involved in malignant transformation |
| Hugo Symbol | Variant Class | Variant Classification | dbSNP RS | HGVSc | HGVSp | HGVSp Short | SWISSPROT | BIOTYPE | SIFT | PolyPhen | Tumor Sample Barcode | Tissue | Histology | Sex | Age | Stage | Therapy Types | Drugs | Outcome |
| CREB1 | SNV | Missense_Mutation | c.865N>T | p.Arg289Cys | p.R289C | P16220 | protein_coding | deleterious(0) | probably_damaging(0.999) | TCGA-E2-A15C-01 | Breast | breast invasive carcinoma | Female | <65 | I/II | Hormone Therapy | arimidex | SD | |
| CREB1 | SNV | Missense_Mutation | c.454G>C | p.Glu152Gln | p.E152Q | P16220 | protein_coding | deleterious(0.03) | probably_damaging(0.998) | TCGA-LP-A4AW-01 | Cervix | cervical & endocervical cancer | Female | <65 | I/II | Unknown | Unknown | SD | |
| CREB1 | SNV | Missense_Mutation | c.203N>C | p.Gly68Ala | p.G68A | P16220 | protein_coding | deleterious(0.04) | probably_damaging(0.997) | TCGA-4T-AA8H-01 | Colorectum | colon adenocarcinoma | Female | <65 | I/II | Unknown | Unknown | SD | |
| CREB1 | SNV | Missense_Mutation | c.976A>G | p.Ile326Val | p.I326V | P16220 | protein_coding | deleterious(0) | probably_damaging(0.97) | TCGA-AA-A00N-01 | Colorectum | colon adenocarcinoma | Male | >=65 | I/II | Unknown | Unknown | PD | |
| CREB1 | SNV | Missense_Mutation | c.880A>G | p.Arg294Gly | p.R294G | P16220 | protein_coding | deleterious(0) | probably_damaging(0.994) | TCGA-AD-A5EJ-01 | Colorectum | colon adenocarcinoma | Female | >=65 | I/II | Unknown | Unknown | SD | |
| CREB1 | SNV | Missense_Mutation | novel | c.307N>G | p.Ser103Ala | p.S103A | P16220 | protein_coding | tolerated(1) | benign(0.015) | TCGA-F5-6814-01 | Colorectum | rectum adenocarcinoma | Male | <65 | I/II | Unknown | Unknown | SD |
| CREB1 | insertion | Nonsense_Mutation | novel | c.929_930insATTTCCACATATTTA | p.Cys310delinsTer | p.C310delins* | P16220 | protein_coding | TCGA-AM-5820-01 | Colorectum | colon adenocarcinoma | Female | <65 | I/II | Unknown | Unknown | SD | ||
| CREB1 | SNV | Missense_Mutation | novel | c.232N>G | p.Ile78Val | p.I78V | P16220 | protein_coding | deleterious(0) | benign(0.094) | TCGA-A5-A2K5-01 | Endometrium | uterine corpus endometrioid carcinoma | Female | >=65 | I/II | Unknown | Unknown | SD |
| CREB1 | SNV | Missense_Mutation | c.79N>A | p.Val27Ile | p.V27I | P16220 | protein_coding | tolerated_low_confidence(0.64) | benign(0) | TCGA-AP-A051-01 | Endometrium | uterine corpus endometrioid carcinoma | Female | >=65 | I/II | Unknown | Unknown | SD | |
| CREB1 | SNV | Missense_Mutation | c.336G>T | p.Gln112His | p.Q112H | P16220 | protein_coding | tolerated(0.07) | benign(0.001) | TCGA-AP-A059-01 | Endometrium | uterine corpus endometrioid carcinoma | Female | >=65 | I/II | Unknown | Unknown | SD |
| Page: 1 2 3 |
Top |
Related drugs of malignant transformation related genes |
| Identification of chemicals and drugs interact with genes involved in malignant transfromation |
| (DGIdb 4.0) |
| Entrez ID | Symbol | Category | Interaction Types | Drug Claim Name | Drug Name | PMIDs |
| 1385 | CREB1 | CLINICALLY ACTIONABLE, TRANSCRIPTION FACTOR COMPLEX, KINASE, TRANSCRIPTION FACTOR | citalopram | CITALOPRAM | 20643483,17548750 | |
| 1385 | CREB1 | CLINICALLY ACTIONABLE, TRANSCRIPTION FACTOR COMPLEX, KINASE, TRANSCRIPTION FACTOR | lithium | LITHIUM | 24885933 | |
| 1385 | CREB1 | CLINICALLY ACTIONABLE, TRANSCRIPTION FACTOR COMPLEX, KINASE, TRANSCRIPTION FACTOR | NICOTINE | NICOTINE | 11331423 | |
| 1385 | CREB1 | CLINICALLY ACTIONABLE, TRANSCRIPTION FACTOR COMPLEX, KINASE, TRANSCRIPTION FACTOR | ETHANOL | ALCOHOL | 11181917 | |
| 1385 | CREB1 | CLINICALLY ACTIONABLE, TRANSCRIPTION FACTOR COMPLEX, KINASE, TRANSCRIPTION FACTOR | antidepressants | 23537502,20643483,17548750 |
| Page: 1 |

Copyright 2023-Present -The University of Texas Health Science Center at Houston |