
|
|||||
|
 | |
| |
| |
| |
| |
| |
|
Gene: CRADD |
Gene summary for CRADD |
| Gene information | Species | Human | Gene symbol | CRADD | Gene ID | 8738 |
| Gene name | CASP2 and RIPK1 domain containing adaptor with death domain | |
| Gene Alias | MRT34 | |
| Cytomap | 12q22 | |
| Gene Type | protein-coding | GO ID | GO:0000075 | UniProtAcc | P78560 |
Top |
Malignant transformation analysis |
| Identification of the aberrant gene expression in precancerous and cancerous lesions by comparing the gene expression of stem-like cells in diseased tissues with normal stem cells |
| Entrez ID | Symbol | Replicates | Species | Organ | Tissue | Adj P-value | Log2FC | Malignancy |
| 8738 | CRADD | CCI_1 | Human | Cervix | CC | 5.48e-07 | 6.48e-01 | 0.528 |
| 8738 | CRADD | CCI_2 | Human | Cervix | CC | 1.25e-07 | 5.93e-01 | 0.5249 |
| 8738 | CRADD | CCI_3 | Human | Cervix | CC | 7.99e-14 | 7.25e-01 | 0.516 |
| 8738 | CRADD | HTA11_3410_2000001011 | Human | Colorectum | AD | 2.36e-13 | -5.23e-01 | 0.0155 |
| 8738 | CRADD | HTA11_3361_2000001011 | Human | Colorectum | AD | 3.86e-03 | -4.31e-01 | -0.1207 |
| 8738 | CRADD | HTA11_7862_2000001011 | Human | Colorectum | AD | 1.09e-03 | -5.76e-01 | -0.0179 |
| 8738 | CRADD | HTA11_866_3004761011 | Human | Colorectum | AD | 6.97e-06 | -4.65e-01 | 0.096 |
| 8738 | CRADD | HTA11_10711_2000001011 | Human | Colorectum | AD | 4.55e-03 | -2.88e-01 | 0.0338 |
| 8738 | CRADD | HTA11_7696_3000711011 | Human | Colorectum | AD | 1.02e-06 | -3.93e-01 | 0.0674 |
| 8738 | CRADD | HTA11_99999970781_79442 | Human | Colorectum | MSS | 4.58e-11 | -5.20e-01 | 0.294 |
| 8738 | CRADD | HTA11_99999971662_82457 | Human | Colorectum | MSS | 7.38e-06 | -4.11e-01 | 0.3859 |
| 8738 | CRADD | HTA11_99999973899_84307 | Human | Colorectum | MSS | 1.08e-03 | -5.42e-01 | 0.2585 |
| 8738 | CRADD | HTA11_99999974143_84620 | Human | Colorectum | MSS | 4.95e-16 | -5.14e-01 | 0.3005 |
| 8738 | CRADD | A015-C-203 | Human | Colorectum | FAP | 3.06e-25 | -5.65e-01 | -0.1294 |
| 8738 | CRADD | A015-C-204 | Human | Colorectum | FAP | 6.94e-05 | -3.19e-01 | -0.0228 |
| 8738 | CRADD | A014-C-040 | Human | Colorectum | FAP | 1.50e-04 | -4.29e-01 | -0.1184 |
| 8738 | CRADD | A002-C-201 | Human | Colorectum | FAP | 4.44e-12 | -3.75e-01 | 0.0324 |
| 8738 | CRADD | A001-C-119 | Human | Colorectum | FAP | 3.74e-15 | -6.55e-01 | -0.1557 |
| 8738 | CRADD | A001-C-108 | Human | Colorectum | FAP | 1.22e-14 | -4.83e-01 | -0.0272 |
| 8738 | CRADD | A002-C-205 | Human | Colorectum | FAP | 4.25e-27 | -6.74e-01 | -0.1236 |
| Page: 1 2 3 4 |
| Tissue | Expression Dynamics | Abbreviation |
| Cervix |  | CC: Cervix cancer |
| HSIL_HPV: HPV-infected high-grade squamous intraepithelial lesions | ||
| N_HPV: HPV-infected normal cervix | ||
| Colorectum (GSE201348) |  | FAP: Familial adenomatous polyposis |
| CRC: Colorectal cancer | ||
| Colorectum (HTA11) | 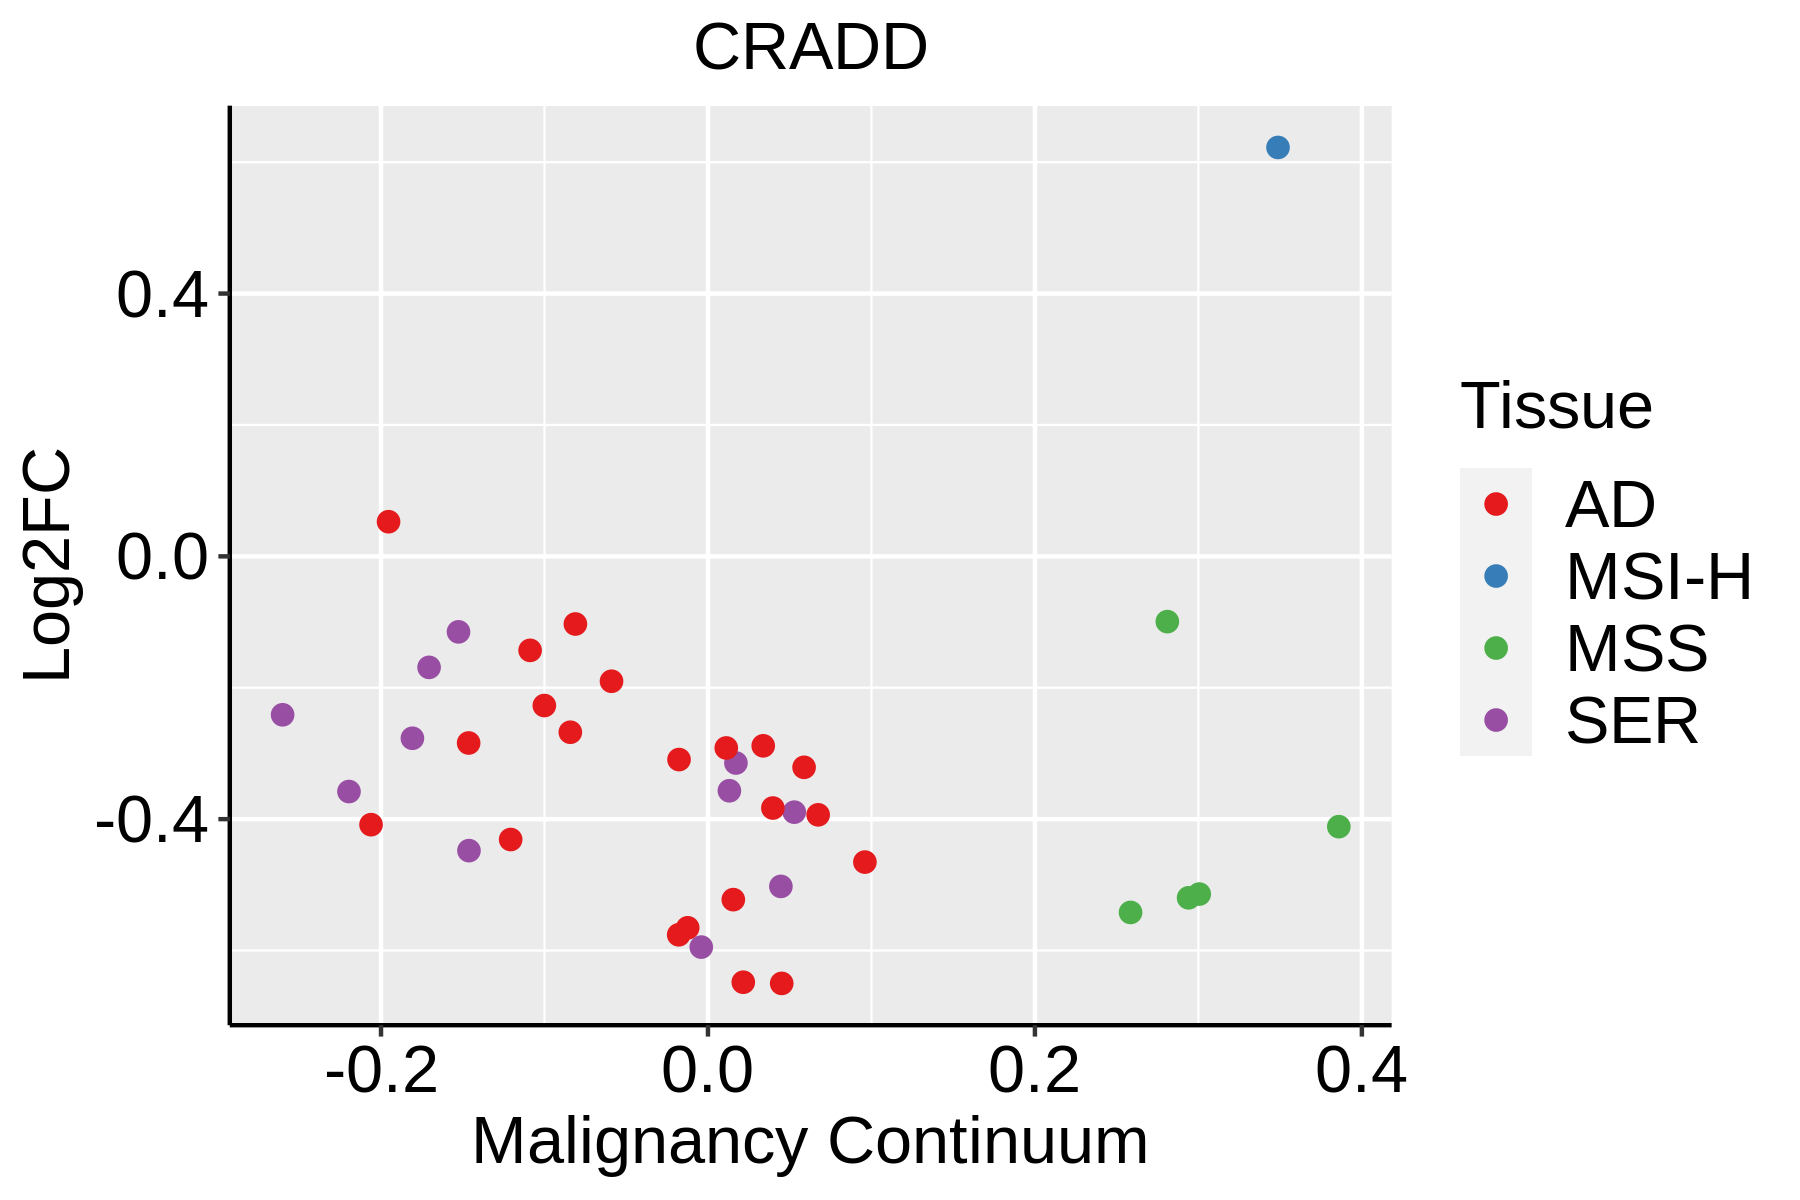 | AD: Adenomas |
| SER: Sessile serrated lesions | ||
| MSI-H: Microsatellite-high colorectal cancer | ||
| MSS: Microsatellite stable colorectal cancer | ||
| Liver | 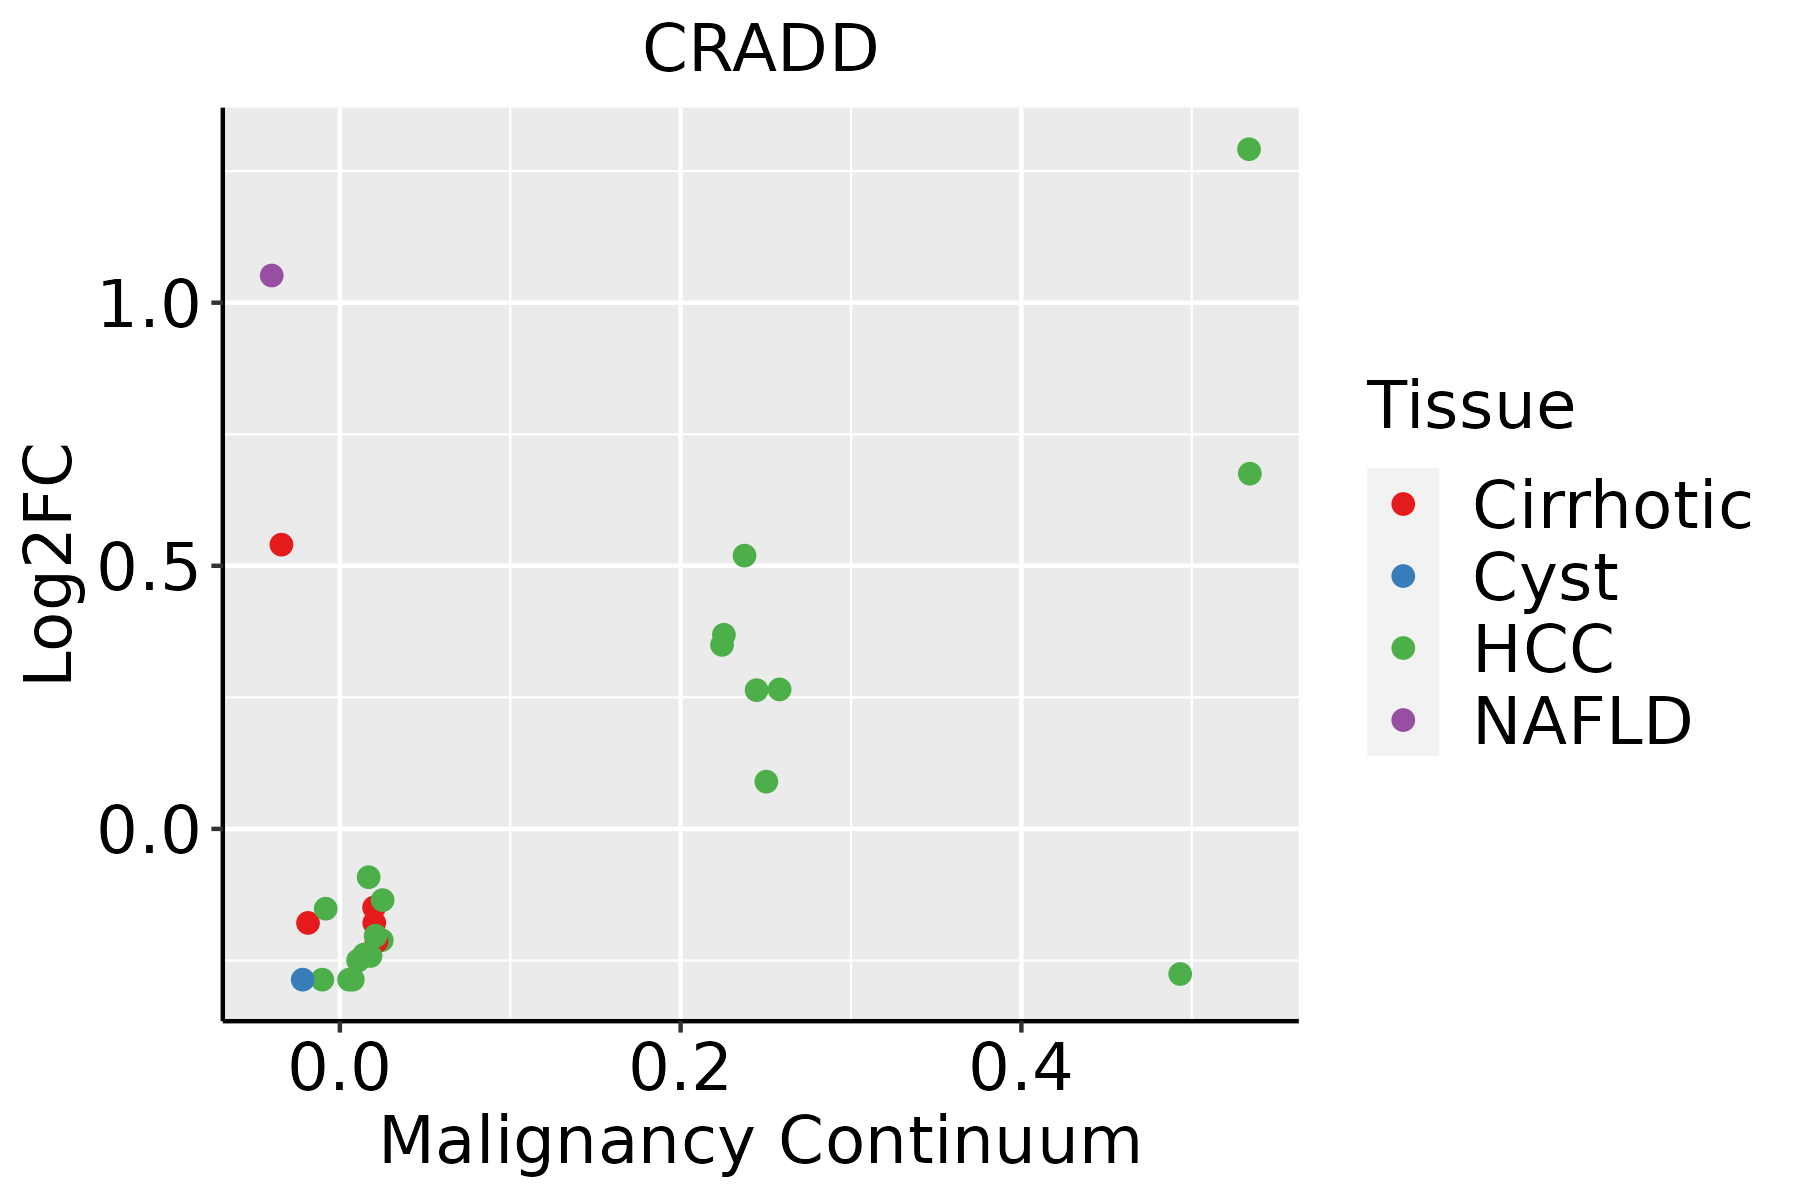 | HCC: Hepatocellular carcinoma |
| NAFLD: Non-alcoholic fatty liver disease | ||
| Lung | 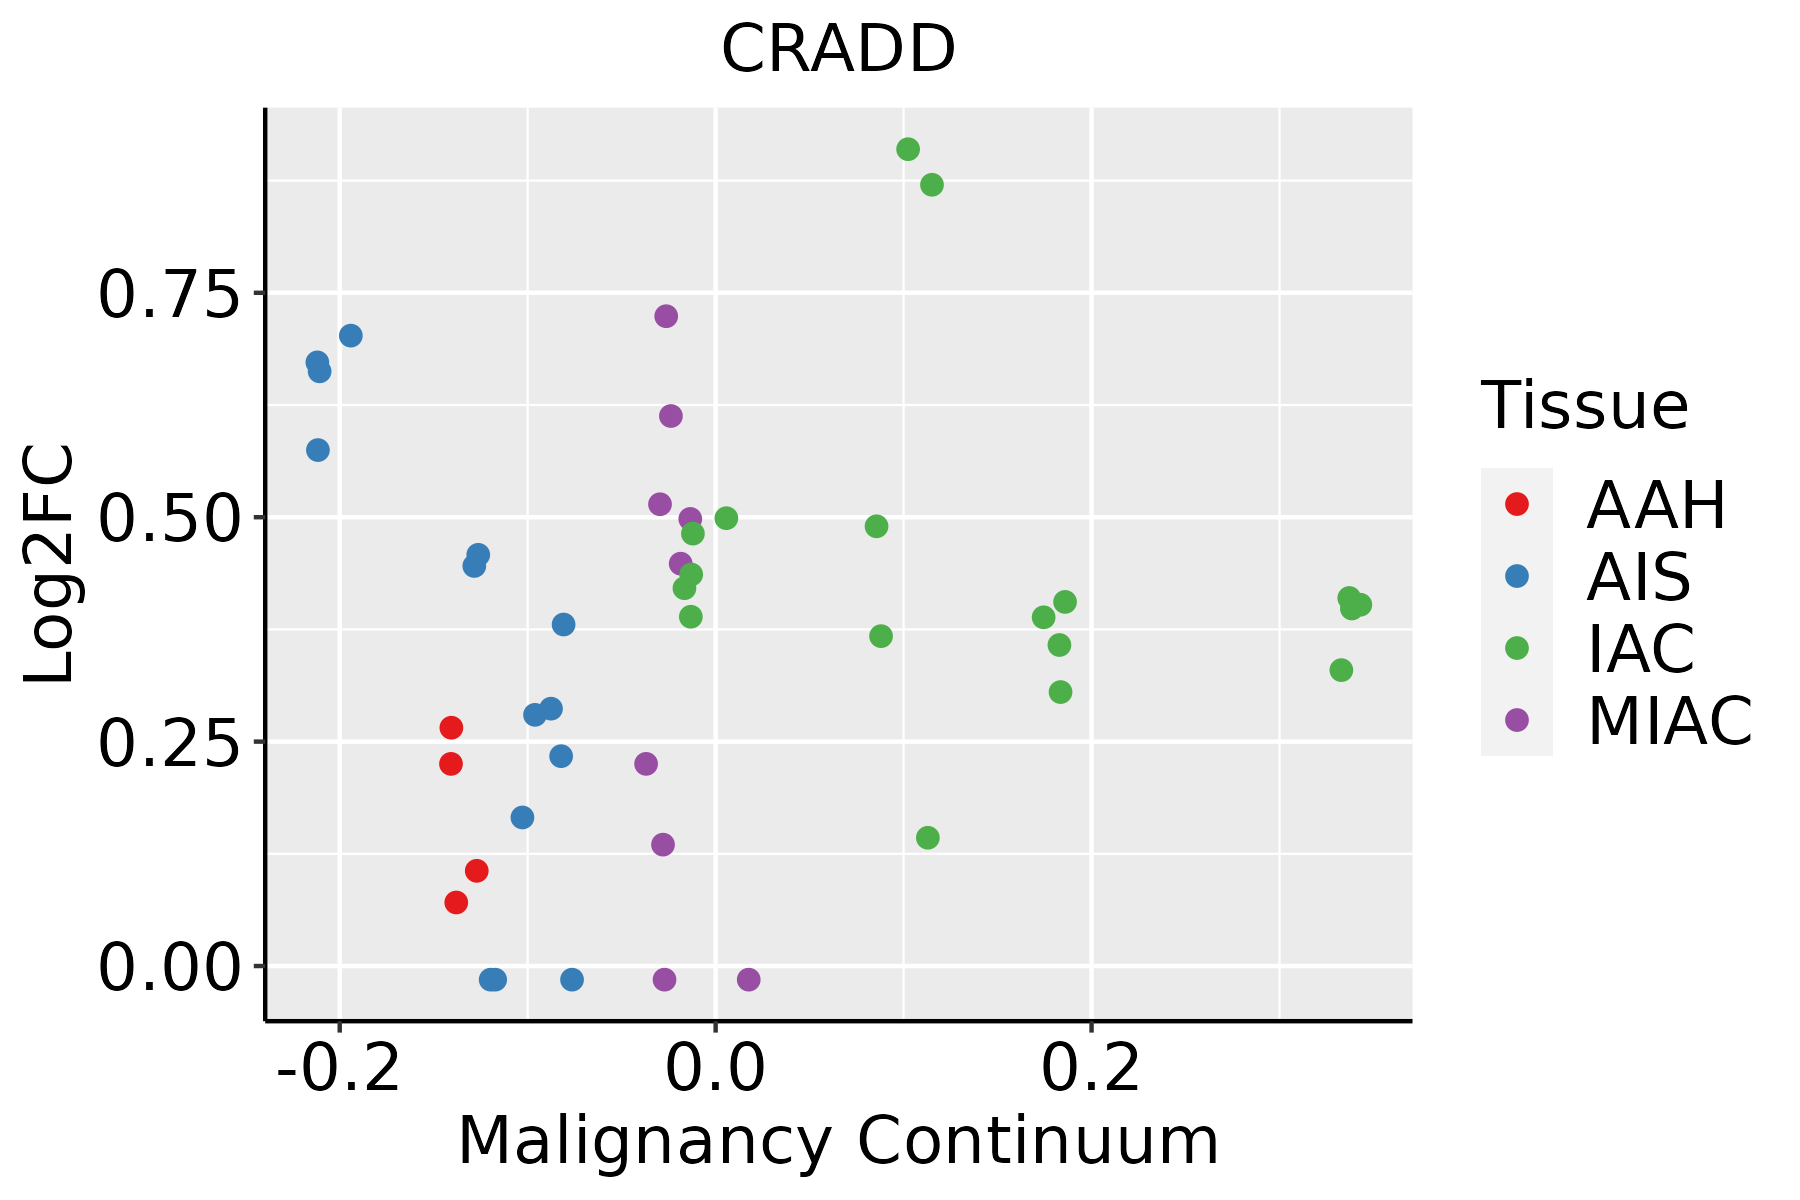 | AAH: Atypical adenomatous hyperplasia |
| AIS: Adenocarcinoma in situ | ||
| IAC: Invasive lung adenocarcinoma | ||
| MIA: Minimally invasive adenocarcinoma |
| ∗log2FC in expression of this searched gene in stem-like cells from each diseased tissue sample relative to stem-like cells in normal samples in each tissue plotted against the malignancy continuum. Samples are colored based on if they are from different disease stage. |
Top |
Malignant transformation related pathway analysis |
| Find out the enriched GO biological processes and KEGG pathways involved in transition from healthy to precancer to cancer |
| Tissue | Disease Stage | Enriched GO biological Processes |
| Colorectum | AD |  |
| Colorectum | SER |  |
| Colorectum | MSS |  |
| Colorectum | MSI-H |  |
| Colorectum | FAP |  |
| ∗Top 15 enriched GO BP terms are showed in the bar plot of each disease state in each tissue. Each row represents a significant GO biological process which is colored according to the -log10(p.adjust). |
| Page: 1 2 3 4 5 6 7 8 9 |
| GO ID | Tissue | Disease Stage | Description | Gene Ratio | Bg Ratio | pvalue | p.adjust | Count |
| GO:004328112 | Liver | HCC | regulation of cysteine-type endopeptidase activity involved in apoptotic process | 125/7958 | 209/18723 | 3.12e-07 | 5.42e-06 | 125 |
| GO:200011612 | Liver | HCC | regulation of cysteine-type endopeptidase activity | 137/7958 | 235/18723 | 6.91e-07 | 1.08e-05 | 137 |
| GO:005254722 | Liver | HCC | regulation of peptidase activity | 247/7958 | 461/18723 | 8.28e-07 | 1.27e-05 | 247 |
| GO:007121421 | Liver | HCC | cellular response to abiotic stimulus | 183/7958 | 331/18723 | 1.59e-06 | 2.26e-05 | 183 |
| GO:010400421 | Liver | HCC | cellular response to environmental stimulus | 183/7958 | 331/18723 | 1.59e-06 | 2.26e-05 | 183 |
| GO:19019901 | Liver | HCC | regulation of mitotic cell cycle phase transition | 167/7958 | 299/18723 | 1.96e-06 | 2.71e-05 | 167 |
| GO:19019871 | Liver | HCC | regulation of cell cycle phase transition | 211/7958 | 390/18723 | 2.11e-06 | 2.89e-05 | 211 |
| GO:00427702 | Liver | HCC | signal transduction in response to DNA damage | 103/7958 | 172/18723 | 3.05e-06 | 4.04e-05 | 103 |
| GO:005254822 | Liver | HCC | regulation of endopeptidase activity | 230/7958 | 432/18723 | 3.58e-06 | 4.68e-05 | 230 |
| GO:200123522 | Liver | HCC | positive regulation of apoptotic signaling pathway | 79/7958 | 126/18723 | 3.70e-06 | 4.82e-05 | 79 |
| GO:000862511 | Liver | HCC | extrinsic apoptotic signaling pathway via death domain receptors | 55/7958 | 82/18723 | 5.97e-06 | 7.35e-05 | 55 |
| GO:00000751 | Liver | HCC | cell cycle checkpoint | 100/7958 | 169/18723 | 8.75e-06 | 1.02e-04 | 100 |
| GO:0045786 | Liver | HCC | negative regulation of cell cycle | 204/7958 | 385/18723 | 1.84e-05 | 1.99e-04 | 204 |
| GO:00448432 | Liver | HCC | cell cycle G1/S phase transition | 134/7958 | 241/18723 | 2.60e-05 | 2.70e-04 | 134 |
| GO:0045930 | Liver | HCC | negative regulation of mitotic cell cycle | 130/7958 | 235/18723 | 4.69e-05 | 4.50e-04 | 130 |
| GO:0007093 | Liver | HCC | mitotic cell cycle checkpoint | 77/7958 | 129/18723 | 6.00e-05 | 5.50e-04 | 77 |
| GO:00000822 | Liver | HCC | G1/S transition of mitotic cell cycle | 119/7958 | 214/18723 | 7.11e-05 | 6.39e-04 | 119 |
| GO:001095212 | Liver | HCC | positive regulation of peptidase activity | 110/7958 | 197/18723 | 1.04e-04 | 8.98e-04 | 110 |
| GO:003033021 | Liver | HCC | DNA damage response, signal transduction by p53 class mediator | 46/7958 | 72/18723 | 2.02e-04 | 1.56e-03 | 46 |
| GO:00000771 | Liver | HCC | DNA damage checkpoint | 68/7958 | 115/18723 | 2.33e-04 | 1.77e-03 | 68 |
| Page: 1 2 3 4 5 6 7 8 9 10 11 12 13 |
| Pathway ID | Tissue | Disease Stage | Description | Gene Ratio | Bg Ratio | pvalue | p.adjust | qvalue | Count |
| Page: 1 |
Top |
Cell-cell communication analysis |
| Identification of potential cell-cell interactions between two cell types and their ligand-receptor pairs for different disease states |
| Ligand | Receptor | LRpair | Pathway | Tissue | Disease Stage |
| Page: 1 |
Top |
Single-cell gene regulatory network inference analysis |
| Find out the significant the regulons (TFs) and the target genes of each regulon across cell types for different disease states |
| TF | Cell Type | Tissue | Disease Stage | Target Gene | RSS | Regulon Activity |
| ∗The dot plots of a searched regulon are shown for all cell subpopulations in each disease state of each tissue based on the regulon specific score inferred using pySCENIC and by calculating the average expression. |
| Page: 1 |
Top |
Somatic mutation of malignant transformation related genes |
| Annotation of somatic variants for genes involved in malignant transformation |
| Hugo Symbol | Variant Class | Variant Classification | dbSNP RS | HGVSc | HGVSp | HGVSp Short | SWISSPROT | BIOTYPE | SIFT | PolyPhen | Tumor Sample Barcode | Tissue | Histology | Sex | Age | Stage | Therapy Types | Drugs | Outcome |
| CRADD | SNV | Missense_Mutation | c.173N>C | p.Leu58Pro | p.L58P | P78560 | protein_coding | deleterious(0) | probably_damaging(1) | TCGA-AA-3966-01 | Colorectum | colon adenocarcinoma | Female | >=65 | I/II | Unknown | Unknown | SD | |
| CRADD | SNV | Missense_Mutation | rs768737669 | c.155G>A | p.Arg52Gln | p.R52Q | P78560 | protein_coding | tolerated(0.31) | benign(0.109) | TCGA-AA-A02R-01 | Colorectum | colon adenocarcinoma | Female | >=65 | I/II | Unknown | Unknown | PD |
| CRADD | SNV | Missense_Mutation | c.553N>T | p.Arg185Trp | p.R185W | P78560 | protein_coding | deleterious(0.01) | possibly_damaging(0.545) | TCGA-CK-6746-01 | Colorectum | colon adenocarcinoma | Female | >=65 | I/II | Unknown | Unknown | SD | |
| CRADD | SNV | Missense_Mutation | c.514G>A | p.Gly172Arg | p.G172R | P78560 | protein_coding | deleterious(0) | probably_damaging(1) | TCGA-AG-A02N-01 | Colorectum | rectum adenocarcinoma | Male | >=65 | I/II | Chemotherapy | folinic | CR | |
| CRADD | SNV | Missense_Mutation | rs752845581 | c.473N>T | p.Ser158Leu | p.S158L | P78560 | protein_coding | deleterious(0.01) | possibly_damaging(0.769) | TCGA-AG-A036-01 | Colorectum | rectum adenocarcinoma | Male | >=65 | III/IV | Chemotherapy | 5-fluorouracil | CR |
| CRADD | SNV | Missense_Mutation | rs373657793 | c.391N>C | p.Trp131Arg | p.W131R | P78560 | protein_coding | deleterious(0) | probably_damaging(1) | TCGA-EI-6882-01 | Colorectum | rectum adenocarcinoma | Male | <65 | I/II | Unknown | Unknown | SD |
| CRADD | SNV | Missense_Mutation | rs759051210 | c.286G>A | p.Asp96Asn | p.D96N | P78560 | protein_coding | tolerated(0.2) | benign(0.001) | TCGA-A5-A0G2-01 | Endometrium | uterine corpus endometrioid carcinoma | Female | <65 | III/IV | Unknown | Unknown | SD |
| CRADD | SNV | Missense_Mutation | novel | c.531N>A | p.Phe177Leu | p.F177L | P78560 | protein_coding | tolerated(0.28) | benign(0.001) | TCGA-A5-A2K5-01 | Endometrium | uterine corpus endometrioid carcinoma | Female | >=65 | I/II | Unknown | Unknown | SD |
| CRADD | SNV | Missense_Mutation | c.38N>A | p.Arg13His | p.R13H | P78560 | protein_coding | deleterious(0.02) | probably_damaging(0.998) | TCGA-AP-A059-01 | Endometrium | uterine corpus endometrioid carcinoma | Female | >=65 | I/II | Unknown | Unknown | SD | |
| CRADD | SNV | Missense_Mutation | novel | c.403N>A | p.Val135Met | p.V135M | P78560 | protein_coding | tolerated(0.15) | possibly_damaging(0.708) | TCGA-AP-A0LM-01 | Endometrium | uterine corpus endometrioid carcinoma | Female | <65 | III/IV | Chemotherapy | cisplatin | SD |
| Page: 1 2 3 4 |
Top |
Related drugs of malignant transformation related genes |
| Identification of chemicals and drugs interact with genes involved in malignant transfromation |
| (DGIdb 4.0) |
| Entrez ID | Symbol | Category | Interaction Types | Drug Claim Name | Drug Name | PMIDs |
| Page: 1 |

Copyright 2023-Present -The University of Texas Health Science Center at Houston |