
|
|||||
|
 | |
| |
| |
| |
| |
| |
|
Gene: CPB2 |
Gene summary for CPB2 |
| Gene information | Species | Human | Gene symbol | CPB2 | Gene ID | 1361 |
| Gene name | carboxypeptidase B2 | |
| Gene Alias | CPU | |
| Cytomap | 13q14.13 | |
| Gene Type | protein-coding | GO ID | GO:0001678 | UniProtAcc | A0A087WSY5 |
Top |
Malignant transformation analysis |
| Identification of the aberrant gene expression in precancerous and cancerous lesions by comparing the gene expression of stem-like cells in diseased tissues with normal stem cells |
| Entrez ID | Symbol | Replicates | Species | Organ | Tissue | Adj P-value | Log2FC | Malignancy |
| 1361 | CPB2 | NAFLD1 | Human | Liver | NAFLD | 1.08e-04 | 8.12e-01 | -0.04 |
| 1361 | CPB2 | S42 | Human | Liver | HCC | 1.77e-02 | -6.20e-01 | -0.0103 |
| 1361 | CPB2 | S43 | Human | Liver | Cirrhotic | 1.22e-32 | -3.61e-01 | -0.0187 |
| 1361 | CPB2 | HCC1_Meng | Human | Liver | HCC | 9.11e-81 | -3.13e-01 | 0.0246 |
| 1361 | CPB2 | HCC2_Meng | Human | Liver | HCC | 8.90e-40 | -8.61e-01 | 0.0107 |
| 1361 | CPB2 | cirrhotic1 | Human | Liver | Cirrhotic | 1.46e-07 | -7.49e-02 | 0.0202 |
| 1361 | CPB2 | cirrhotic2 | Human | Liver | Cirrhotic | 4.30e-09 | 1.31e-01 | 0.0201 |
| 1361 | CPB2 | cirrhotic3 | Human | Liver | Cirrhotic | 2.33e-10 | -5.23e-01 | 0.0215 |
| 1361 | CPB2 | HCC1 | Human | Liver | HCC | 2.34e-12 | 5.74e+00 | 0.5336 |
| 1361 | CPB2 | HCC2 | Human | Liver | HCC | 6.23e-20 | 4.10e+00 | 0.5341 |
| 1361 | CPB2 | HCC5 | Human | Liver | HCC | 7.42e-12 | 1.23e+00 | 0.4932 |
| 1361 | CPB2 | Pt13.a | Human | Liver | HCC | 1.25e-02 | -1.83e-01 | 0.021 |
| 1361 | CPB2 | Pt13.b | Human | Liver | HCC | 4.42e-27 | -3.44e-01 | 0.0251 |
| 1361 | CPB2 | Pt13.c | Human | Liver | HCC | 1.53e-06 | -6.12e-01 | 0.0076 |
| 1361 | CPB2 | Pt14.a | Human | Liver | HCC | 4.37e-02 | -1.26e-01 | 0.0169 |
| 1361 | CPB2 | Pt14.b | Human | Liver | HCC | 2.82e-04 | -2.26e-01 | 0.018 |
| 1361 | CPB2 | Pt14.d | Human | Liver | HCC | 2.12e-06 | -3.72e-01 | 0.0143 |
| 1361 | CPB2 | S014 | Human | Liver | HCC | 1.86e-10 | 1.17e+00 | 0.2254 |
| 1361 | CPB2 | S015 | Human | Liver | HCC | 7.99e-10 | 1.38e+00 | 0.2375 |
| 1361 | CPB2 | S016 | Human | Liver | HCC | 1.08e-13 | 1.46e+00 | 0.2243 |
| Page: 1 2 |
| Tissue | Expression Dynamics | Abbreviation |
| Liver | 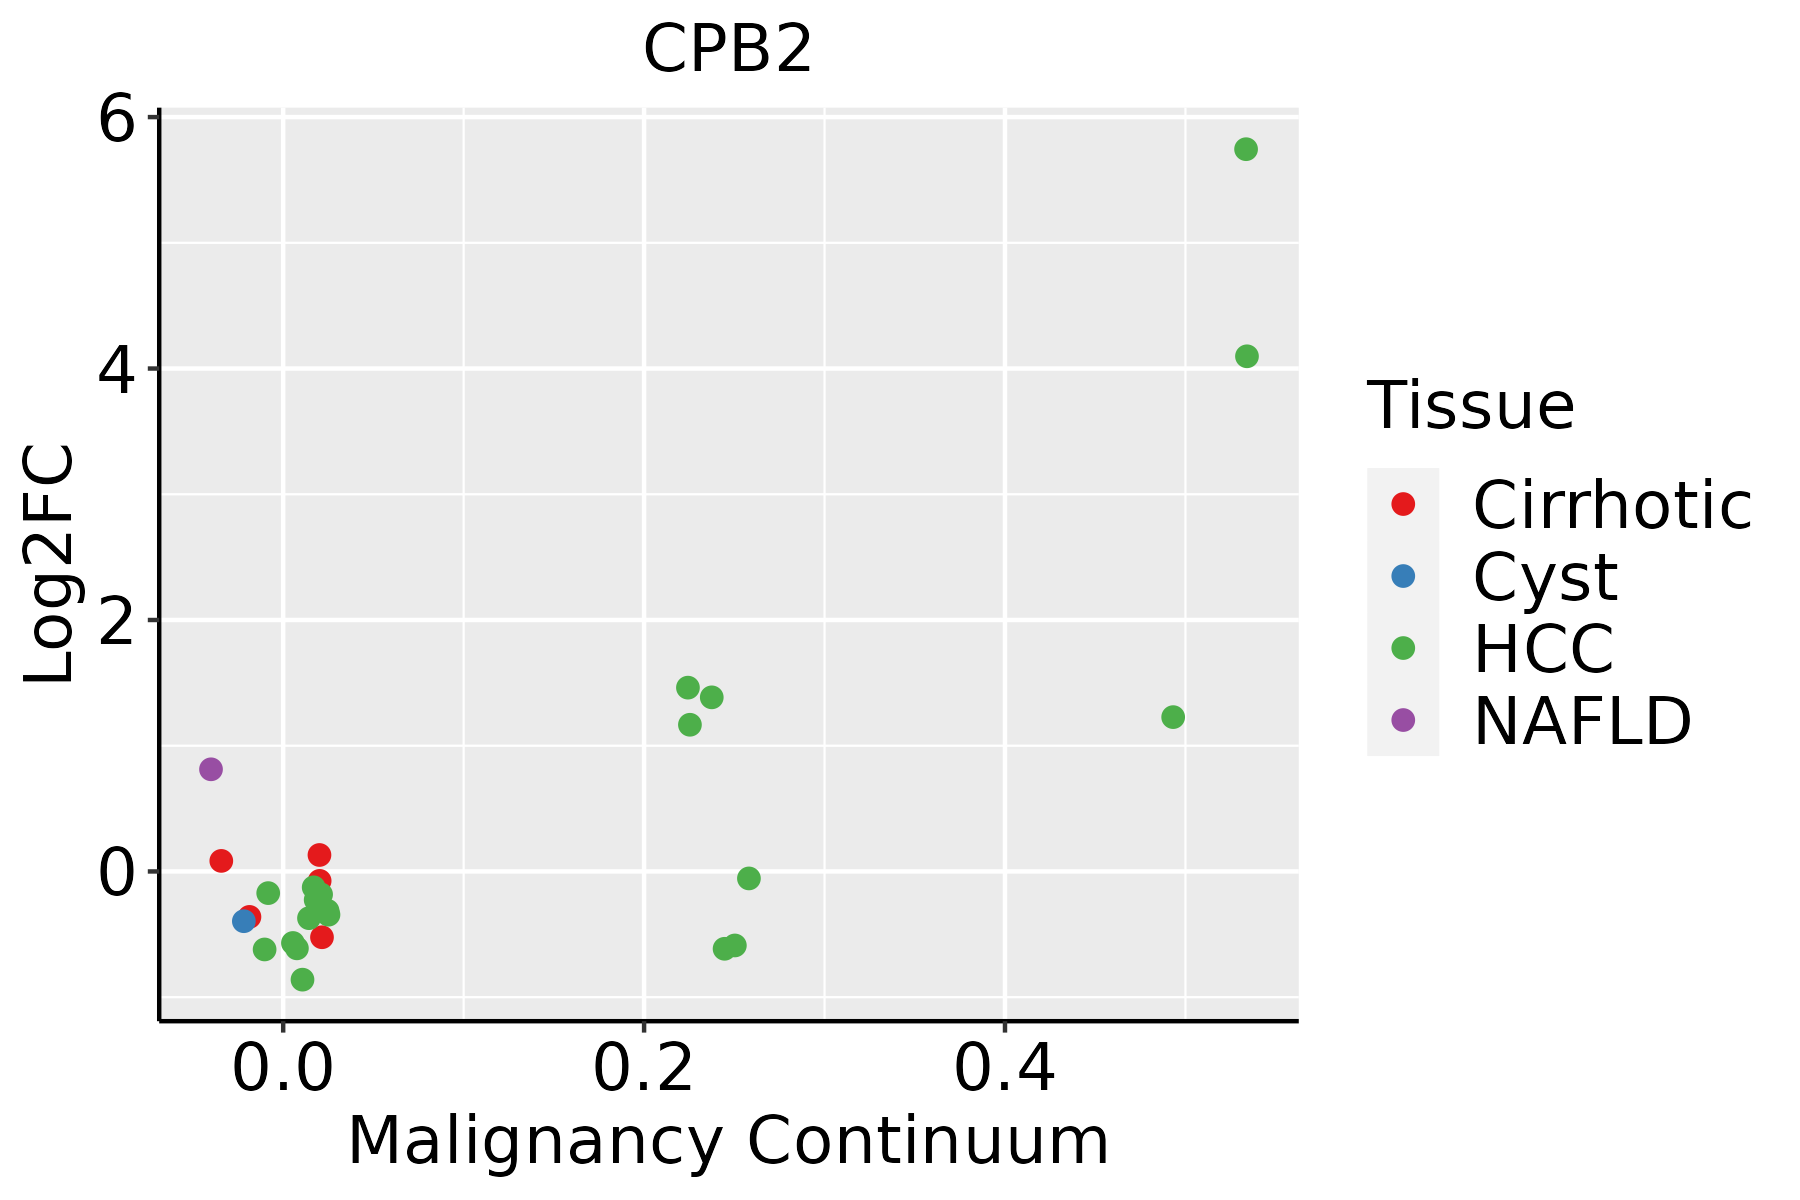 | HCC: Hepatocellular carcinoma |
| NAFLD: Non-alcoholic fatty liver disease | ||
| Lung | 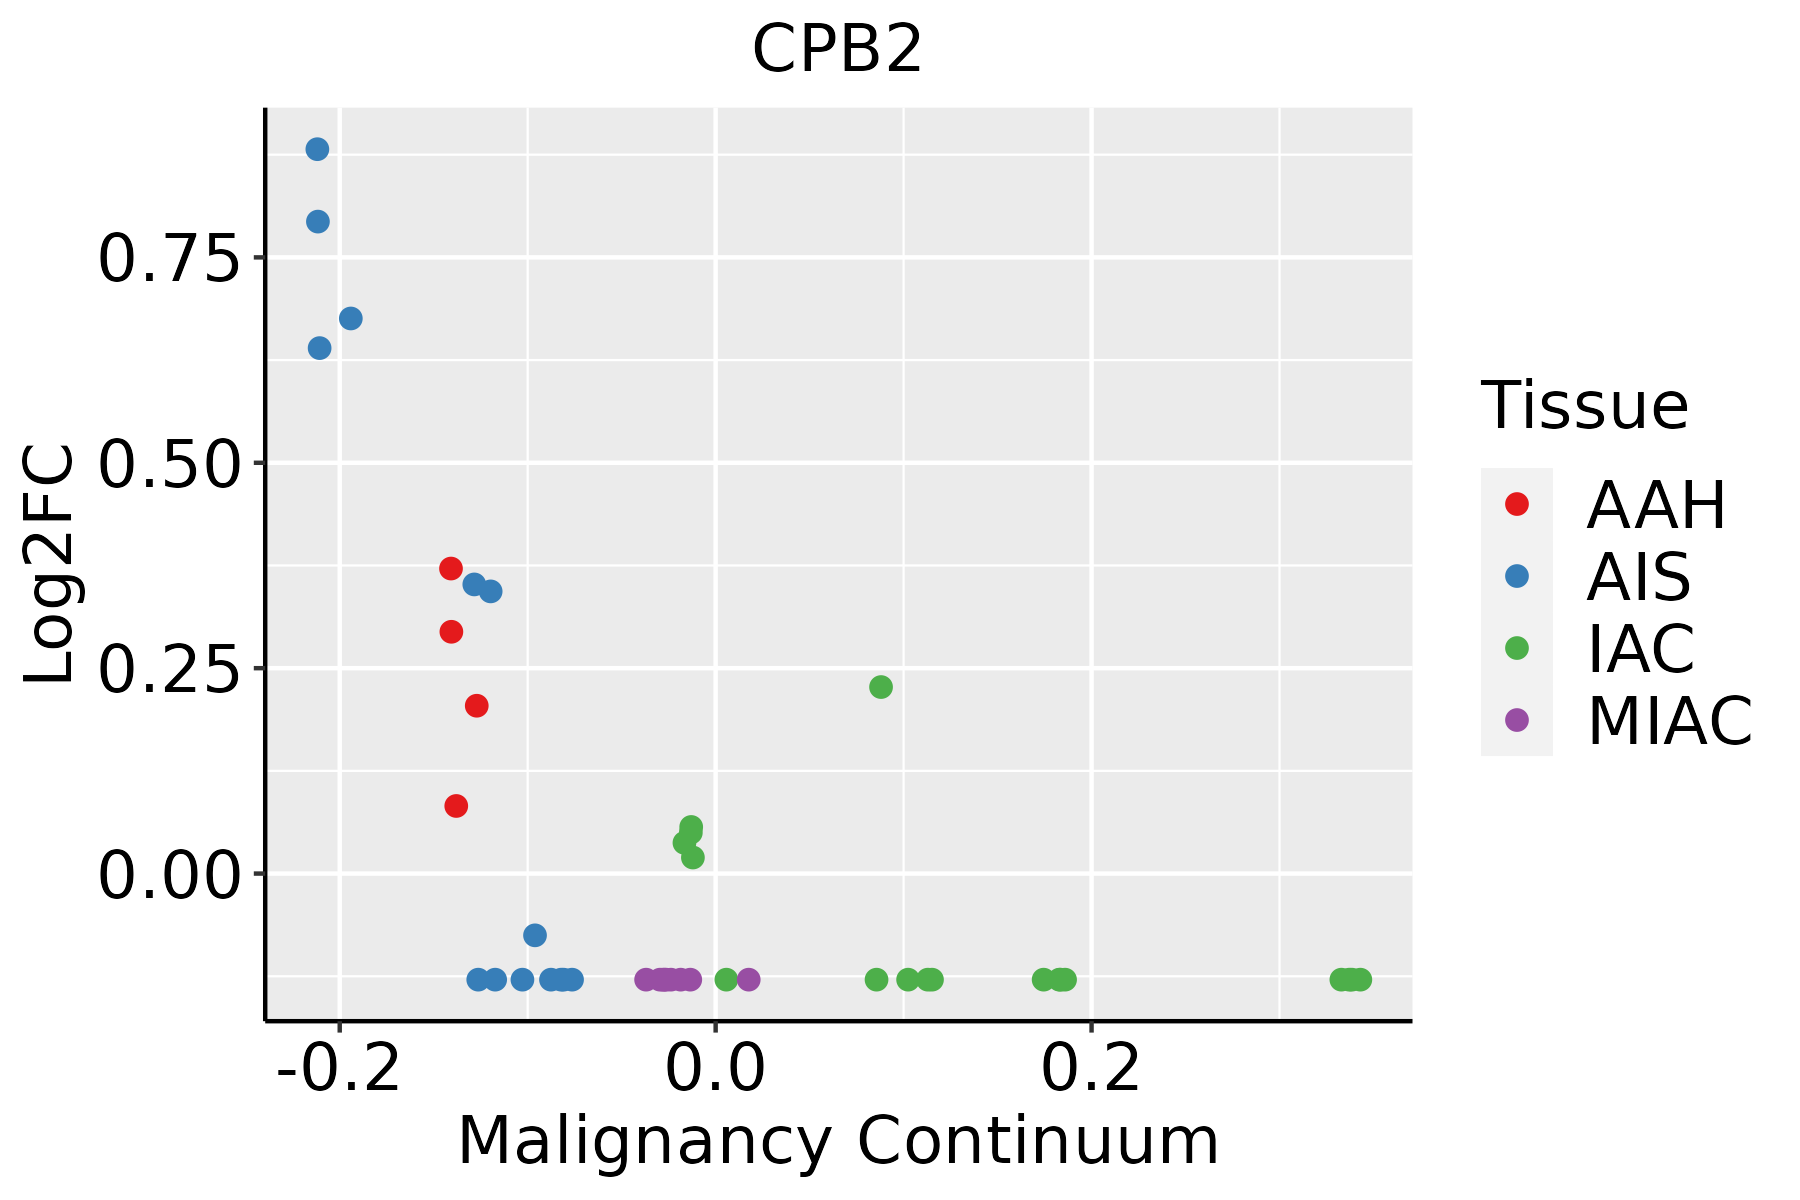 | AAH: Atypical adenomatous hyperplasia |
| AIS: Adenocarcinoma in situ | ||
| IAC: Invasive lung adenocarcinoma | ||
| MIA: Minimally invasive adenocarcinoma |
| ∗log2FC in expression of this searched gene in stem-like cells from each diseased tissue sample relative to stem-like cells in normal samples in each tissue plotted against the malignancy continuum. Samples are colored based on if they are from different disease stage. |
Top |
Malignant transformation related pathway analysis |
| Find out the enriched GO biological processes and KEGG pathways involved in transition from healthy to precancer to cancer |
| Tissue | Disease Stage | Enriched GO biological Processes |
| Colorectum | AD |  |
| Colorectum | SER |  |
| Colorectum | MSS |  |
| Colorectum | MSI-H |  |
| Colorectum | FAP |  |
| ∗Top 15 enriched GO BP terms are showed in the bar plot of each disease state in each tissue. Each row represents a significant GO biological process which is colored according to the -log10(p.adjust). |
| Page: 1 2 3 4 5 6 7 8 9 |
| GO ID | Tissue | Disease Stage | Description | Gene Ratio | Bg Ratio | pvalue | p.adjust | Count |
| GO:007132612 | Liver | HCC | cellular response to monosaccharide stimulus | 85/7958 | 154/18723 | 9.78e-04 | 5.68e-03 | 85 |
| GO:005087822 | Liver | HCC | regulation of body fluid levels | 191/7958 | 379/18723 | 1.06e-03 | 6.11e-03 | 191 |
| GO:190303621 | Liver | HCC | positive regulation of response to wounding | 44/7958 | 72/18723 | 1.10e-03 | 6.32e-03 | 44 |
| GO:007132212 | Liver | HCC | cellular response to carbohydrate stimulus | 89/7958 | 163/18723 | 1.19e-03 | 6.62e-03 | 89 |
| GO:00508192 | Liver | HCC | negative regulation of coagulation | 34/7958 | 53/18723 | 1.20e-03 | 6.68e-03 | 34 |
| GO:00508202 | Liver | HCC | positive regulation of coagulation | 18/7958 | 24/18723 | 1.27e-03 | 6.92e-03 | 18 |
| GO:00725762 | Liver | HCC | liver morphogenesis | 17/7958 | 23/18723 | 2.28e-03 | 1.13e-02 | 17 |
| GO:00107552 | Liver | HCC | regulation of plasminogen activation | 11/7958 | 13/18723 | 2.38e-03 | 1.16e-02 | 11 |
| GO:00725742 | Liver | HCC | hepatocyte proliferation | 16/7958 | 22/18723 | 4.03e-03 | 1.76e-02 | 16 |
| GO:00725752 | Liver | HCC | epithelial cell proliferation involved in liver morphogenesis | 16/7958 | 22/18723 | 4.03e-03 | 1.76e-02 | 16 |
| GO:00519172 | Liver | HCC | regulation of fibrinolysis | 11/7958 | 14/18723 | 6.81e-03 | 2.73e-02 | 11 |
| GO:19033171 | Liver | HCC | regulation of protein maturation | 39/7958 | 67/18723 | 6.84e-03 | 2.74e-02 | 39 |
| GO:00427302 | Liver | HCC | fibrinolysis | 17/7958 | 25/18723 | 8.94e-03 | 3.45e-02 | 17 |
| GO:00706131 | Liver | HCC | regulation of protein processing | 37/7958 | 65/18723 | 1.33e-02 | 4.77e-02 | 37 |
| GO:004206013 | Lung | AIS | wound healing | 71/1849 | 422/18723 | 5.32e-06 | 2.52e-04 | 71 |
| GO:000974313 | Lung | AIS | response to carbohydrate | 45/1849 | 253/18723 | 7.09e-05 | 1.88e-03 | 45 |
| GO:003428413 | Lung | AIS | response to monosaccharide | 39/1849 | 225/18723 | 3.59e-04 | 6.39e-03 | 39 |
| GO:004586113 | Lung | AIS | negative regulation of proteolysis | 55/1849 | 351/18723 | 3.87e-04 | 6.72e-03 | 55 |
| GO:00508788 | Lung | AIS | regulation of body fluid levels | 57/1849 | 379/18723 | 8.60e-04 | 1.17e-02 | 57 |
| GO:004873213 | Lung | AIS | gland development | 63/1849 | 436/18723 | 1.34e-03 | 1.66e-02 | 63 |
| Page: 1 2 3 4 5 6 7 8 9 |
| Pathway ID | Tissue | Disease Stage | Description | Gene Ratio | Bg Ratio | pvalue | p.adjust | qvalue | Count |
| hsa04610 | Liver | NAFLD | Complement and coagulation cascades | 35/1043 | 86/8465 | 2.48e-11 | 2.04e-09 | 1.64e-09 | 35 |
| hsa046101 | Liver | NAFLD | Complement and coagulation cascades | 35/1043 | 86/8465 | 2.48e-11 | 2.04e-09 | 1.64e-09 | 35 |
| hsa046102 | Liver | Cirrhotic | Complement and coagulation cascades | 48/2530 | 86/8465 | 4.41e-07 | 5.44e-06 | 3.35e-06 | 48 |
| hsa046103 | Liver | Cirrhotic | Complement and coagulation cascades | 48/2530 | 86/8465 | 4.41e-07 | 5.44e-06 | 3.35e-06 | 48 |
| hsa046104 | Liver | HCC | Complement and coagulation cascades | 57/4020 | 86/8465 | 3.19e-04 | 1.45e-03 | 8.04e-04 | 57 |
| hsa046105 | Liver | HCC | Complement and coagulation cascades | 57/4020 | 86/8465 | 3.19e-04 | 1.45e-03 | 8.04e-04 | 57 |
| Page: 1 |
Top |
Cell-cell communication analysis |
| Identification of potential cell-cell interactions between two cell types and their ligand-receptor pairs for different disease states |
| Ligand | Receptor | LRpair | Pathway | Tissue | Disease Stage |
| Page: 1 |
Top |
Single-cell gene regulatory network inference analysis |
| Find out the significant the regulons (TFs) and the target genes of each regulon across cell types for different disease states |
| TF | Cell Type | Tissue | Disease Stage | Target Gene | RSS | Regulon Activity |
| ∗The dot plots of a searched regulon are shown for all cell subpopulations in each disease state of each tissue based on the regulon specific score inferred using pySCENIC and by calculating the average expression. |
| Page: 1 |
Top |
Somatic mutation of malignant transformation related genes |
| Annotation of somatic variants for genes involved in malignant transformation |
| Hugo Symbol | Variant Class | Variant Classification | dbSNP RS | HGVSc | HGVSp | HGVSp Short | SWISSPROT | BIOTYPE | SIFT | PolyPhen | Tumor Sample Barcode | Tissue | Histology | Sex | Age | Stage | Therapy Types | Drugs | Outcome |
| CPB2 | SNV | Missense_Mutation | rs368766293 | c.157N>T | p.Leu53Phe | p.L53F | Q96IY4 | protein_coding | tolerated(0.95) | probably_damaging(1) | TCGA-A7-A13E-01 | Breast | breast invasive carcinoma | Female | <65 | I/II | Targeted Molecular therapy | bevacizumab | PD |
| CPB2 | SNV | Missense_Mutation | c.1096C>G | p.Pro366Ala | p.P366A | Q96IY4 | protein_coding | tolerated(0.76) | probably_damaging(0.968) | TCGA-BH-A0BZ-01 | Breast | breast invasive carcinoma | Female | <65 | III/IV | Chemotherapy | doxorubicin | CR | |
| CPB2 | SNV | Missense_Mutation | c.192N>C | p.Lys64Asn | p.K64N | Q96IY4 | protein_coding | tolerated(0.37) | probably_damaging(0.956) | TCGA-D8-A27G-01 | Breast | breast invasive carcinoma | Female | >=65 | I/II | Unknown | Unknown | SD | |
| CPB2 | SNV | Missense_Mutation | novel | c.731T>G | p.Phe244Cys | p.F244C | Q96IY4 | protein_coding | tolerated(0.19) | possibly_damaging(0.523) | TCGA-C5-A1MN-01 | Cervix | cervical & endocervical cancer | Female | <65 | III/IV | Chemotherapy | cisplatin | SD |
| CPB2 | SNV | Missense_Mutation | novel | c.1192G>A | p.Glu398Lys | p.E398K | Q96IY4 | protein_coding | tolerated(0.07) | benign(0.005) | TCGA-C5-A2LZ-01 | Cervix | cervical & endocervical cancer | Female | >=65 | III/IV | Unknown | Unknown | PD |
| CPB2 | SNV | Missense_Mutation | rs199530853 | c.232G>A | p.Asp78Asn | p.D78N | Q96IY4 | protein_coding | tolerated(0.69) | benign(0.003) | TCGA-DR-A0ZL-01 | Cervix | cervical & endocervical cancer | Female | <65 | I/II | Unknown | Unknown | SD |
| CPB2 | SNV | Missense_Mutation | c.1067N>A | p.Gly356Asp | p.G356D | Q96IY4 | protein_coding | deleterious(0) | probably_damaging(1) | TCGA-AA-3510-01 | Colorectum | colon adenocarcinoma | Male | >=65 | I/II | Unknown | Unknown | SD | |
| CPB2 | SNV | Missense_Mutation | rs770303867 | c.325N>A | p.Asp109Asn | p.D109N | Q96IY4 | protein_coding | tolerated(0.14) | benign(0.042) | TCGA-AA-A00N-01 | Colorectum | colon adenocarcinoma | Male | >=65 | I/II | Unknown | Unknown | PD |
| CPB2 | SNV | Missense_Mutation | c.1067G>A | p.Gly356Asp | p.G356D | Q96IY4 | protein_coding | deleterious(0) | probably_damaging(1) | TCGA-AA-A010-01 | Colorectum | colon adenocarcinoma | Female | <65 | I/II | Chemotherapy | folinic | CR | |
| CPB2 | SNV | Missense_Mutation | novel | c.491N>T | p.Ser164Phe | p.S164F | Q96IY4 | protein_coding | tolerated(0.06) | probably_damaging(0.997) | TCGA-CA-6717-01 | Colorectum | colon adenocarcinoma | Male | <65 | I/II | Chemotherapy | oxaliplatin | CR |
| Page: 1 2 3 4 5 6 |
Top |
Related drugs of malignant transformation related genes |
| Identification of chemicals and drugs interact with genes involved in malignant transfromation |
| (DGIdb 4.0) |
| Entrez ID | Symbol | Category | Interaction Types | Drug Claim Name | Drug Name | PMIDs |
| 1361 | CPB2 | DRUGGABLE GENOME, ENZYME, PROTEASE | UK-396082 | UK-396,082 | ||
| 1361 | CPB2 | DRUGGABLE GENOME, ENZYME, PROTEASE | inhibitor | 252166824 | ||
| 1361 | CPB2 | DRUGGABLE GENOME, ENZYME, PROTEASE | DS-1040 | |||
| 1361 | CPB2 | DRUGGABLE GENOME, ENZYME, PROTEASE | SAR-126119 | |||
| 1361 | CPB2 | DRUGGABLE GENOME, ENZYME, PROTEASE | inhibitor | 252166875 | ||
| 1361 | CPB2 | DRUGGABLE GENOME, ENZYME, PROTEASE | inhibitor | 252166857 | ||
| 1361 | CPB2 | DRUGGABLE GENOME, ENZYME, PROTEASE | inhibitor | 252166856 | ||
| 1361 | CPB2 | DRUGGABLE GENOME, ENZYME, PROTEASE | C5A | 14525995 | ||
| 1361 | CPB2 | DRUGGABLE GENOME, ENZYME, PROTEASE | SAR-104772 |
| Page: 1 |

Copyright 2023-Present -The University of Texas Health Science Center at Houston |