
|
|||||
|
 | |
| |
| |
| |
| |
| |
|
Gene: CCDC22 |
Gene summary for CCDC22 |
| Gene information | Species | Human | Gene symbol | CCDC22 | Gene ID | 28952 |
| Gene name | coiled-coil domain containing 22 | |
| Gene Alias | CXorf37 | |
| Cytomap | Xp11.23 | |
| Gene Type | protein-coding | GO ID | GO:0006139 | UniProtAcc | A0A024QZ03 |
Top |
Malignant transformation analysis |
| Identification of the aberrant gene expression in precancerous and cancerous lesions by comparing the gene expression of stem-like cells in diseased tissues with normal stem cells |
| Entrez ID | Symbol | Replicates | Species | Organ | Tissue | Adj P-value | Log2FC | Malignancy |
| 28952 | CCDC22 | LZE4T | Human | Esophagus | ESCC | 8.05e-03 | 1.33e-01 | 0.0811 |
| 28952 | CCDC22 | LZE7T | Human | Esophagus | ESCC | 4.68e-02 | 1.84e-01 | 0.0667 |
| 28952 | CCDC22 | LZE24T | Human | Esophagus | ESCC | 1.00e-06 | 1.27e-01 | 0.0596 |
| 28952 | CCDC22 | P1T-E | Human | Esophagus | ESCC | 1.52e-03 | 1.55e-01 | 0.0875 |
| 28952 | CCDC22 | P2T-E | Human | Esophagus | ESCC | 1.91e-11 | 2.73e-01 | 0.1177 |
| 28952 | CCDC22 | P4T-E | Human | Esophagus | ESCC | 2.86e-14 | 2.25e-01 | 0.1323 |
| 28952 | CCDC22 | P5T-E | Human | Esophagus | ESCC | 1.18e-05 | 1.20e-01 | 0.1327 |
| 28952 | CCDC22 | P8T-E | Human | Esophagus | ESCC | 2.63e-18 | 2.88e-01 | 0.0889 |
| 28952 | CCDC22 | P9T-E | Human | Esophagus | ESCC | 3.43e-08 | 1.60e-01 | 0.1131 |
| 28952 | CCDC22 | P10T-E | Human | Esophagus | ESCC | 9.82e-09 | 8.83e-02 | 0.116 |
| 28952 | CCDC22 | P11T-E | Human | Esophagus | ESCC | 9.39e-09 | 2.51e-01 | 0.1426 |
| 28952 | CCDC22 | P12T-E | Human | Esophagus | ESCC | 3.31e-12 | 2.04e-01 | 0.1122 |
| 28952 | CCDC22 | P15T-E | Human | Esophagus | ESCC | 1.06e-13 | 2.65e-01 | 0.1149 |
| 28952 | CCDC22 | P16T-E | Human | Esophagus | ESCC | 1.79e-17 | 1.70e-01 | 0.1153 |
| 28952 | CCDC22 | P17T-E | Human | Esophagus | ESCC | 1.27e-04 | 2.70e-01 | 0.1278 |
| 28952 | CCDC22 | P19T-E | Human | Esophagus | ESCC | 1.71e-05 | 3.76e-01 | 0.1662 |
| 28952 | CCDC22 | P20T-E | Human | Esophagus | ESCC | 4.23e-10 | 1.91e-01 | 0.1124 |
| 28952 | CCDC22 | P21T-E | Human | Esophagus | ESCC | 6.61e-12 | 1.92e-01 | 0.1617 |
| 28952 | CCDC22 | P22T-E | Human | Esophagus | ESCC | 2.06e-08 | 1.03e-01 | 0.1236 |
| 28952 | CCDC22 | P23T-E | Human | Esophagus | ESCC | 6.07e-20 | 4.68e-01 | 0.108 |
| Page: 1 2 3 4 |
| Tissue | Expression Dynamics | Abbreviation |
| Esophagus | 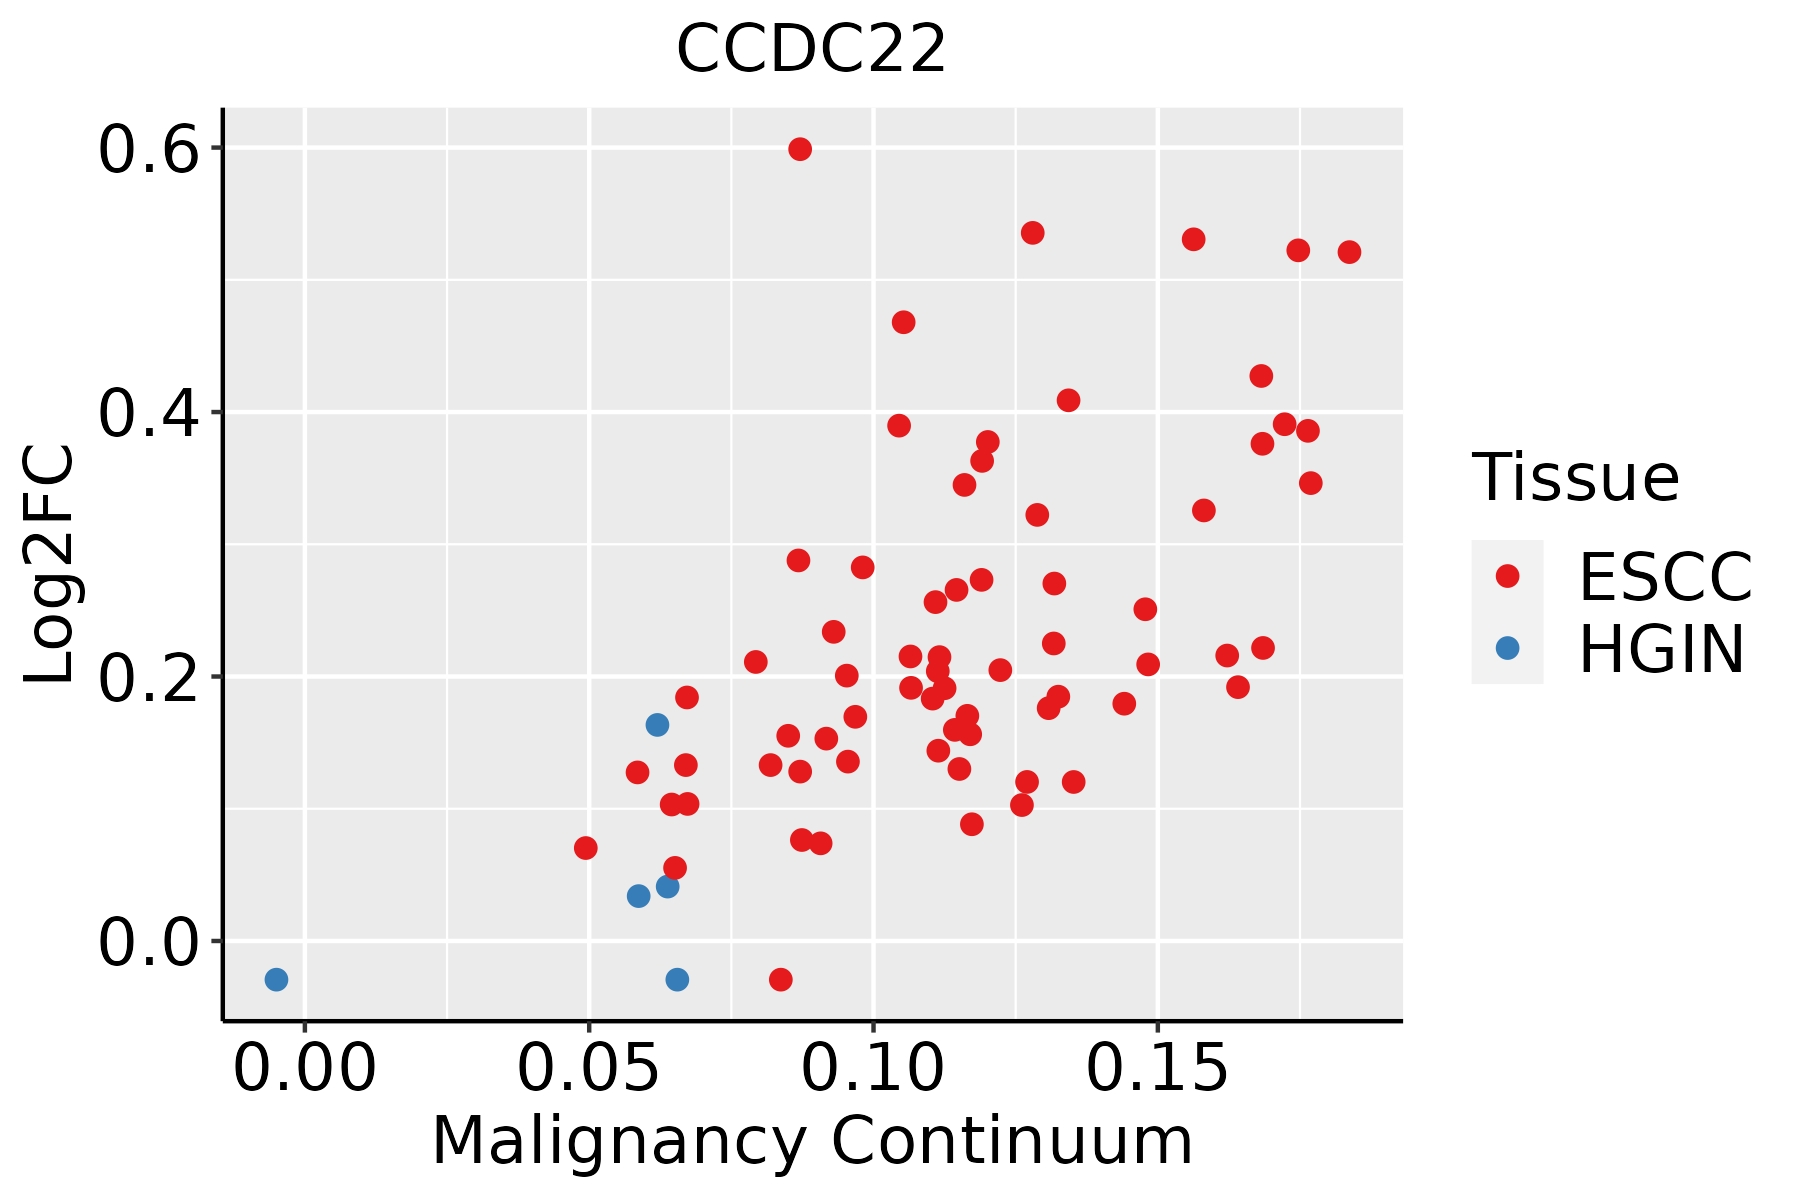 | ESCC: Esophageal squamous cell carcinoma |
| HGIN: High-grade intraepithelial neoplasias | ||
| LGIN: Low-grade intraepithelial neoplasias | ||
| Liver |  | HCC: Hepatocellular carcinoma |
| NAFLD: Non-alcoholic fatty liver disease | ||
| Oral Cavity | 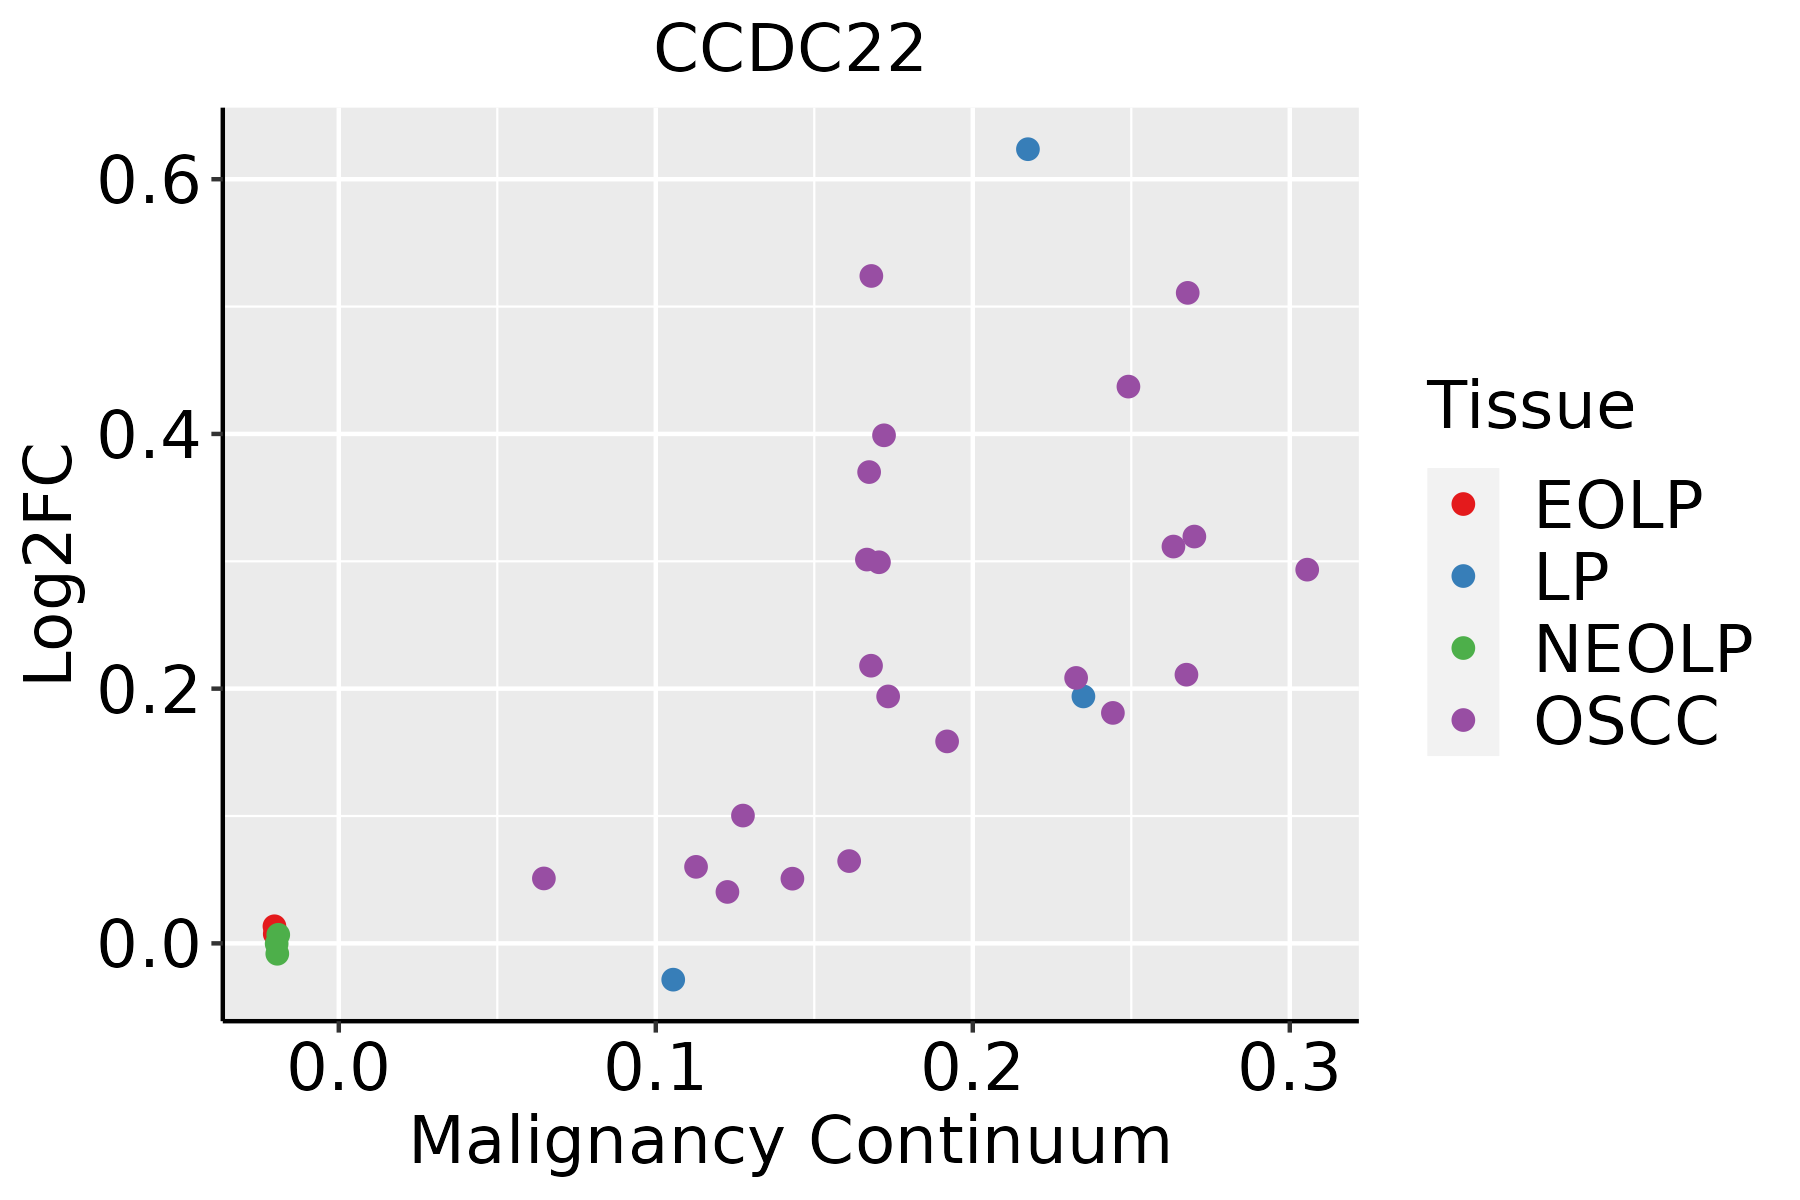 | EOLP: Erosive Oral lichen planus |
| LP: leukoplakia | ||
| NEOLP: Non-erosive oral lichen planus | ||
| OSCC: Oral squamous cell carcinoma |
| ∗log2FC in expression of this searched gene in stem-like cells from each diseased tissue sample relative to stem-like cells in normal samples in each tissue plotted against the malignancy continuum. Samples are colored based on if they are from different disease stage. |
Top |
Malignant transformation related pathway analysis |
| Find out the enriched GO biological processes and KEGG pathways involved in transition from healthy to precancer to cancer |
| Tissue | Disease Stage | Enriched GO biological Processes |
| Colorectum | AD |  |
| Colorectum | SER |  |
| Colorectum | MSS |  |
| Colorectum | MSI-H |  |
| Colorectum | FAP |  |
| ∗Top 15 enriched GO BP terms are showed in the bar plot of each disease state in each tissue. Each row represents a significant GO biological process which is colored according to the -log10(p.adjust). |
| Page: 1 2 3 4 5 6 7 8 9 |
| GO ID | Tissue | Disease Stage | Description | Gene Ratio | Bg Ratio | pvalue | p.adjust | Count |
| GO:0043433 | Oral cavity | LP | negative regulation of DNA-binding transcription factor activity | 61/4623 | 185/18723 | 6.68e-03 | 3.89e-02 | 61 |
| GO:005122012 | Oral cavity | LP | cytoplasmic sequestering of protein | 11/4623 | 22/18723 | 9.01e-03 | 4.83e-02 | 11 |
| Page: 1 2 3 4 5 6 7 8 |
| Pathway ID | Tissue | Disease Stage | Description | Gene Ratio | Bg Ratio | pvalue | p.adjust | qvalue | Count |
| Page: 1 |
Top |
Cell-cell communication analysis |
| Identification of potential cell-cell interactions between two cell types and their ligand-receptor pairs for different disease states |
| Ligand | Receptor | LRpair | Pathway | Tissue | Disease Stage |
| Page: 1 |
Top |
Single-cell gene regulatory network inference analysis |
| Find out the significant the regulons (TFs) and the target genes of each regulon across cell types for different disease states |
| TF | Cell Type | Tissue | Disease Stage | Target Gene | RSS | Regulon Activity |
| ∗The dot plots of a searched regulon are shown for all cell subpopulations in each disease state of each tissue based on the regulon specific score inferred using pySCENIC and by calculating the average expression. |
| Page: 1 |
Top |
Somatic mutation of malignant transformation related genes |
| Annotation of somatic variants for genes involved in malignant transformation |
| Hugo Symbol | Variant Class | Variant Classification | dbSNP RS | HGVSc | HGVSp | HGVSp Short | SWISSPROT | BIOTYPE | SIFT | PolyPhen | Tumor Sample Barcode | Tissue | Histology | Sex | Age | Stage | Therapy Types | Drugs | Outcome |
| CCDC22 | SNV | Missense_Mutation | novel | c.766N>A | p.Leu256Met | p.L256M | O60826 | protein_coding | deleterious(0.01) | probably_damaging(0.994) | TCGA-AC-A23H-01 | Breast | breast invasive carcinoma | Female | >=65 | I/II | Unknown | Unknown | PD |
| CCDC22 | SNV | Missense_Mutation | c.298N>G | p.Leu100Val | p.L100V | O60826 | protein_coding | tolerated(0.2) | benign(0.362) | TCGA-D8-A147-01 | Breast | breast invasive carcinoma | Female | <65 | I/II | Chemotherapy | doxorubicine | SD | |
| CCDC22 | SNV | Missense_Mutation | c.1713N>G | p.Ile571Met | p.I571M | O60826 | protein_coding | deleterious(0.05) | possibly_damaging(0.879) | TCGA-D8-A1JN-01 | Breast | breast invasive carcinoma | Female | >=65 | III/IV | Hormone Therapy | anastrozolum | SD | |
| CCDC22 | deletion | Frame_Shift_Del | novel | c.1641delC | p.Lys548ArgfsTer13 | p.K548Rfs*13 | O60826 | protein_coding | TCGA-D8-A27V-01 | Breast | breast invasive carcinoma | Female | <65 | I/II | Hormone Therapy | tamoxiphen | SD | ||
| CCDC22 | SNV | Missense_Mutation | novel | c.571N>A | p.Pro191Thr | p.P191T | O60826 | protein_coding | deleterious(0.01) | possibly_damaging(0.842) | TCGA-2W-A8YY-01 | Cervix | cervical & endocervical cancer | Female | <65 | I/II | Chemotherapy | cisplatin | CR |
| CCDC22 | SNV | Missense_Mutation | novel | c.605N>T | p.Arg202Met | p.R202M | O60826 | protein_coding | tolerated(0.19) | possibly_damaging(0.81) | TCGA-DS-A1OB-01 | Cervix | cervical & endocervical cancer | Female | <65 | I/II | Chemotherapy | carboplatin | PD |
| CCDC22 | SNV | Missense_Mutation | novel | c.1196N>C | p.Asn399Thr | p.N399T | O60826 | protein_coding | deleterious(0) | probably_damaging(0.999) | TCGA-DS-A1OB-01 | Cervix | cervical & endocervical cancer | Female | <65 | I/II | Chemotherapy | carboplatin | PD |
| CCDC22 | SNV | Missense_Mutation | c.1298N>A | p.Arg433His | p.R433H | O60826 | protein_coding | deleterious(0) | probably_damaging(0.993) | TCGA-EK-A2RB-01 | Cervix | cervical & endocervical cancer | Female | <65 | I/II | Unknown | Unknown | SD | |
| CCDC22 | SNV | Missense_Mutation | novel | c.419N>A | p.Leu140Gln | p.L140Q | O60826 | protein_coding | deleterious(0.04) | benign(0.235) | TCGA-VS-A8EJ-01 | Cervix | cervical & endocervical cancer | Female | <65 | I/II | Chemotherapy | cisplatin | PD |
| CCDC22 | insertion | Frame_Shift_Ins | novel | c.1194_1195insCACAG | p.Asn399HisfsTer81 | p.N399Hfs*81 | O60826 | protein_coding | TCGA-DS-A1OB-01 | Cervix | cervical & endocervical cancer | Female | <65 | I/II | Chemotherapy | carboplatin | PD |
| Page: 1 2 3 4 5 6 |
Top |
Related drugs of malignant transformation related genes |
| Identification of chemicals and drugs interact with genes involved in malignant transfromation |
| (DGIdb 4.0) |
| Entrez ID | Symbol | Category | Interaction Types | Drug Claim Name | Drug Name | PMIDs |
| Page: 1 |

Copyright 2023-Present -The University of Texas Health Science Center at Houston |