| Tissue | Expression Dynamics | Abbreviation |
| Cervix | 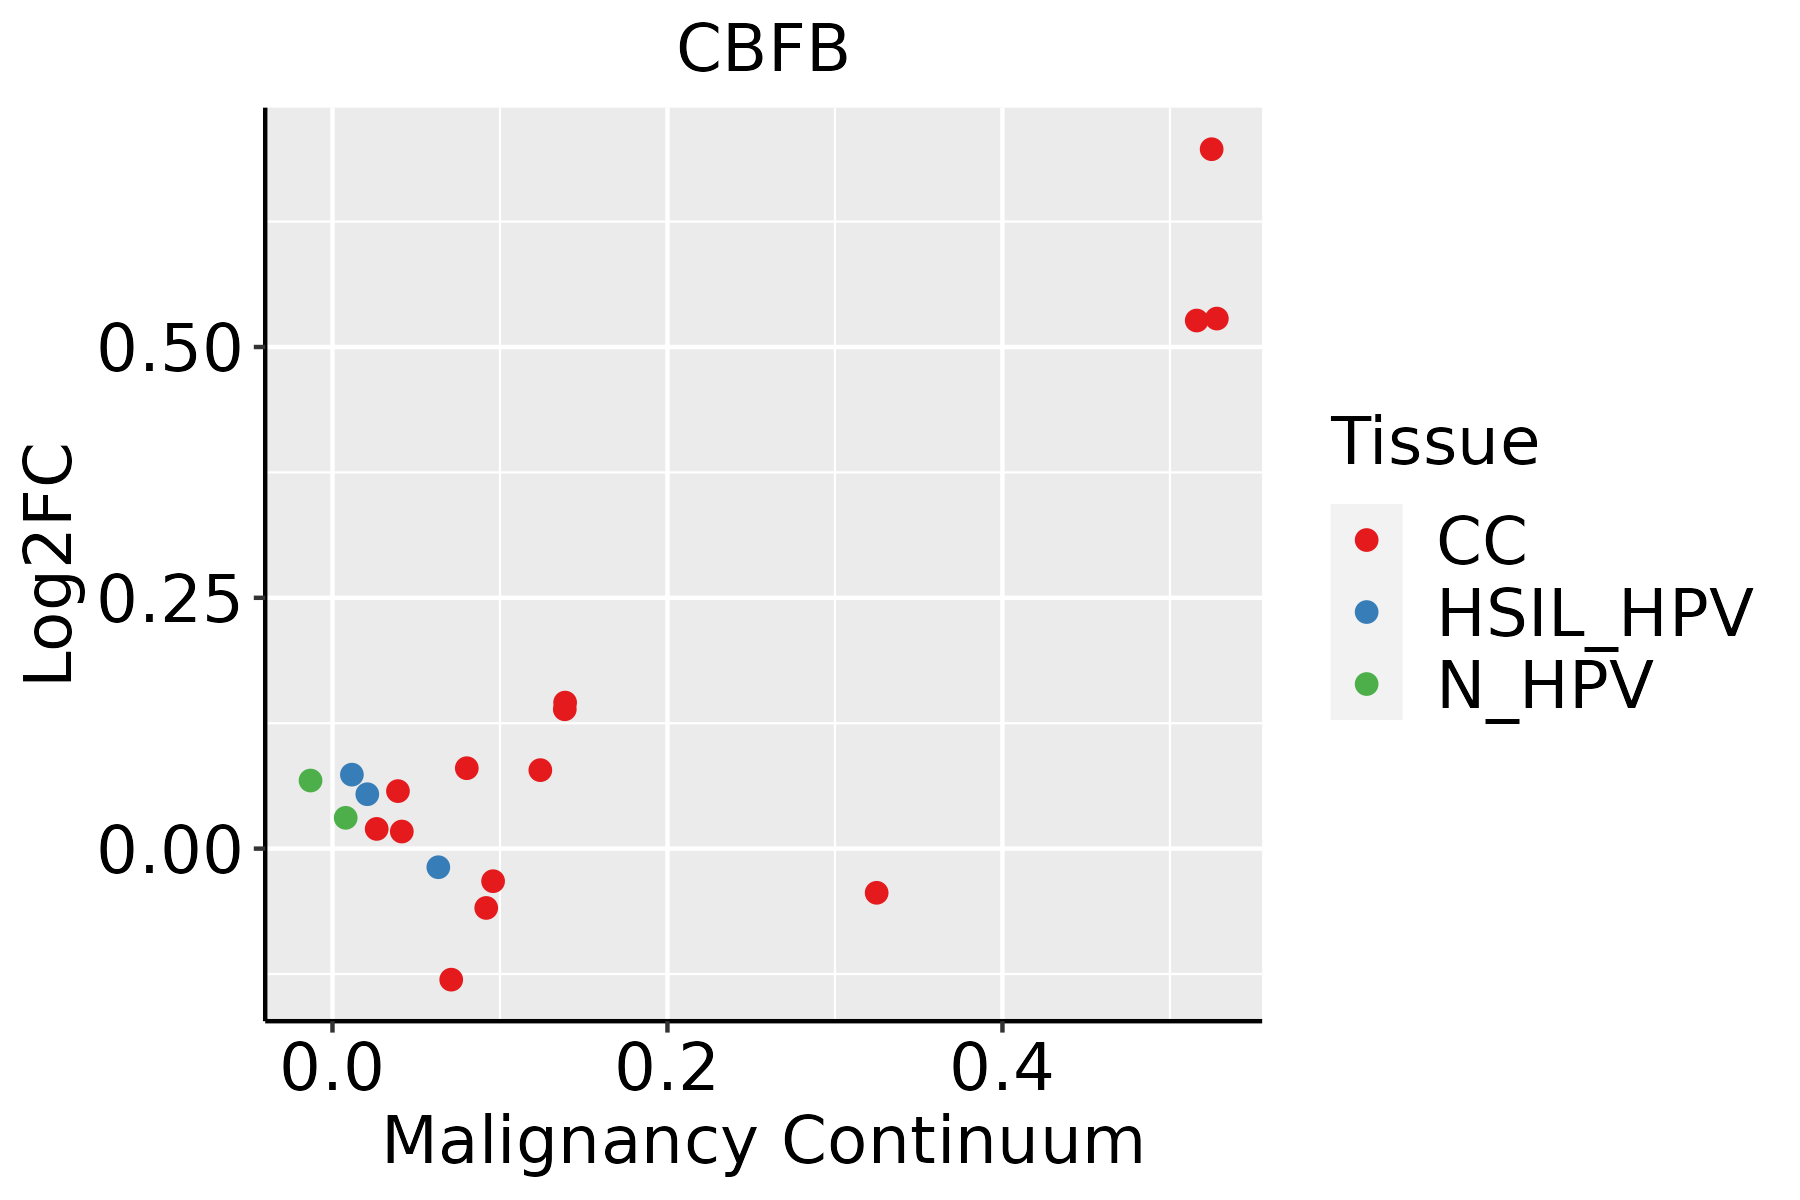 | CC: Cervix cancer |
| HSIL_HPV: HPV-infected high-grade squamous intraepithelial lesions |
| N_HPV: HPV-infected normal cervix |
| Esophagus |  | ESCC: Esophageal squamous cell carcinoma |
| HGIN: High-grade intraepithelial neoplasias |
| LGIN: Low-grade intraepithelial neoplasias |
| Liver |  | HCC: Hepatocellular carcinoma |
| NAFLD: Non-alcoholic fatty liver disease |
| Oral Cavity | 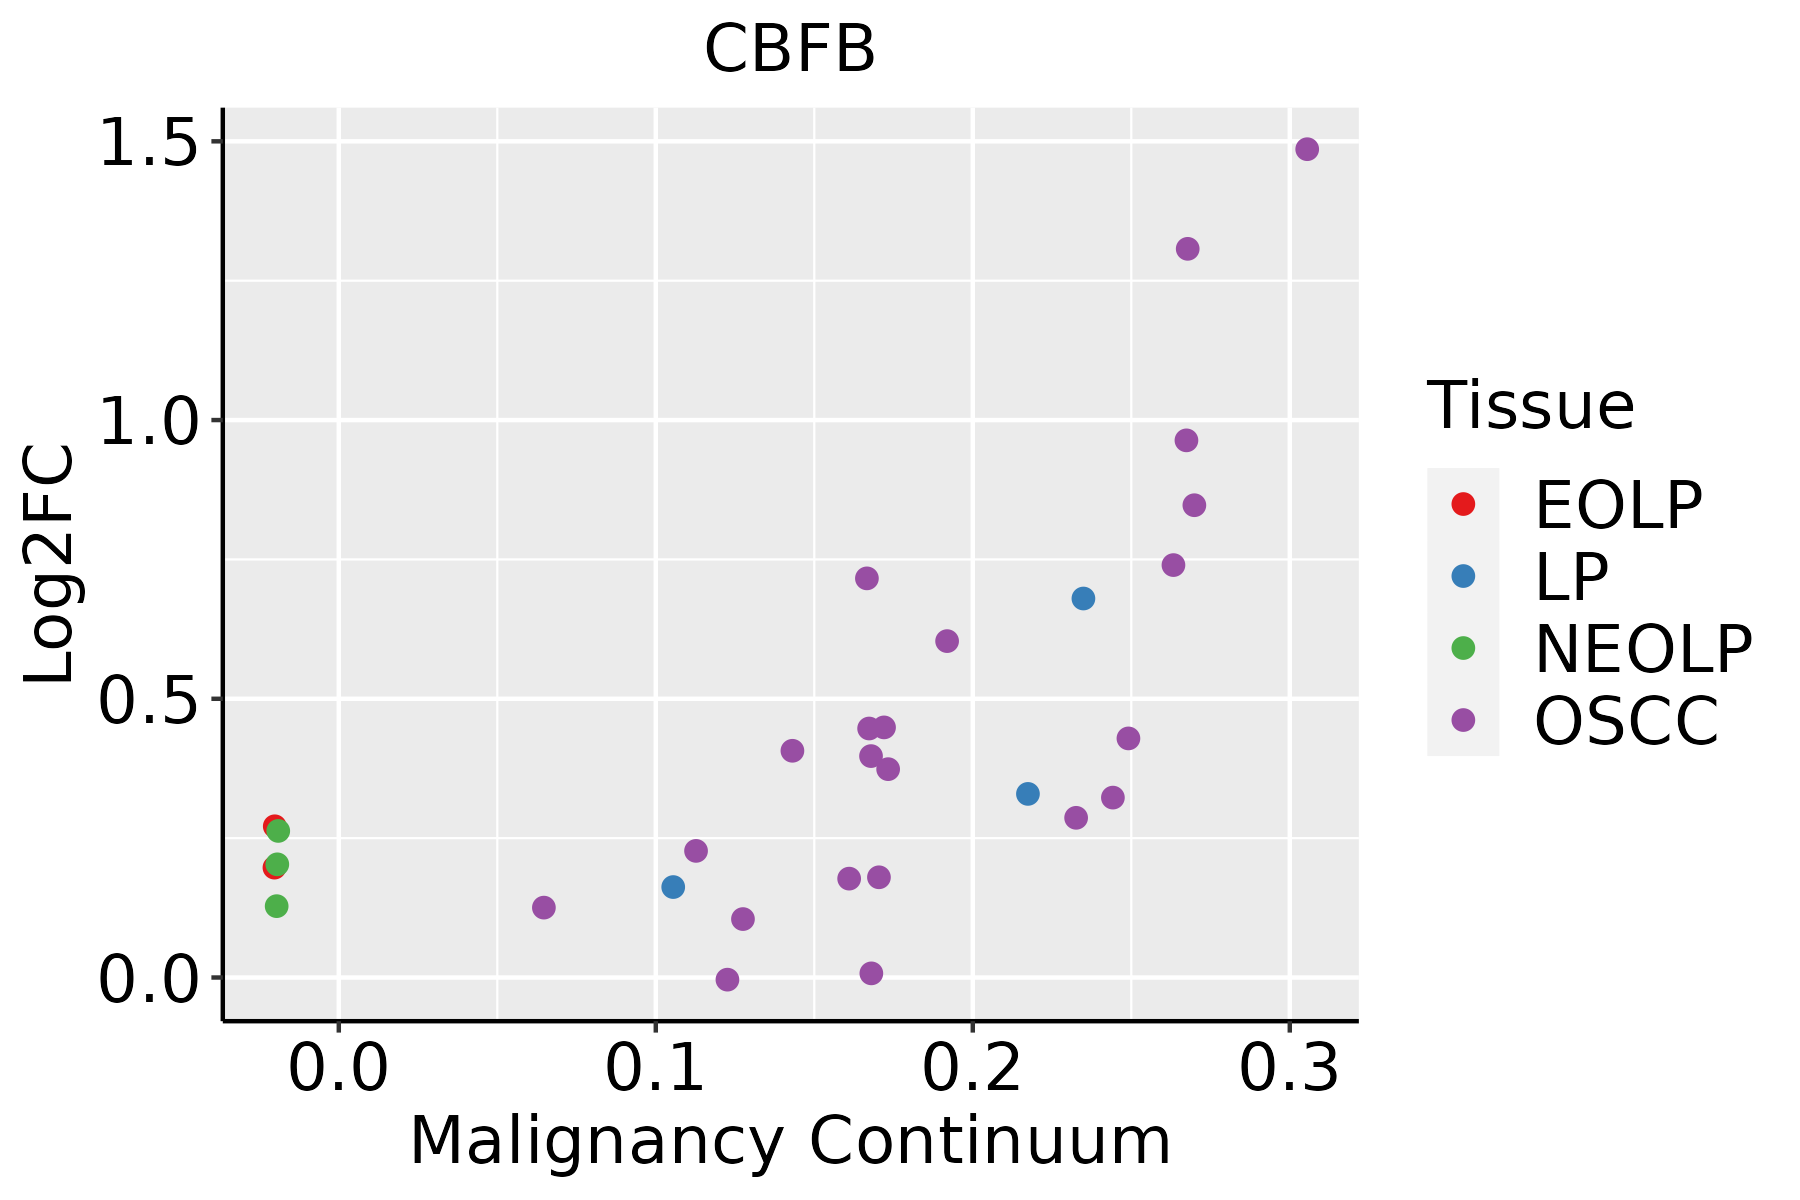 | EOLP: Erosive Oral lichen planus |
| LP: leukoplakia |
| NEOLP: Non-erosive oral lichen planus |
| OSCC: Oral squamous cell carcinoma |
| Skin |  | AK: Actinic keratosis |
| cSCC: Cutaneous squamous cell carcinoma |
| SCCIS:squamous cell carcinoma in situ |
| Thyroid | 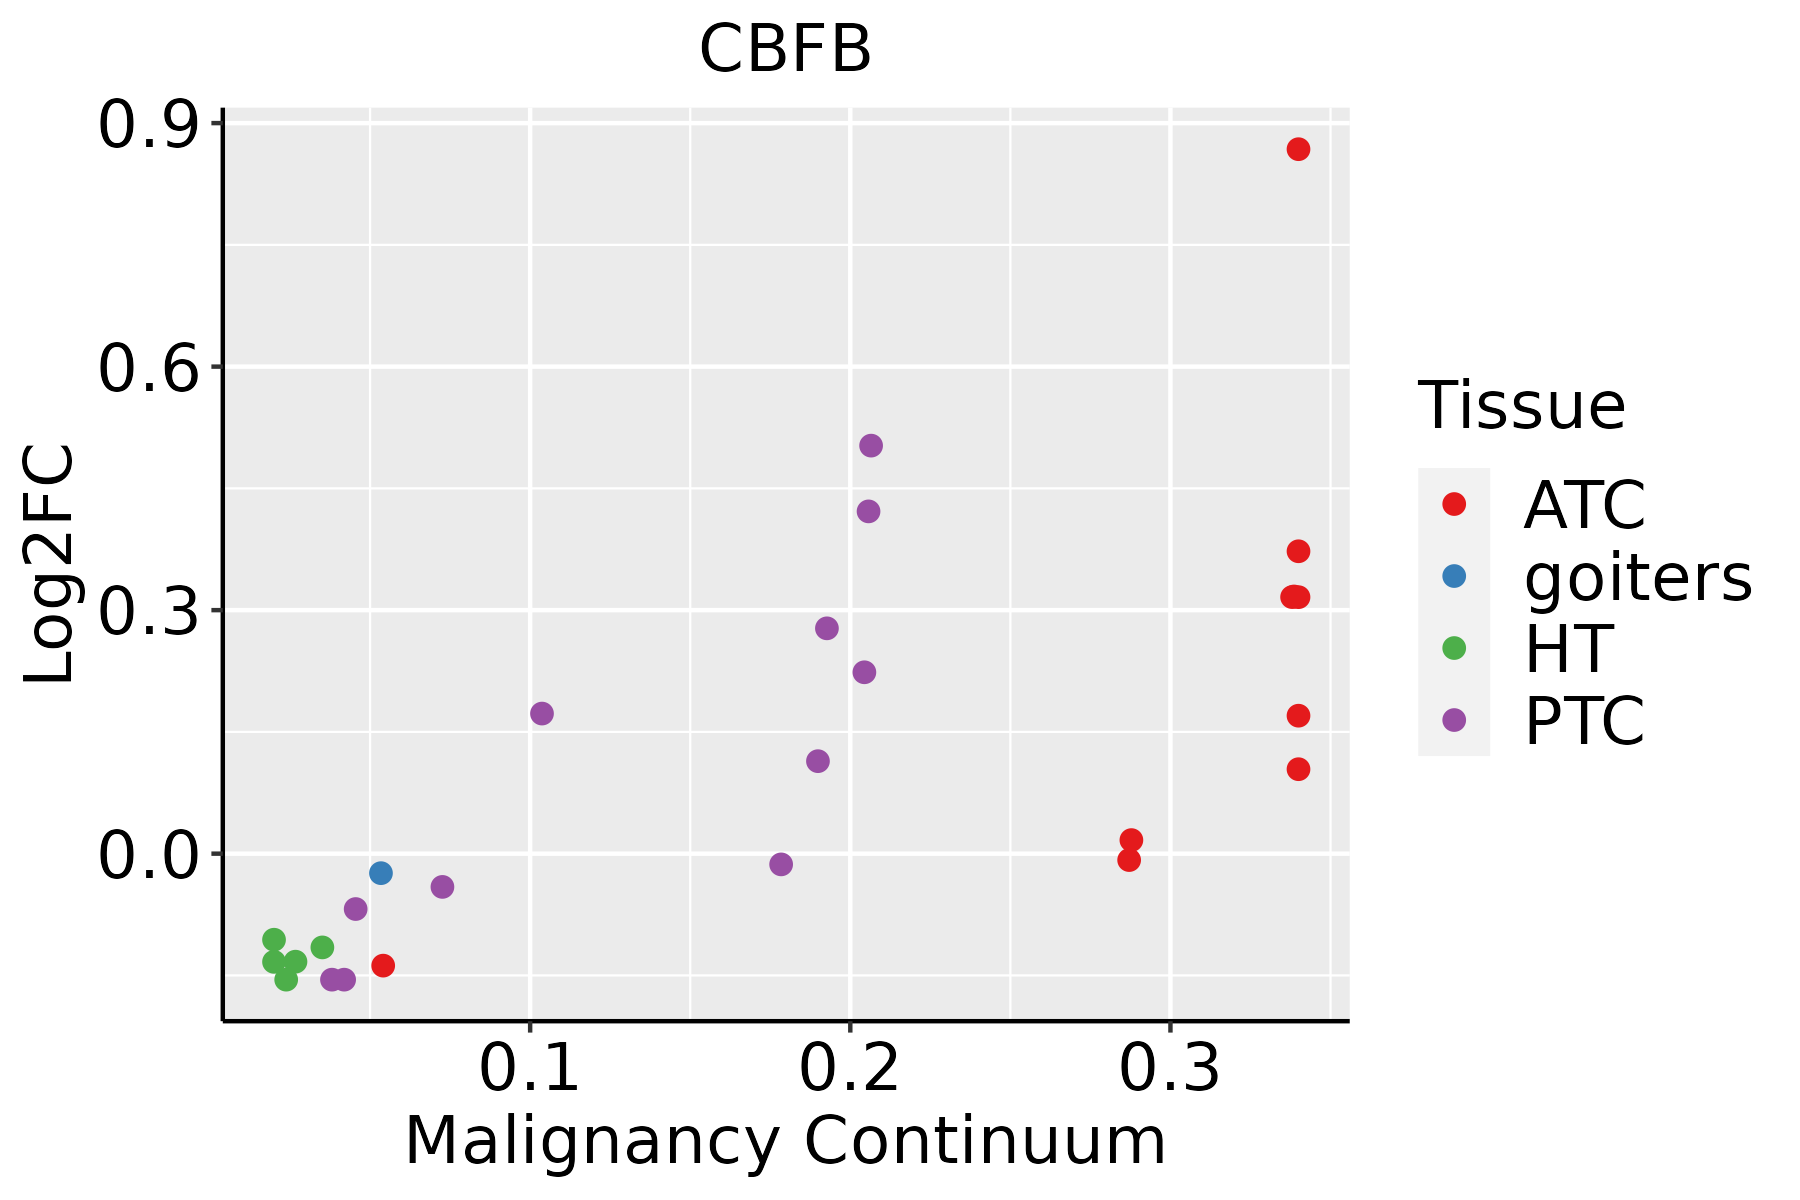 | ATC: Anaplastic thyroid cancer |
| HT: Hashimoto's thyroiditis |
| PTC: Papillary thyroid cancer |
| GO ID | Tissue | Disease Stage | Description | Gene Ratio | Bg Ratio | pvalue | p.adjust | Count |
| GO:190370813 | Oral cavity | EOLP | positive regulation of hemopoiesis | 34/2218 | 157/18723 | 3.32e-04 | 3.08e-03 | 34 |
| GO:00508681 | Oral cavity | EOLP | negative regulation of T cell activation | 28/2218 | 122/18723 | 4.03e-04 | 3.58e-03 | 28 |
| GO:0046638 | Oral cavity | EOLP | positive regulation of alpha-beta T cell differentiation | 15/2218 | 50/18723 | 4.75e-04 | 4.16e-03 | 15 |
| GO:000150322 | Oral cavity | EOLP | ossification | 70/2218 | 408/18723 | 8.89e-04 | 6.81e-03 | 70 |
| GO:0046636 | Oral cavity | EOLP | negative regulation of alpha-beta T cell activation | 13/2218 | 43/18723 | 1.03e-03 | 7.63e-03 | 13 |
| GO:00456203 | Oral cavity | EOLP | negative regulation of lymphocyte differentiation | 15/2218 | 55/18723 | 1.42e-03 | 9.62e-03 | 15 |
| GO:0046639 | Oral cavity | EOLP | negative regulation of alpha-beta T cell differentiation | 9/2218 | 26/18723 | 2.14e-03 | 1.34e-02 | 9 |
| GO:00456212 | Oral cavity | EOLP | positive regulation of lymphocyte differentiation | 23/2218 | 104/18723 | 2.14e-03 | 1.34e-02 | 23 |
| GO:00455811 | Oral cavity | EOLP | negative regulation of T cell differentiation | 13/2218 | 47/18723 | 2.52e-03 | 1.53e-02 | 13 |
| GO:0043371 | Oral cavity | EOLP | negative regulation of CD4-positive, alpha-beta T cell differentiation | 8/2218 | 22/18723 | 2.64e-03 | 1.59e-02 | 8 |
| GO:2000515 | Oral cavity | EOLP | negative regulation of CD4-positive, alpha-beta T cell activation | 10/2218 | 32/18723 | 2.93e-03 | 1.72e-02 | 10 |
| GO:0043374 | Oral cavity | EOLP | CD8-positive, alpha-beta T cell differentiation | 6/2218 | 14/18723 | 3.54e-03 | 2.01e-02 | 6 |
| GO:00455822 | Oral cavity | EOLP | positive regulation of T cell differentiation | 20/2218 | 91/18723 | 4.35e-03 | 2.37e-02 | 20 |
| GO:000164922 | Oral cavity | EOLP | osteoblast differentiation | 41/2218 | 229/18723 | 4.47e-03 | 2.42e-02 | 41 |
| GO:20011851 | Oral cavity | EOLP | regulation of CD8-positive, alpha-beta T cell activation | 7/2218 | 19/18723 | 4.48e-03 | 2.42e-02 | 7 |
| GO:0036037 | Oral cavity | EOLP | CD8-positive, alpha-beta T cell activation | 8/2218 | 27/18723 | 1.07e-02 | 4.75e-02 | 8 |
| GO:003009932 | Oral cavity | NEOLP | myeloid cell differentiation | 83/2005 | 381/18723 | 1.79e-10 | 1.69e-08 | 83 |
| GO:004578532 | Oral cavity | NEOLP | positive regulation of cell adhesion | 88/2005 | 437/18723 | 3.28e-09 | 1.95e-07 | 88 |
| GO:000150331 | Oral cavity | NEOLP | ossification | 81/2005 | 408/18723 | 2.67e-08 | 1.15e-06 | 81 |
| GO:000020931 | Oral cavity | NEOLP | protein polyubiquitination | 53/2005 | 236/18723 | 1.22e-07 | 4.38e-06 | 53 |
| Hugo Symbol | Variant Class | Variant Classification | dbSNP RS | HGVSc | HGVSp | HGVSp Short | SWISSPROT | BIOTYPE | SIFT | PolyPhen | Tumor Sample Barcode | Tissue | Histology | Sex | Age | Stage | Therapy Types | Drugs | Outcome |
| CBFB | SNV | Missense_Mutation | | c.394N>A | p.Ala132Thr | p.A132T | Q13951 | protein_coding | deleterious(0) | probably_damaging(0.989) | TCGA-A2-A0EO-01 | Breast | breast invasive carcinoma | Female | <65 | I/II | Hormone Therapy | tamoxiphen | SD |
| CBFB | SNV | Missense_Mutation | | c.201N>T | p.Gln67His | p.Q67H | Q13951 | protein_coding | tolerated(0.55) | probably_damaging(0.962) | TCGA-A8-A08S-01 | Breast | breast invasive carcinoma | Female | >=65 | I/II | Hormone Therapy | anastrozole | SD |
| CBFB | SNV | Missense_Mutation | novel | c.220N>A | p.Gln74Lys | p.Q74K | Q13951 | protein_coding | tolerated(0.74) | benign(0.031) | TCGA-A8-A08T-01 | Breast | breast invasive carcinoma | Female | <65 | III/IV | Unknown | Unknown | PD |
| CBFB | SNV | Missense_Mutation | | c.362N>A | p.Gly121Asp | p.G121D | Q13951 | protein_coding | deleterious(0) | probably_damaging(0.998) | TCGA-A8-A096-01 | Breast | breast invasive carcinoma | Female | >=65 | I/II | Unknown | Unknown | SD |
| CBFB | SNV | Missense_Mutation | | c.188A>T | p.Asn63Ile | p.N63I | Q13951 | protein_coding | deleterious(0) | probably_damaging(0.994) | TCGA-AC-A3QQ-01 | Breast | breast invasive carcinoma | Female | <65 | I/II | Unknown | Unknown | SD |
| CBFB | SNV | Missense_Mutation | | c.296N>T | p.Ala99Val | p.A99V | Q13951 | protein_coding | tolerated(0.16) | probably_damaging(0.961) | TCGA-B6-A0RN-01 | Breast | breast invasive carcinoma | Female | <65 | I/II | Unknown | Unknown | SD |
| CBFB | SNV | Missense_Mutation | | c.311N>G | p.Asn104Ser | p.N104S | Q13951 | protein_coding | deleterious(0) | possibly_damaging(0.819) | TCGA-BH-A0EA-01 | Breast | breast invasive carcinoma | Female | >=65 | I/II | Chemotherapy | taxotere | CR |
| CBFB | SNV | Missense_Mutation | | c.306N>G | p.Ile102Met | p.I102M | Q13951 | protein_coding | deleterious(0) | probably_damaging(0.944) | TCGA-BH-A1FL-01 | Breast | breast invasive carcinoma | Female | >=65 | I/II | Unknown | Unknown | PD |
| CBFB | SNV | Missense_Mutation | | c.104N>C | p.Arg35Pro | p.R35P | Q13951 | protein_coding | deleterious(0) | benign(0.01) | TCGA-E2-A15C-01 | Breast | breast invasive carcinoma | Female | <65 | I/II | Hormone Therapy | arimidex | SD |
| CBFB | SNV | Missense_Mutation | | c.167N>G | p.Ala56Gly | p.A56G | Q13951 | protein_coding | deleterious(0.01) | probably_damaging(0.966) | TCGA-E2-A1L9-01 | Breast | breast invasive carcinoma | Female | <65 | I/II | Chemotherapy | cytoxan | SD |
| Entrez ID | Symbol | Category | Interaction Types | Drug Claim Name | Drug Name | PMIDs |
| 865 | CBFB | CLINICALLY ACTIONABLE, TRANSCRIPTION FACTOR | | CYTARABINE HYDROCHLORIDE | CYTARABINE HYDROCHLORIDE | |
| 865 | CBFB | CLINICALLY ACTIONABLE, TRANSCRIPTION FACTOR | | PURPUROGALLIN | PURPUROGALLIN | |
| 865 | CBFB | CLINICALLY ACTIONABLE, TRANSCRIPTION FACTOR | | PHENANTHROLINE | PHENANTHROLINE | |
| 865 | CBFB | CLINICALLY ACTIONABLE, TRANSCRIPTION FACTOR | | CY-208243 | CHEMBL313737 | |
| 865 | CBFB | CLINICALLY ACTIONABLE, TRANSCRIPTION FACTOR | | FUSARIC ACID | FUSARIC ACID | |
| 865 | CBFB | CLINICALLY ACTIONABLE, TRANSCRIPTION FACTOR | | PYROGALLOL | PYROGALLOL | |
| 865 | CBFB | CLINICALLY ACTIONABLE, TRANSCRIPTION FACTOR | | APOMORPHINE HYDROCHLORIDE HEMIHYDRATE | APOMORPHINE HYDROCHLORIDE HEMIHYDRATE | |
| 865 | CBFB | CLINICALLY ACTIONABLE, TRANSCRIPTION FACTOR | | QUINOLINIC ACID | QUINOLINIC ACID | |
| 865 | CBFB | CLINICALLY ACTIONABLE, TRANSCRIPTION FACTOR | | L-NOREPINEPHRINE | L-NOREPINEPHRINE | |
| 865 | CBFB | CLINICALLY ACTIONABLE, TRANSCRIPTION FACTOR | | IRIGINOL HEXAACEATATE | IRIGINOL HEXAACEATATE | |


