
|
|||||
|
 | |
| |
| |
| |
| |
| |
|
Gene: CAPZA1 |
Gene summary for CAPZA1 |
| Gene information | Species | Human | Gene symbol | CAPZA1 | Gene ID | 829 |
| Gene name | capping actin protein of muscle Z-line subunit alpha 1 | |
| Gene Alias | CAPPA1 | |
| Cytomap | 1p13.2 | |
| Gene Type | protein-coding | GO ID | GO:0006996 | UniProtAcc | A0A024R0E5 |
Top |
Malignant transformation analysis |
| Identification of the aberrant gene expression in precancerous and cancerous lesions by comparing the gene expression of stem-like cells in diseased tissues with normal stem cells |
| Entrez ID | Symbol | Replicates | Species | Organ | Tissue | Adj P-value | Log2FC | Malignancy |
| 829 | CAPZA1 | HTA11_3410_2000001011 | Human | Colorectum | AD | 8.07e-04 | -3.74e-01 | 0.0155 |
| 829 | CAPZA1 | HTA11_347_2000001011 | Human | Colorectum | AD | 1.26e-06 | 4.46e-01 | -0.1954 |
| 829 | CAPZA1 | HTA11_99999970781_79442 | Human | Colorectum | MSS | 4.17e-03 | 5.66e-01 | 0.294 |
| 829 | CAPZA1 | A002-C-010 | Human | Colorectum | FAP | 9.33e-05 | -1.56e-01 | 0.242 |
| 829 | CAPZA1 | A015-C-203 | Human | Colorectum | FAP | 2.50e-24 | -3.83e-01 | -0.1294 |
| 829 | CAPZA1 | A015-C-204 | Human | Colorectum | FAP | 3.95e-04 | -2.56e-01 | -0.0228 |
| 829 | CAPZA1 | A014-C-040 | Human | Colorectum | FAP | 1.60e-03 | -4.81e-01 | -0.1184 |
| 829 | CAPZA1 | A002-C-201 | Human | Colorectum | FAP | 9.48e-09 | -3.43e-01 | 0.0324 |
| 829 | CAPZA1 | A002-C-203 | Human | Colorectum | FAP | 5.34e-06 | -2.04e-01 | 0.2786 |
| 829 | CAPZA1 | A001-C-119 | Human | Colorectum | FAP | 1.77e-06 | -4.40e-01 | -0.1557 |
| 829 | CAPZA1 | A001-C-108 | Human | Colorectum | FAP | 5.85e-20 | -3.00e-01 | -0.0272 |
| 829 | CAPZA1 | A002-C-205 | Human | Colorectum | FAP | 2.62e-14 | -3.93e-01 | -0.1236 |
| 829 | CAPZA1 | A001-C-104 | Human | Colorectum | FAP | 4.85e-03 | -2.08e-01 | 0.0184 |
| 829 | CAPZA1 | A015-C-005 | Human | Colorectum | FAP | 1.75e-02 | -2.94e-01 | -0.0336 |
| 829 | CAPZA1 | A015-C-006 | Human | Colorectum | FAP | 3.43e-11 | -4.60e-01 | -0.0994 |
| 829 | CAPZA1 | A015-C-106 | Human | Colorectum | FAP | 2.32e-16 | -3.28e-01 | -0.0511 |
| 829 | CAPZA1 | A002-C-114 | Human | Colorectum | FAP | 1.58e-12 | -4.24e-01 | -0.1561 |
| 829 | CAPZA1 | A015-C-104 | Human | Colorectum | FAP | 4.29e-26 | -4.17e-01 | -0.1899 |
| 829 | CAPZA1 | A001-C-014 | Human | Colorectum | FAP | 9.99e-15 | -2.69e-01 | 0.0135 |
| 829 | CAPZA1 | A002-C-016 | Human | Colorectum | FAP | 5.55e-20 | -3.67e-01 | 0.0521 |
| Page: 1 2 3 4 5 6 7 8 9 |
| Tissue | Expression Dynamics | Abbreviation |
| Colorectum (GSE201348) |  | FAP: Familial adenomatous polyposis |
| CRC: Colorectal cancer | ||
| Colorectum (HTA11) |  | AD: Adenomas |
| SER: Sessile serrated lesions | ||
| MSI-H: Microsatellite-high colorectal cancer | ||
| MSS: Microsatellite stable colorectal cancer | ||
| Esophagus | 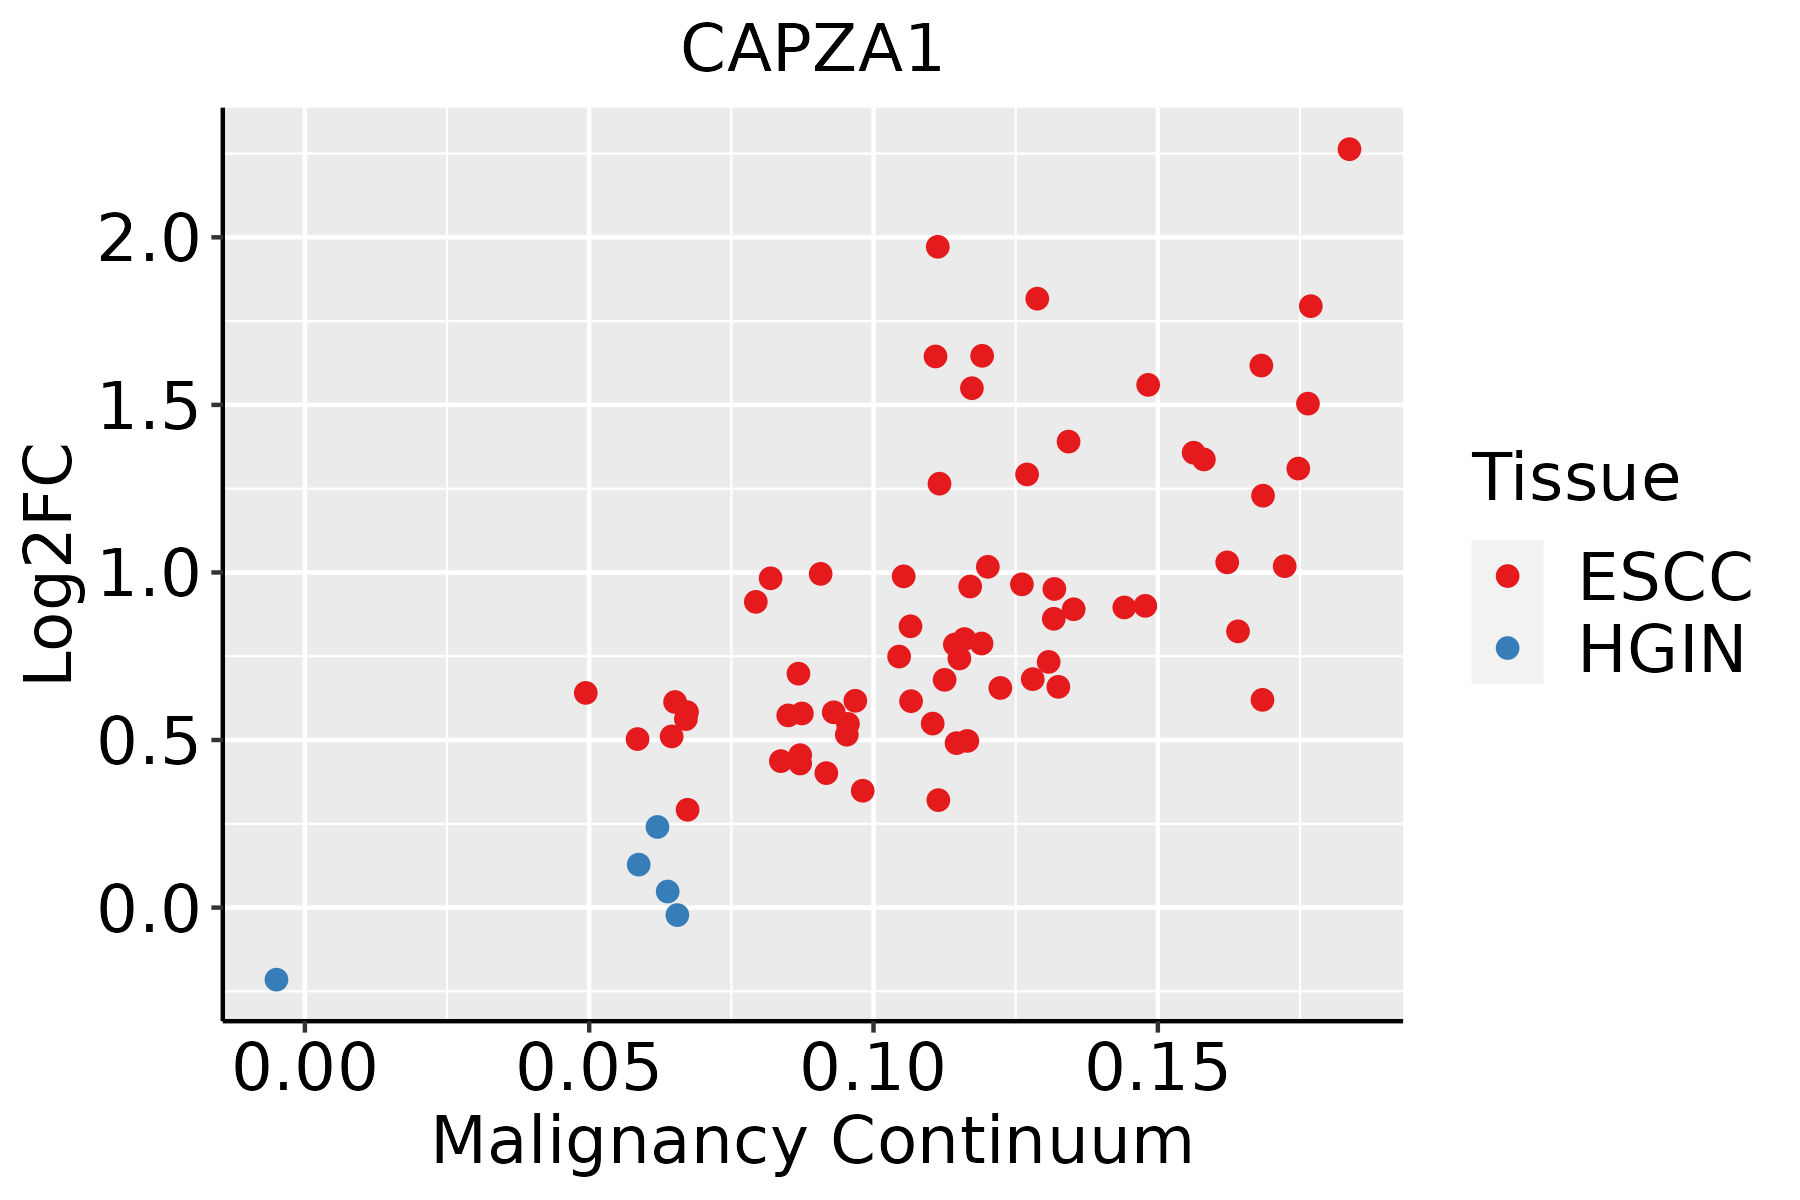 | ESCC: Esophageal squamous cell carcinoma |
| HGIN: High-grade intraepithelial neoplasias | ||
| LGIN: Low-grade intraepithelial neoplasias | ||
| Liver | 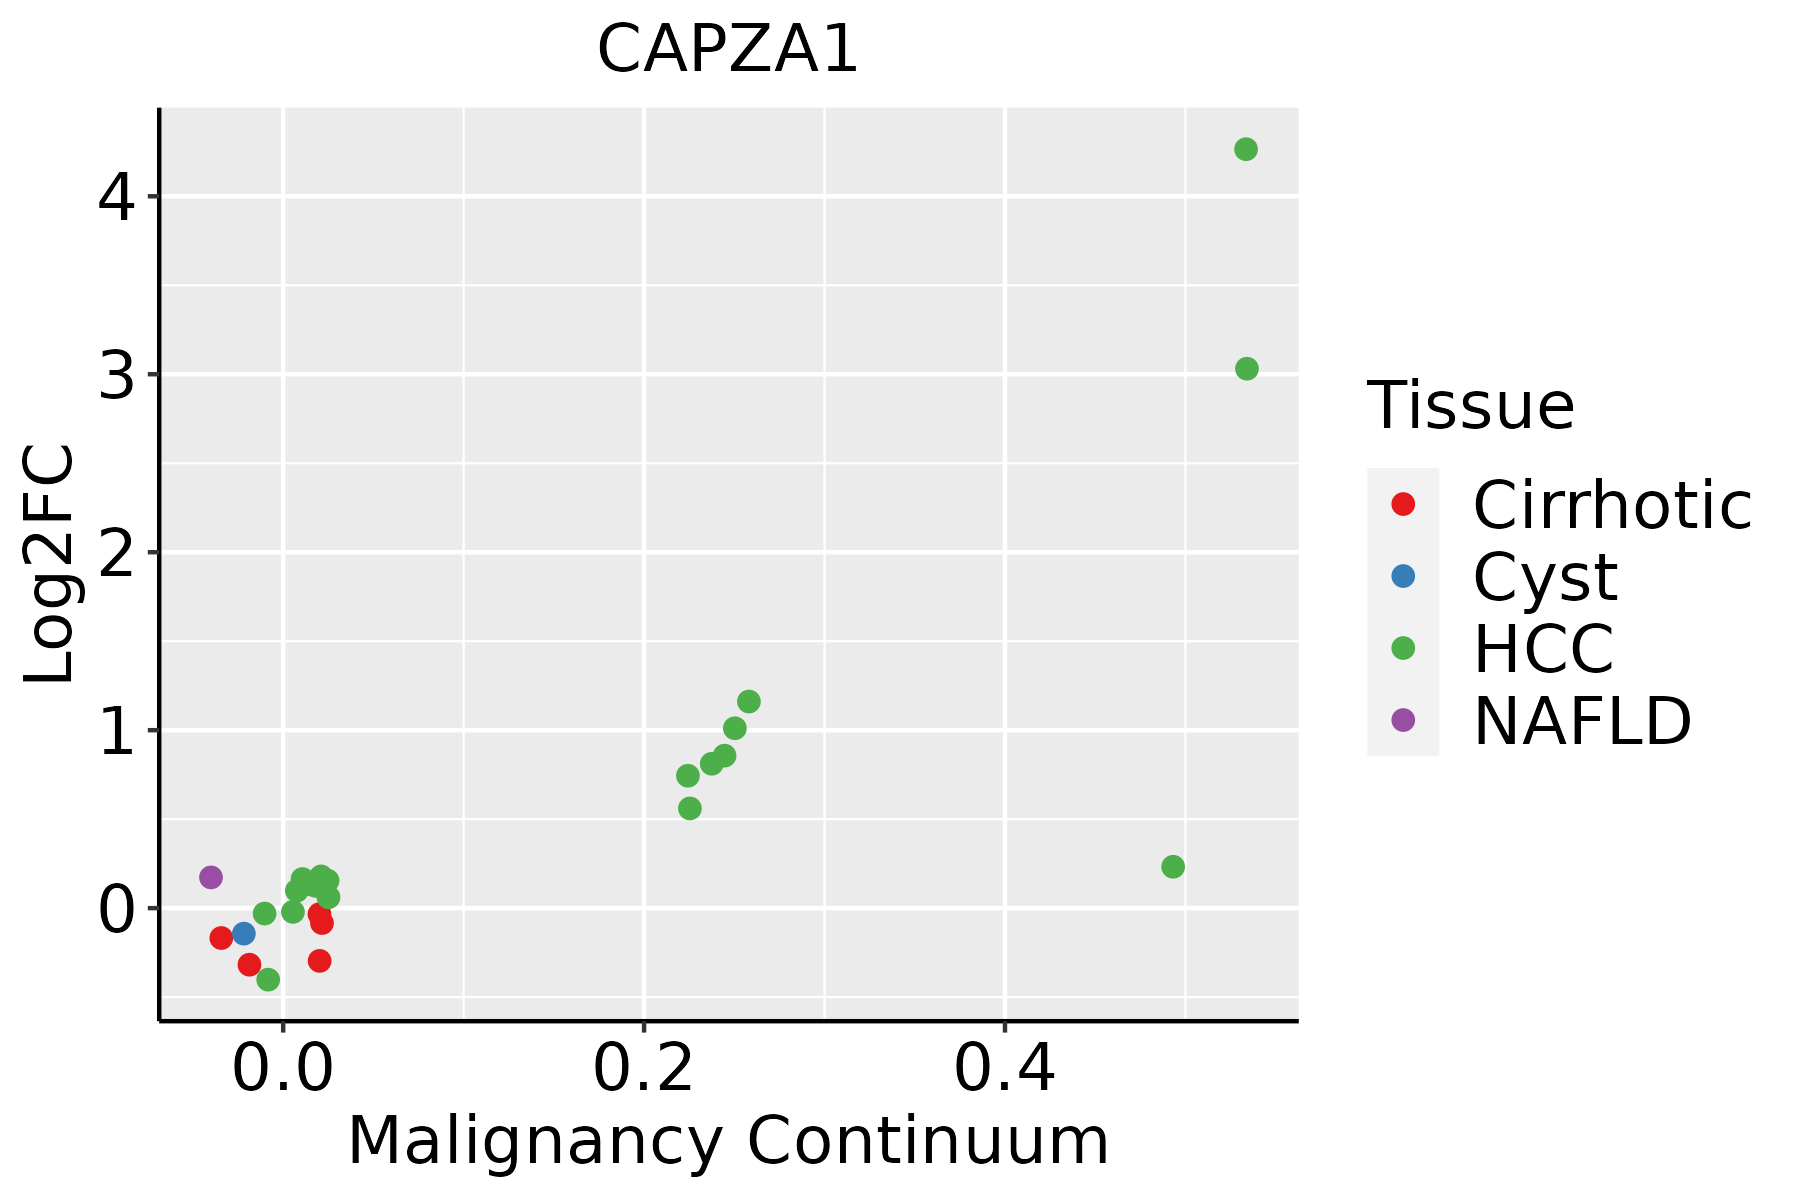 | HCC: Hepatocellular carcinoma |
| NAFLD: Non-alcoholic fatty liver disease | ||
| Lung |  | AAH: Atypical adenomatous hyperplasia |
| AIS: Adenocarcinoma in situ | ||
| IAC: Invasive lung adenocarcinoma | ||
| MIA: Minimally invasive adenocarcinoma | ||
| Oral Cavity | 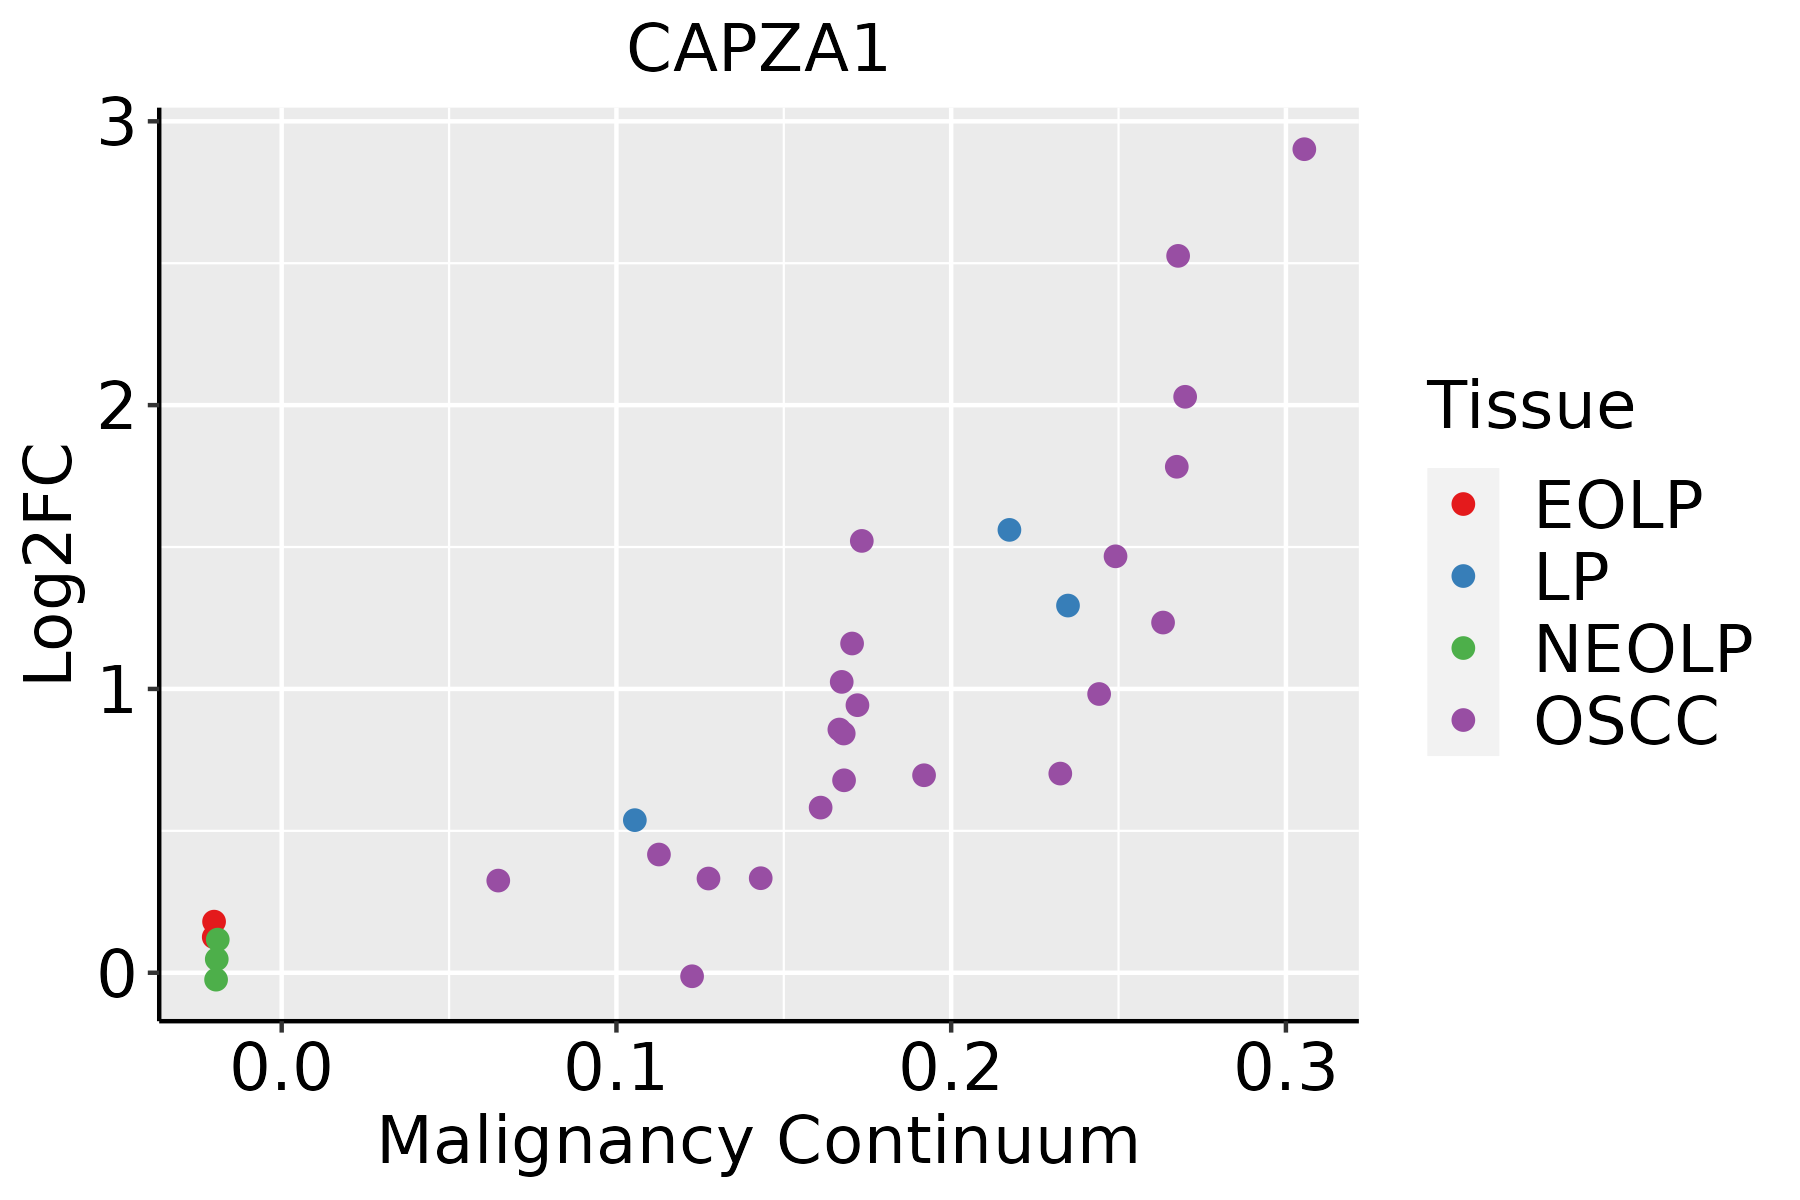 | EOLP: Erosive Oral lichen planus |
| LP: leukoplakia | ||
| NEOLP: Non-erosive oral lichen planus | ||
| OSCC: Oral squamous cell carcinoma | ||
| Skin |  | AK: Actinic keratosis |
| cSCC: Cutaneous squamous cell carcinoma | ||
| SCCIS:squamous cell carcinoma in situ | ||
| Thyroid | 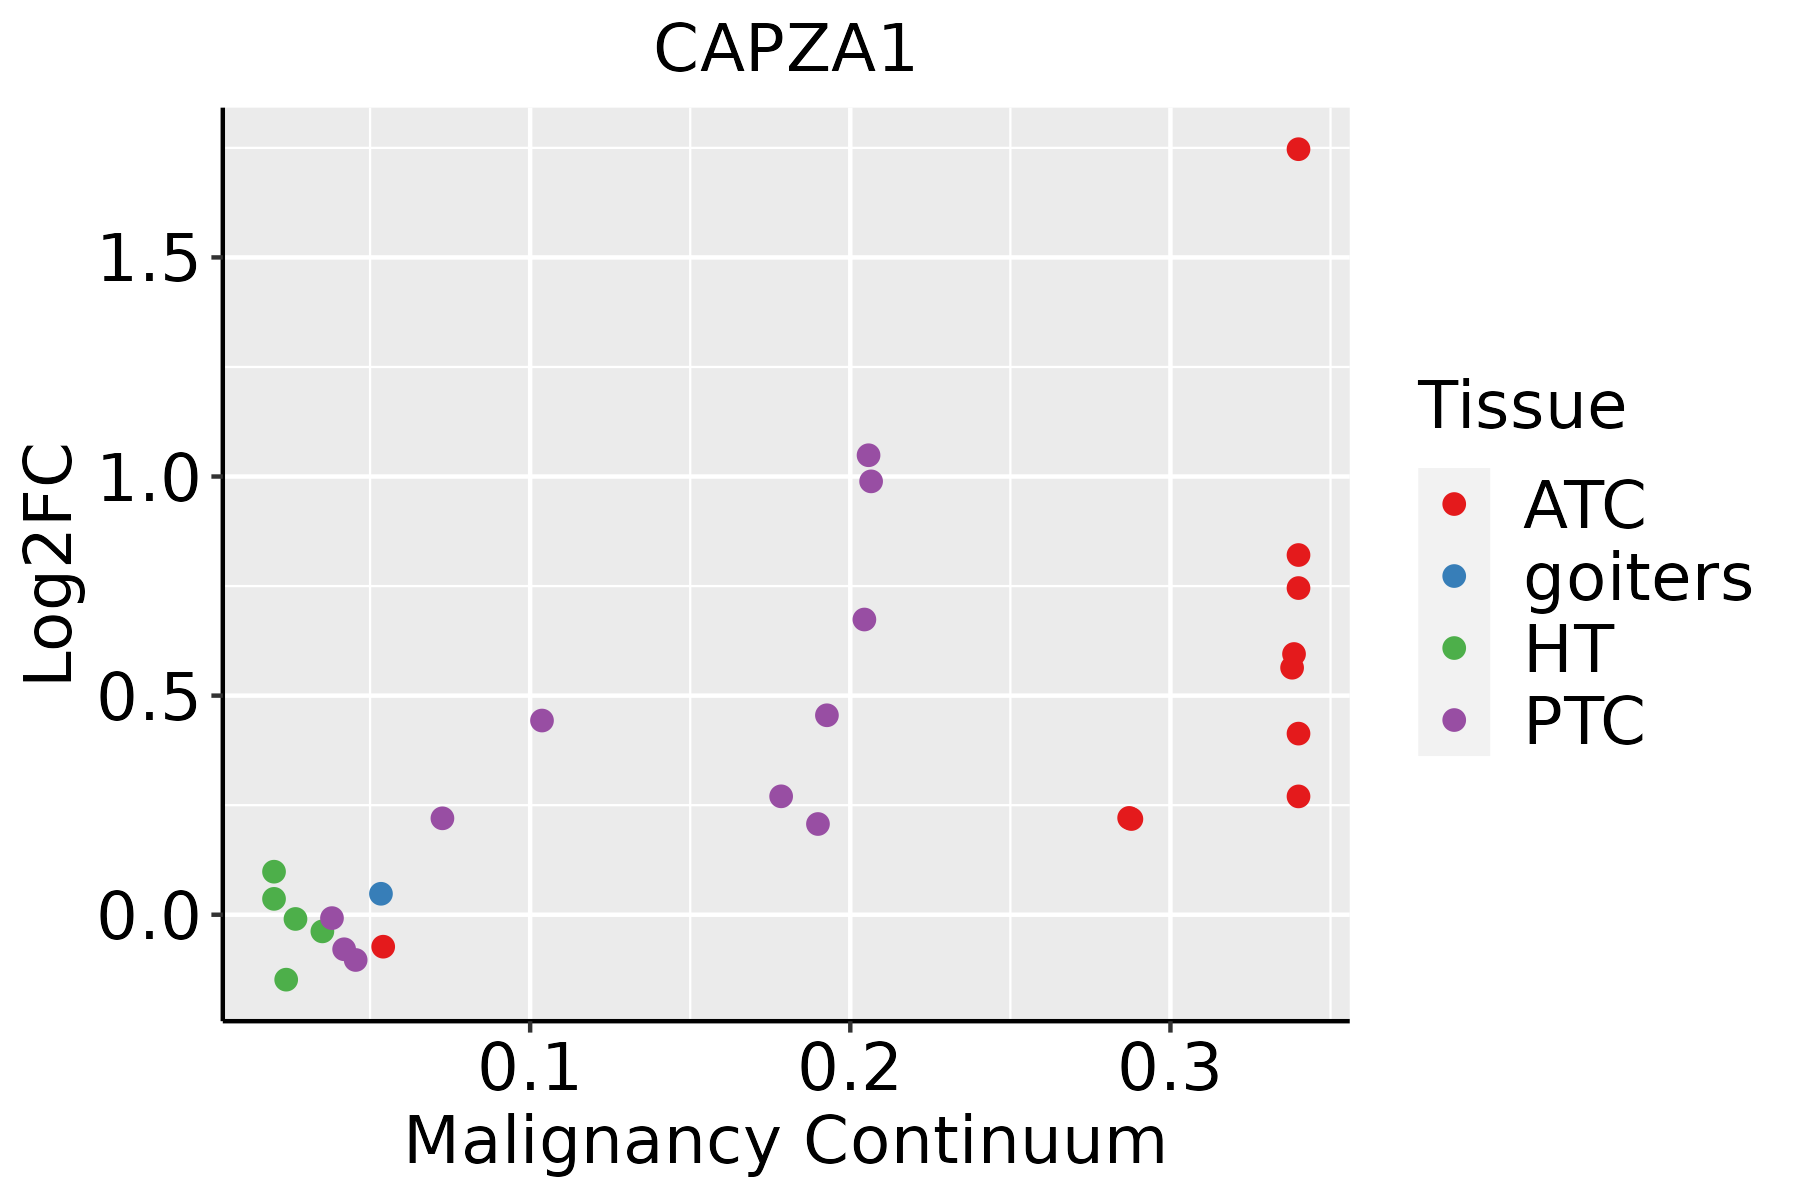 | ATC: Anaplastic thyroid cancer |
| HT: Hashimoto's thyroiditis | ||
| PTC: Papillary thyroid cancer |
| ∗log2FC in expression of this searched gene in stem-like cells from each diseased tissue sample relative to stem-like cells in normal samples in each tissue plotted against the malignancy continuum. Samples are colored based on if they are from different disease stage. |
Top |
Malignant transformation related pathway analysis |
| Find out the enriched GO biological processes and KEGG pathways involved in transition from healthy to precancer to cancer |
| Tissue | Disease Stage | Enriched GO biological Processes |
| Colorectum | AD |  |
| Colorectum | SER |  |
| Colorectum | MSS |  |
| Colorectum | MSI-H |  |
| Colorectum | FAP |  |
| ∗Top 15 enriched GO BP terms are showed in the bar plot of each disease state in each tissue. Each row represents a significant GO biological process which is colored according to the -log10(p.adjust). |
| Page: 1 2 3 4 5 6 7 8 9 |
| GO ID | Tissue | Disease Stage | Description | Gene Ratio | Bg Ratio | pvalue | p.adjust | Count |
| GO:000701527 | Esophagus | ESCC | actin filament organization | 259/8552 | 442/18723 | 2.37e-08 | 4.50e-07 | 259 |
| GO:003253520 | Esophagus | ESCC | regulation of cellular component size | 227/8552 | 383/18723 | 4.77e-08 | 8.60e-07 | 227 |
| GO:0032970111 | Esophagus | ESCC | regulation of actin filament-based process | 231/8552 | 397/18723 | 2.91e-07 | 4.20e-06 | 231 |
| GO:0032956111 | Esophagus | ESCC | regulation of actin cytoskeleton organization | 210/8552 | 358/18723 | 4.40e-07 | 6.00e-06 | 210 |
| GO:0032271111 | Esophagus | ESCC | regulation of protein polymerization | 143/8552 | 233/18723 | 9.21e-07 | 1.17e-05 | 143 |
| GO:011005327 | Esophagus | ESCC | regulation of actin filament organization | 166/8552 | 278/18723 | 1.54e-06 | 1.85e-05 | 166 |
| GO:000815420 | Esophagus | ESCC | actin polymerization or depolymerization | 130/8552 | 218/18723 | 2.19e-05 | 1.88e-04 | 130 |
| GO:0030041110 | Esophagus | ESCC | actin filament polymerization | 114/8552 | 191/18723 | 6.46e-05 | 4.92e-04 | 114 |
| GO:000806419 | Esophagus | ESCC | regulation of actin polymerization or depolymerization | 112/8552 | 188/18723 | 8.31e-05 | 6.06e-04 | 112 |
| GO:003083218 | Esophagus | ESCC | regulation of actin filament length | 112/8552 | 189/18723 | 1.13e-04 | 7.85e-04 | 112 |
| GO:003083320 | Esophagus | ESCC | regulation of actin filament polymerization | 103/8552 | 172/18723 | 1.19e-04 | 8.15e-04 | 103 |
| GO:0031333110 | Esophagus | ESCC | negative regulation of protein-containing complex assembly | 86/8552 | 141/18723 | 1.74e-04 | 1.14e-03 | 86 |
| GO:00432446 | Esophagus | ESCC | regulation of protein-containing complex disassembly | 75/8552 | 121/18723 | 2.17e-04 | 1.36e-03 | 75 |
| GO:003432918 | Esophagus | ESCC | cell junction assembly | 227/8552 | 420/18723 | 3.06e-04 | 1.83e-03 | 227 |
| GO:00436245 | Esophagus | ESCC | cellular protein complex disassembly | 78/8552 | 136/18723 | 4.00e-03 | 1.62e-02 | 78 |
| GO:00224117 | Liver | Cirrhotic | cellular component disassembly | 182/4634 | 443/18723 | 1.59e-14 | 1.54e-12 | 182 |
| GO:004325412 | Liver | Cirrhotic | regulation of protein-containing complex assembly | 169/4634 | 428/18723 | 7.40e-12 | 4.99e-10 | 169 |
| GO:000701512 | Liver | Cirrhotic | actin filament organization | 171/4634 | 442/18723 | 3.93e-11 | 2.30e-09 | 171 |
| GO:190290312 | Liver | Cirrhotic | regulation of supramolecular fiber organization | 148/4634 | 383/18723 | 8.85e-10 | 4.08e-08 | 148 |
| GO:003297012 | Liver | Cirrhotic | regulation of actin filament-based process | 152/4634 | 397/18723 | 1.12e-09 | 5.00e-08 | 152 |
| Page: 1 2 3 4 5 6 7 8 9 10 11 12 13 14 15 16 17 18 19 20 21 |
| Pathway ID | Tissue | Disease Stage | Description | Gene Ratio | Bg Ratio | pvalue | p.adjust | qvalue | Count |
| hsa04144 | Colorectum | AD | Endocytosis | 111/2092 | 251/8465 | 5.95e-12 | 1.42e-10 | 9.08e-11 | 111 |
| hsa041441 | Colorectum | AD | Endocytosis | 111/2092 | 251/8465 | 5.95e-12 | 1.42e-10 | 9.08e-11 | 111 |
| hsa041444 | Colorectum | MSS | Endocytosis | 102/1875 | 251/8465 | 1.85e-11 | 4.43e-10 | 2.71e-10 | 102 |
| hsa041445 | Colorectum | MSS | Endocytosis | 102/1875 | 251/8465 | 1.85e-11 | 4.43e-10 | 2.71e-10 | 102 |
| hsa041446 | Colorectum | FAP | Endocytosis | 78/1404 | 251/8465 | 6.20e-09 | 2.96e-07 | 1.80e-07 | 78 |
| hsa041447 | Colorectum | FAP | Endocytosis | 78/1404 | 251/8465 | 6.20e-09 | 2.96e-07 | 1.80e-07 | 78 |
| hsa041448 | Colorectum | CRC | Endocytosis | 65/1091 | 251/8465 | 1.27e-08 | 1.06e-06 | 7.19e-07 | 65 |
| hsa041449 | Colorectum | CRC | Endocytosis | 65/1091 | 251/8465 | 1.27e-08 | 1.06e-06 | 7.19e-07 | 65 |
| hsa0414429 | Esophagus | HGIN | Endocytosis | 76/1383 | 251/8465 | 1.74e-08 | 3.34e-07 | 2.65e-07 | 76 |
| hsa04144113 | Esophagus | HGIN | Endocytosis | 76/1383 | 251/8465 | 1.74e-08 | 3.34e-07 | 2.65e-07 | 76 |
| hsa04144210 | Esophagus | ESCC | Endocytosis | 186/4205 | 251/8465 | 9.74e-16 | 4.66e-14 | 2.39e-14 | 186 |
| hsa0414437 | Esophagus | ESCC | Endocytosis | 186/4205 | 251/8465 | 9.74e-16 | 4.66e-14 | 2.39e-14 | 186 |
| hsa0414412 | Liver | Cirrhotic | Endocytosis | 119/2530 | 251/8465 | 2.33e-09 | 4.56e-08 | 2.81e-08 | 119 |
| hsa0414413 | Liver | Cirrhotic | Endocytosis | 119/2530 | 251/8465 | 2.33e-09 | 4.56e-08 | 2.81e-08 | 119 |
| hsa0414422 | Liver | HCC | Endocytosis | 178/4020 | 251/8465 | 2.03e-14 | 5.22e-13 | 2.91e-13 | 178 |
| hsa0414432 | Liver | HCC | Endocytosis | 178/4020 | 251/8465 | 2.03e-14 | 5.22e-13 | 2.91e-13 | 178 |
| hsa0414414 | Lung | IAC | Endocytosis | 51/1053 | 251/8465 | 2.25e-04 | 2.54e-03 | 1.68e-03 | 51 |
| hsa0414415 | Lung | IAC | Endocytosis | 51/1053 | 251/8465 | 2.25e-04 | 2.54e-03 | 1.68e-03 | 51 |
| hsa0414427 | Oral cavity | OSCC | Endocytosis | 174/3704 | 251/8465 | 9.42e-17 | 4.51e-15 | 2.29e-15 | 174 |
| hsa04144112 | Oral cavity | OSCC | Endocytosis | 174/3704 | 251/8465 | 9.42e-17 | 4.51e-15 | 2.29e-15 | 174 |
| Page: 1 2 |
Top |
Cell-cell communication analysis |
| Identification of potential cell-cell interactions between two cell types and their ligand-receptor pairs for different disease states |
| Ligand | Receptor | LRpair | Pathway | Tissue | Disease Stage |
| Page: 1 |
Top |
Single-cell gene regulatory network inference analysis |
| Find out the significant the regulons (TFs) and the target genes of each regulon across cell types for different disease states |
| TF | Cell Type | Tissue | Disease Stage | Target Gene | RSS | Regulon Activity |
| ∗The dot plots of a searched regulon are shown for all cell subpopulations in each disease state of each tissue based on the regulon specific score inferred using pySCENIC and by calculating the average expression. |
| Page: 1 |
Top |
Somatic mutation of malignant transformation related genes |
| Annotation of somatic variants for genes involved in malignant transformation |
| Hugo Symbol | Variant Class | Variant Classification | dbSNP RS | HGVSc | HGVSp | HGVSp Short | SWISSPROT | BIOTYPE | SIFT | PolyPhen | Tumor Sample Barcode | Tissue | Histology | Sex | Age | Stage | Therapy Types | Drugs | Outcome |
| CAPZA1 | SNV | Missense_Mutation | novel | c.86T>G | p.Phe29Cys | p.F29C | P52907 | protein_coding | deleterious(0.03) | probably_damaging(0.99) | TCGA-EA-A3HU-01 | Cervix | cervical & endocervical cancer | Female | <65 | I/II | Unknown | Unknown | SD |
| CAPZA1 | SNV | Missense_Mutation | c.847N>G | p.Met283Val | p.M283V | P52907 | protein_coding | deleterious(0.02) | possibly_damaging(0.678) | TCGA-AA-3821-01 | Colorectum | colon adenocarcinoma | Female | >=65 | I/II | Unknown | Unknown | SD | |
| CAPZA1 | SNV | Missense_Mutation | novel | c.157G>A | p.Ala53Thr | p.A53T | P52907 | protein_coding | deleterious(0.04) | possibly_damaging(0.868) | TCGA-AA-3864-01 | Colorectum | colon adenocarcinoma | Male | >=65 | I/II | Unknown | Unknown | SD |
| CAPZA1 | SNV | Missense_Mutation | c.776N>A | p.Arg259His | p.R259H | P52907 | protein_coding | deleterious(0) | probably_damaging(0.996) | TCGA-AZ-4313-01 | Colorectum | colon adenocarcinoma | Female | <65 | I/II | Unknown | Unknown | SD | |
| CAPZA1 | SNV | Missense_Mutation | rs773856348 | c.808G>A | p.Asp270Asn | p.D270N | P52907 | protein_coding | tolerated(0.08) | probably_damaging(0.986) | TCGA-AZ-4615-01 | Colorectum | colon adenocarcinoma | Male | >=65 | III/IV | Chemotherapy | xeloda | PD |
| CAPZA1 | SNV | Missense_Mutation | rs769657219 | c.797G>A | p.Arg266His | p.R266H | P52907 | protein_coding | tolerated(0.06) | benign(0.003) | TCGA-G4-6304-01 | Colorectum | colon adenocarcinoma | Female | >=65 | I/II | Chemotherapy | fluorouracil | PD |
| CAPZA1 | SNV | Missense_Mutation | c.260N>G | p.Phe87Cys | p.F87C | P52907 | protein_coding | deleterious(0) | benign(0.076) | TCGA-AG-3909-01 | Colorectum | rectum adenocarcinoma | Female | >=65 | III/IV | Chemotherapy | folinic | CR | |
| CAPZA1 | SNV | Missense_Mutation | novel | c.94G>T | p.Val32Leu | p.V32L | P52907 | protein_coding | deleterious(0) | probably_damaging(0.96) | TCGA-F5-6814-01 | Colorectum | rectum adenocarcinoma | Male | <65 | I/II | Unknown | Unknown | SD |
| CAPZA1 | SNV | Missense_Mutation | novel | c.767N>C | p.Lys256Thr | p.K256T | P52907 | protein_coding | deleterious(0) | probably_damaging(0.996) | TCGA-AP-A1DK-01 | Endometrium | uterine corpus endometrioid carcinoma | Female | <65 | I/II | Unknown | Unknown | SD |
| CAPZA1 | SNV | Missense_Mutation | novel | c.703G>A | p.Ala235Thr | p.A235T | P52907 | protein_coding | tolerated(0.06) | probably_damaging(0.994) | TCGA-AX-A1CE-01 | Endometrium | uterine corpus endometrioid carcinoma | Female | <65 | I/II | Unspecific | Paclitaxel | SD |
| Page: 1 2 3 |
Top |
Related drugs of malignant transformation related genes |
| Identification of chemicals and drugs interact with genes involved in malignant transfromation |
| (DGIdb 4.0) |
| Entrez ID | Symbol | Category | Interaction Types | Drug Claim Name | Drug Name | PMIDs |
| Page: 1 |

Copyright 2023-Present -The University of Texas Health Science Center at Houston |