Schematic overview of the cellular and molecular mechanisms involved in the cancer progression, including the proposed cellular and molecular mechanisms in cancer cells trajectory. AT1: alveolar type 1 cells; AT2: alveolar type 2 cells; AAH: atypical adenomatous hyperplasia; AIS: adenocarcinoma in situ; MIA: minimally invasive adenocarcinoma; IA: invasive adenocarcinoma; EMT: epithelial-mesenchymal transition

Home

Download

Statistics

Help

Contact

Center for Computational Systems Medicine
leaf

Gene summary

leaf

Malignant transformation analysis

leaf

Malignant transformation related pathway analysis

leaf

Cell-cell communication analysis

leaf

Single-cell gene regulatory network inference analysis

leaf

Somatic mutation of malignant transformation related genes

leaf

Related drugs of malignant transformation related genes

Gene: CAMLG

Gene summary for CAMLG

check button Gene summary.

Gene informationSpeciesHuman
Gene symbol

CAMLG

Gene ID

819

Gene namecalcium modulating ligand
Gene AliasCAML
Cytomap5q31.1
Gene Typeprotein-coding
GO ID

GO:0001776

UniProtAcc

P49069


Top

Malignant transformation analysis

check button Identification of the aberrant gene expression in precancerous and cancerous lesions by comparing the gene expression of stem-like cells in diseased tissues with normal stem cells
check button Malignant transformation involving gene list.
Entrez IDSymbolReplicatesSpeciesOrganTissueAdj P-valueLog2FCMalignancy
819CAMLGHTA11_1938_2000001011HumanColorectumAD4.11e-033.08e-01-0.0811
819CAMLGHTA11_347_2000001011HumanColorectumAD2.12e-052.73e-01-0.1954
819CAMLGHTA11_866_3004761011HumanColorectumAD9.47e-073.17e-010.096
819CAMLGHTA11_7663_2000001011HumanColorectumSER4.88e-023.70e-010.0131
819CAMLGHTA11_7696_3000711011HumanColorectumAD2.86e-103.03e-010.0674
819CAMLGHTA11_99999970781_79442HumanColorectumMSS2.95e-104.06e-010.294
819CAMLGHTA11_99999965062_69753HumanColorectumMSI-H3.75e-035.49e-010.3487
819CAMLGHTA11_99999965104_69814HumanColorectumMSS8.63e-043.45e-010.281
819CAMLGHTA11_99999971662_82457HumanColorectumMSS1.24e-247.55e-010.3859
819CAMLGHTA11_99999974143_84620HumanColorectumMSS6.75e-072.88e-010.3005
819CAMLGAEH-subject1HumanEndometriumAEH3.98e-10-3.98e-01-0.3059
819CAMLGAEH-subject2HumanEndometriumAEH4.03e-14-4.24e-01-0.2525
819CAMLGAEH-subject3HumanEndometriumAEH1.20e-25-5.16e-01-0.2576
819CAMLGAEH-subject4HumanEndometriumAEH5.25e-09-3.56e-01-0.2657
819CAMLGAEH-subject5HumanEndometriumAEH5.04e-12-4.49e-01-0.2953
819CAMLGEEC-subject1HumanEndometriumEEC2.02e-13-3.96e-01-0.2682
819CAMLGEEC-subject2HumanEndometriumEEC6.00e-22-5.23e-01-0.2607
819CAMLGEEC-subject3HumanEndometriumEEC5.48e-37-4.30e-01-0.2525
819CAMLGEEC-subject4HumanEndometriumEEC8.96e-07-3.58e-01-0.2571
819CAMLGEEC-subject5HumanEndometriumEEC1.27e-09-3.54e-01-0.249
Page: 1 2 3 4 5 6 7 8 

check button Transcriptomic changes along malignancy continuum.
TissueExpression DynamicsAbbreviation
Colorectum (GSE201348)The image shows the transcriptomic changes along malignancy continuum.log2FC in expression of this searched gene in stem-like cells from each diseased tissue sample relative to stem-like cells in normal samples in each tissue plotted against the malignancy continuum. Samples are colored based on if they are from different disease stage.FAP: Familial adenomatous polyposis
CRC: Colorectal cancer
Colorectum (HTA11)The image shows the transcriptomic changes along malignancy continuum.log2FC in expression of this searched gene in stem-like cells from each diseased tissue sample relative to stem-like cells in normal samples in each tissue plotted against the malignancy continuum. Samples are colored based on if they are from different disease stage.AD: Adenomas
SER: Sessile serrated lesions
MSI-H: Microsatellite-high colorectal cancer
MSS: Microsatellite stable colorectal cancer
EndometriumThe image shows the transcriptomic changes along malignancy continuum.log2FC in expression of this searched gene in stem-like cells from each diseased tissue sample relative to stem-like cells in normal samples in each tissue plotted against the malignancy continuum. Samples are colored based on if they are from different disease stage.
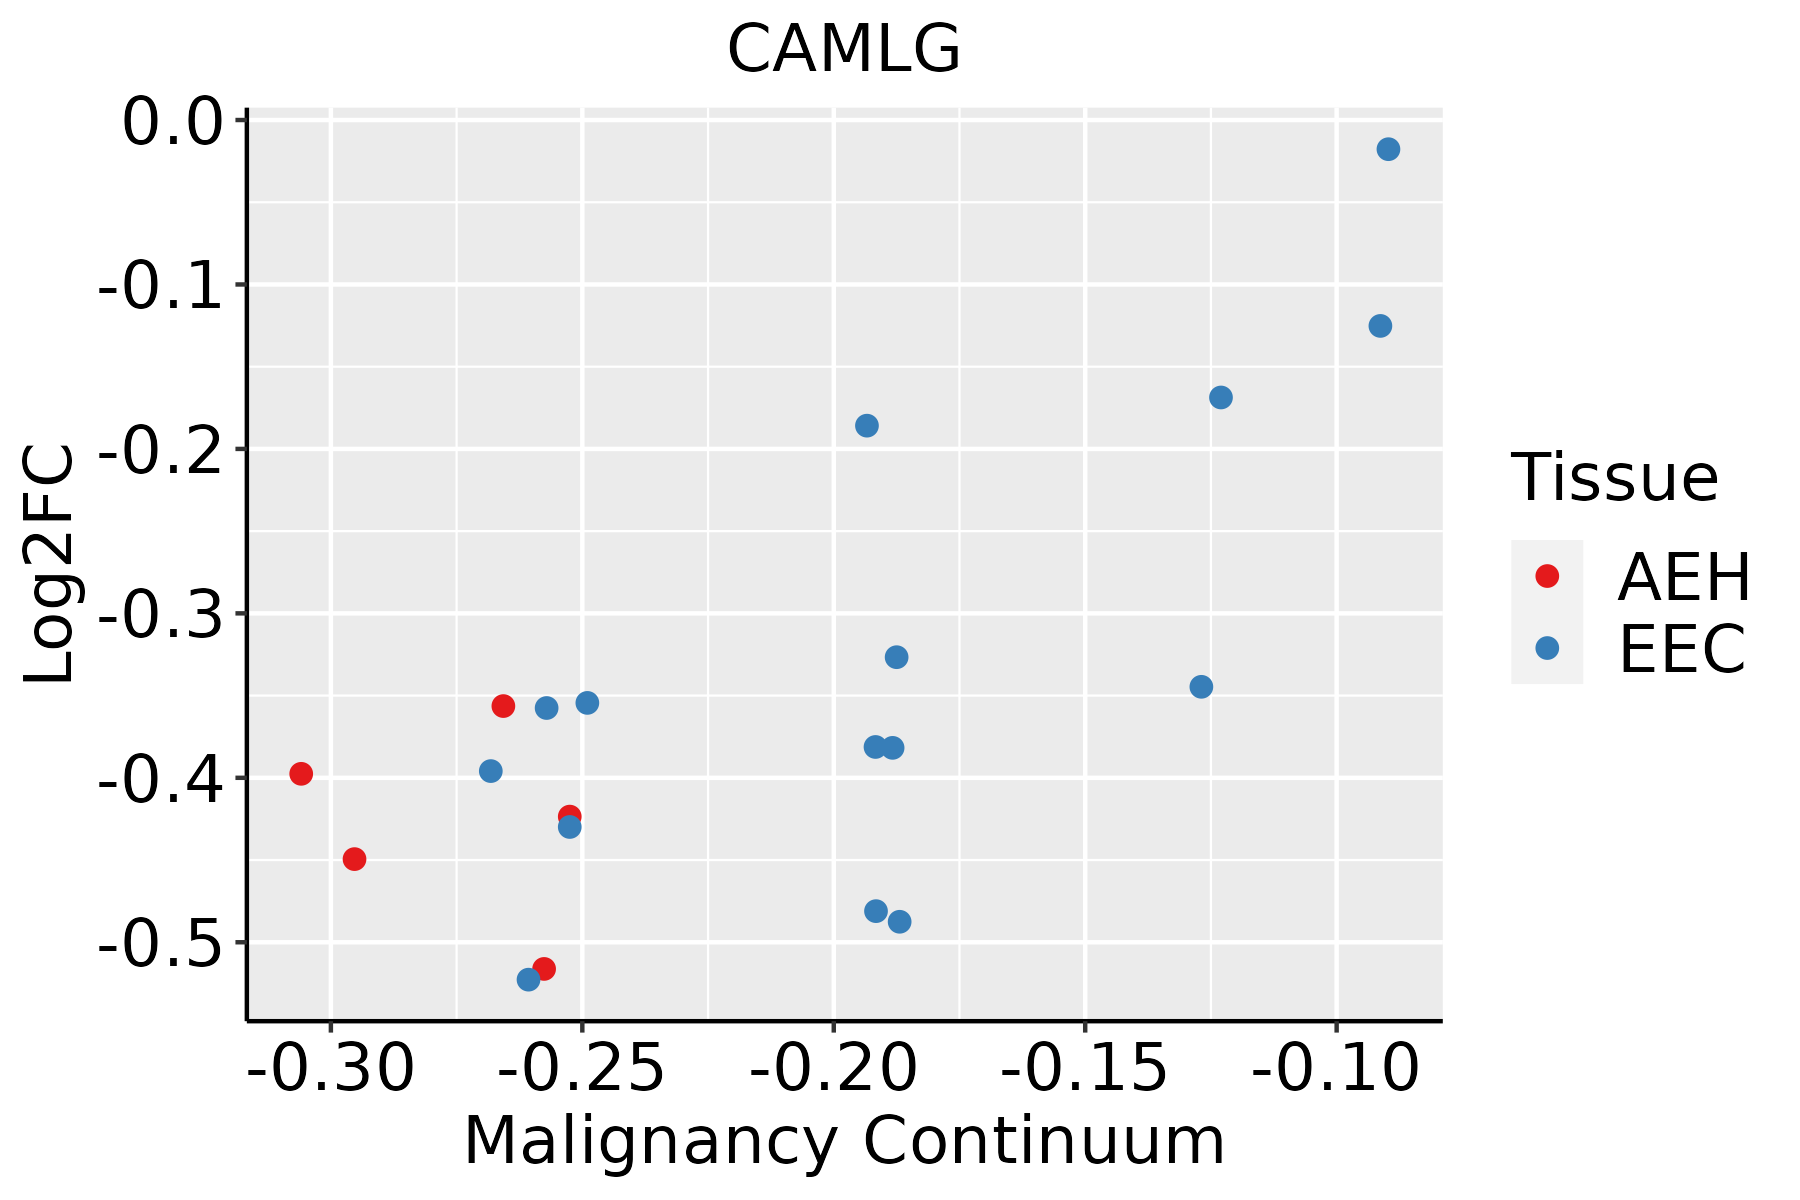
AEH: Atypical endometrial hyperplasia
EEC: Endometrioid Cancer
EsophagusThe image shows the transcriptomic changes along malignancy continuum.log2FC in expression of this searched gene in stem-like cells from each diseased tissue sample relative to stem-like cells in normal samples in each tissue plotted against the malignancy continuum. Samples are colored based on if they are from different disease stage.ESCC: Esophageal squamous cell carcinoma
HGIN: High-grade intraepithelial neoplasias
LGIN: Low-grade intraepithelial neoplasias
LiverThe image shows the transcriptomic changes along malignancy continuum.log2FC in expression of this searched gene in stem-like cells from each diseased tissue sample relative to stem-like cells in normal samples in each tissue plotted against the malignancy continuum. Samples are colored based on if they are from different disease stage.
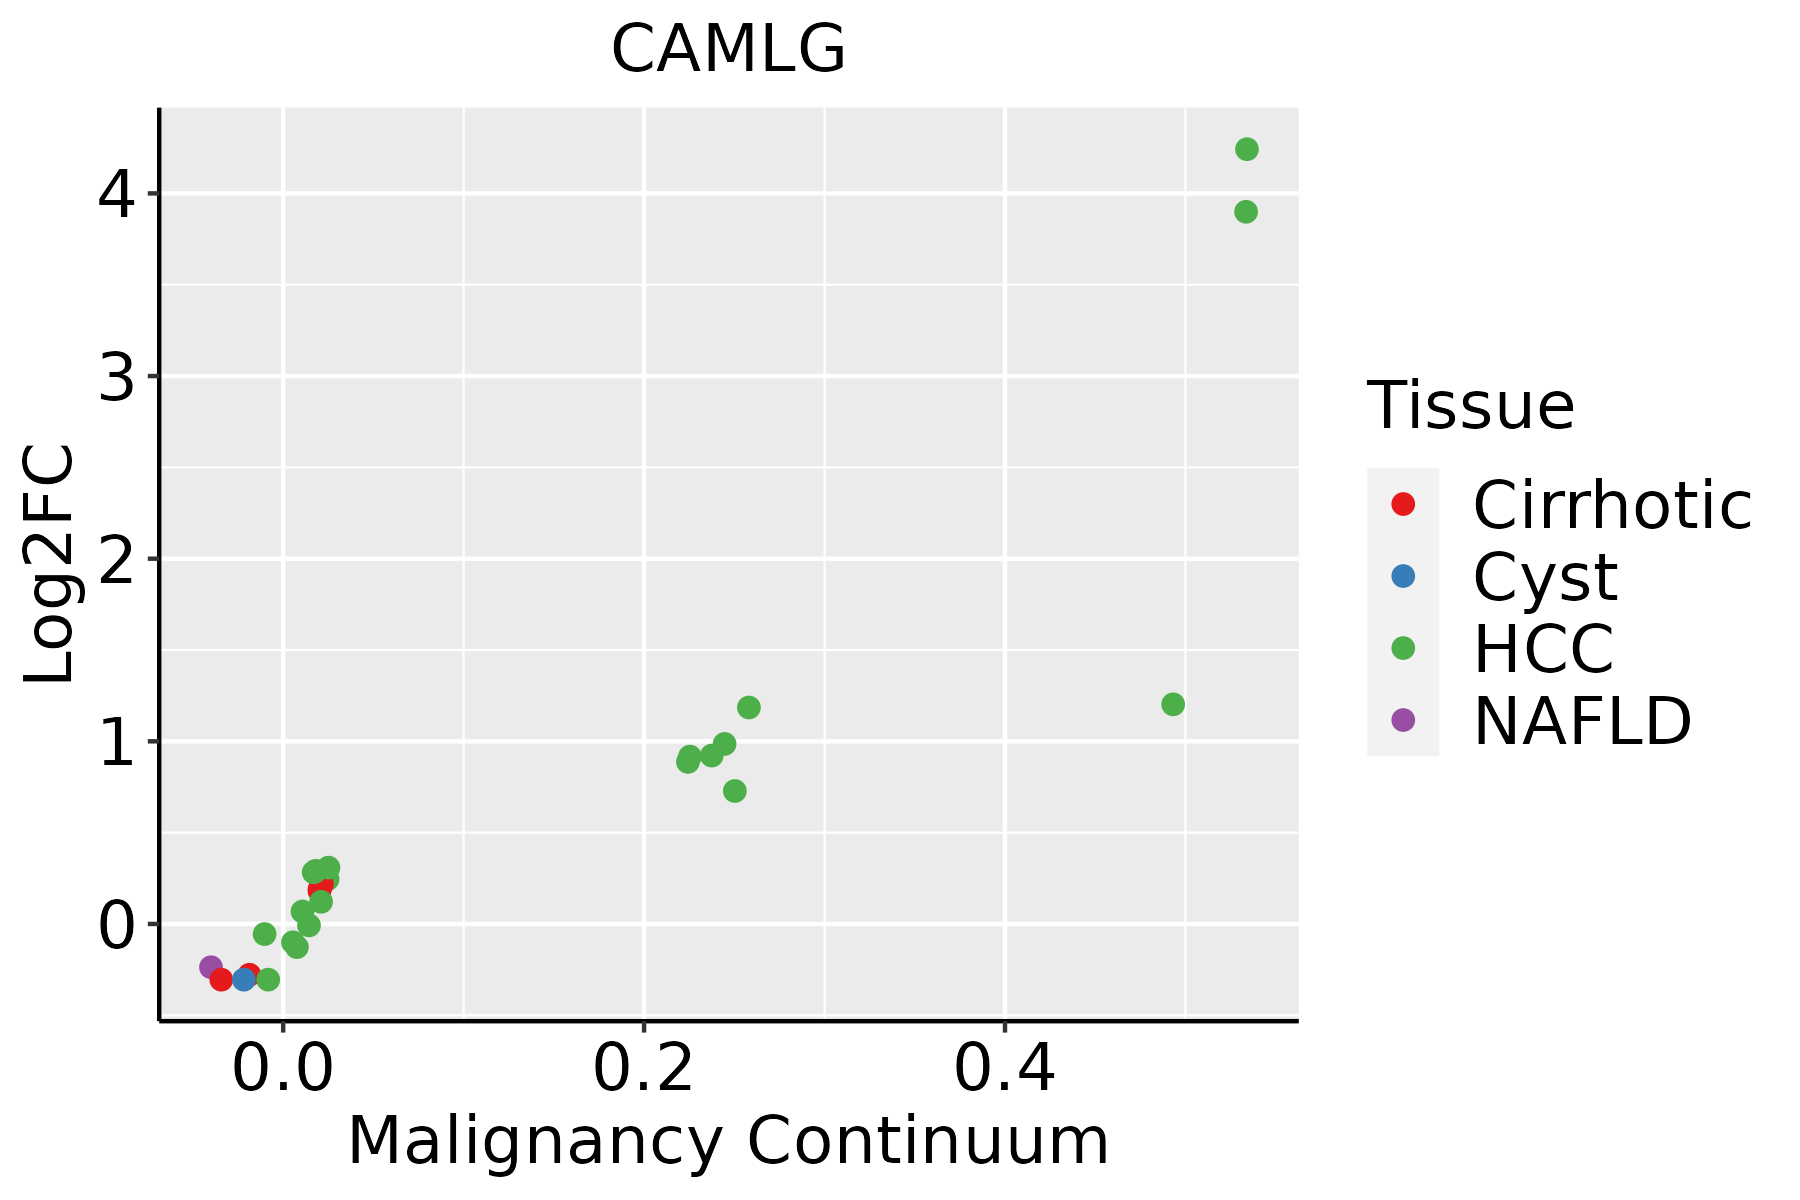
HCC: Hepatocellular carcinoma
NAFLD: Non-alcoholic fatty liver disease
Oral CavityThe image shows the transcriptomic changes along malignancy continuum.log2FC in expression of this searched gene in stem-like cells from each diseased tissue sample relative to stem-like cells in normal samples in each tissue plotted against the malignancy continuum. Samples are colored based on if they are from different disease stage.
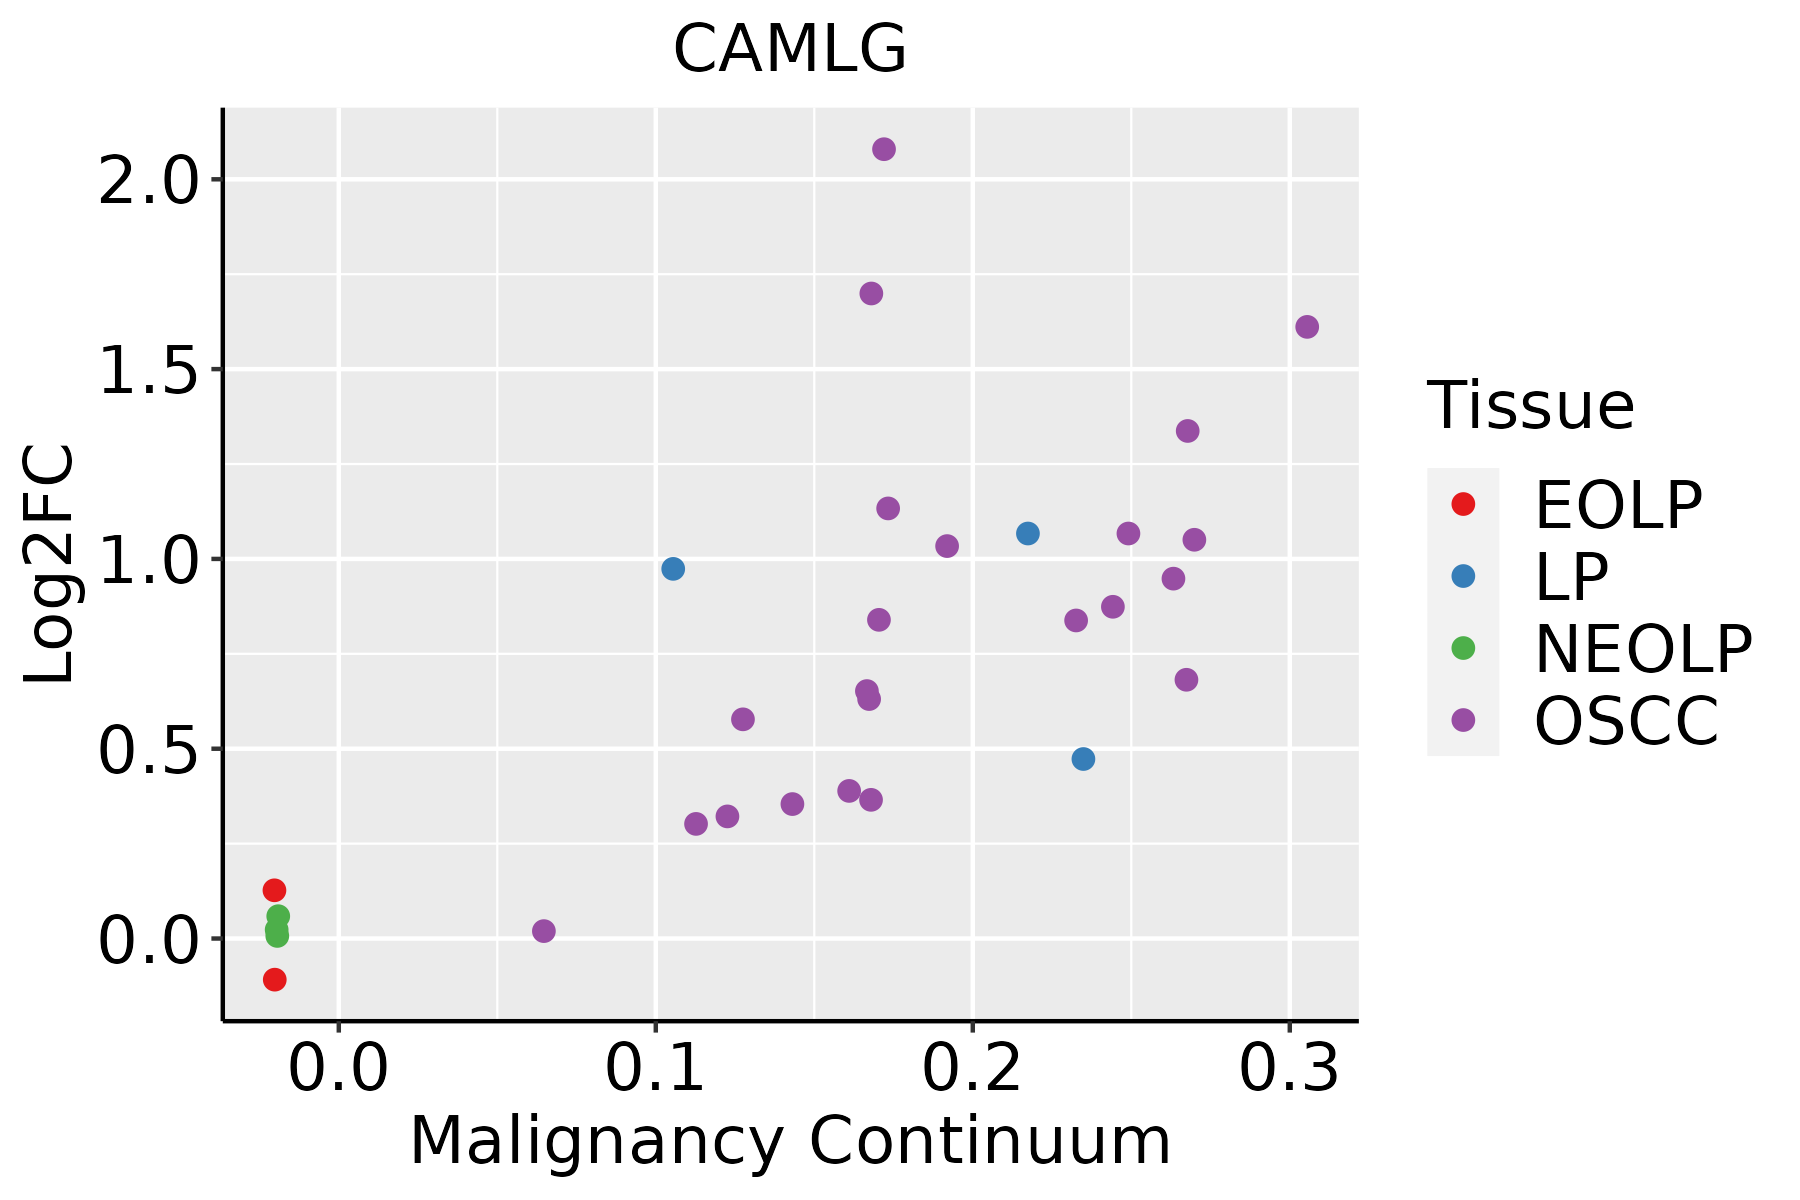
EOLP: Erosive Oral lichen planus
LP: leukoplakia
NEOLP: Non-erosive oral lichen planus
OSCC: Oral squamous cell carcinoma
ProstateThe image shows the transcriptomic changes along malignancy continuum.log2FC in expression of this searched gene in stem-like cells from each diseased tissue sample relative to stem-like cells in normal samples in each tissue plotted against the malignancy continuum. Samples are colored based on if they are from different disease stage.BPH: Benign Prostatic Hyperplasia
SkinThe image shows the transcriptomic changes along malignancy continuum.log2FC in expression of this searched gene in stem-like cells from each diseased tissue sample relative to stem-like cells in normal samples in each tissue plotted against the malignancy continuum. Samples are colored based on if they are from different disease stage.
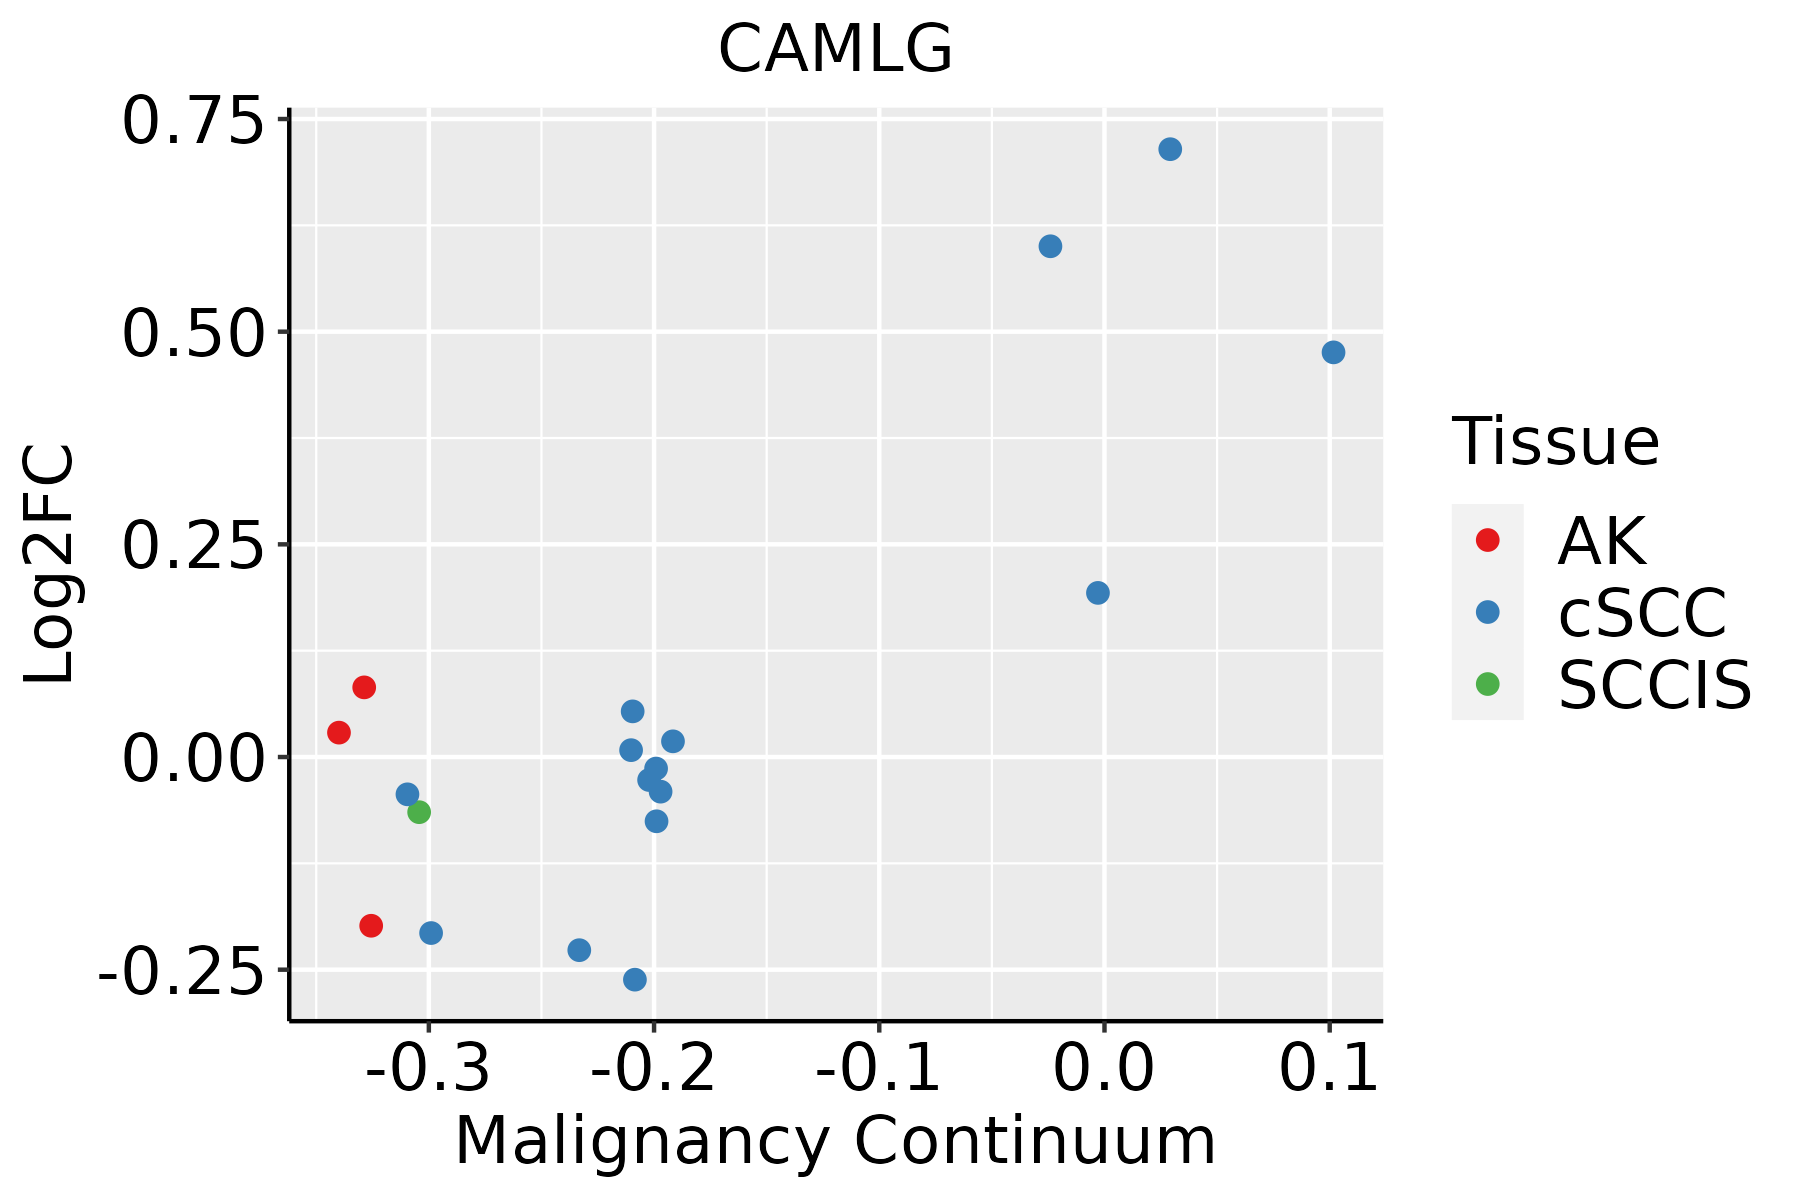
AK: Actinic keratosis
cSCC: Cutaneous squamous cell carcinoma
SCCIS:squamous cell carcinoma in situ
ThyroidThe image shows the transcriptomic changes along malignancy continuum.log2FC in expression of this searched gene in stem-like cells from each diseased tissue sample relative to stem-like cells in normal samples in each tissue plotted against the malignancy continuum. Samples are colored based on if they are from different disease stage.ATC: Anaplastic thyroid cancer
HT: Hashimoto's thyroiditis
PTC: Papillary thyroid cancer
∗log2FC in expression of this searched gene in stem-like cells from each diseased tissue sample relative to stem-like cells in normal samples in each tissue plotted against the malignancy continuum. Samples are colored based on if they are from different disease stage.

Top

Malignant transformation related pathway analysis

check buttonFind out the enriched GO biological processes and KEGG pathways involved in transition from healthy to precancer to cancer
check button Figure of enriched GO biological processes.
TissueDisease StageEnriched GO biological Processes
ColorectumADGO analysis - Figure of enriched GO biological processes: Top 15 enriched GO BP terms are showed in the bar plot of each disease state in each tissue. Each row represents a significant GO biological process which is colored according to the -log10(p.adjust).
ColorectumSERGO analysis - Figure of enriched GO biological processes: Top 15 enriched GO BP terms are showed in the bar plot of each disease state in each tissue. Each row represents a significant GO biological process which is colored according to the -log10(p.adjust).
ColorectumMSSGO analysis - Figure of enriched GO biological processes: Top 15 enriched GO BP terms are showed in the bar plot of each disease state in each tissue. Each row represents a significant GO biological process which is colored according to the -log10(p.adjust).
ColorectumMSI-HGO analysis - Figure of enriched GO biological processes: Top 15 enriched GO BP terms are showed in the bar plot of each disease state in each tissue. Each row represents a significant GO biological process which is colored according to the -log10(p.adjust).
ColorectumFAPGO analysis - Figure of enriched GO biological processes: Top 15 enriched GO BP terms are showed in the bar plot of each disease state in each tissue. Each row represents a significant GO biological process which is colored according to the -log10(p.adjust).
∗Top 15 enriched GO BP terms are showed in the bar plot of each disease state in each tissue. Each row represents a significant GO biological process which is colored according to the -log10(p.adjust).
Page: 1 2 3 4 5 6 7 8 9 

check button Enriched GO biological processes.
GO IDTissueDisease StageDescriptionGene RatioBg Ratiopvaluep.adjustCount
GO:190305017EndometriumEECregulation of proteolysis involved in cellular protein catabolic process60/2168221/187231.46e-101.69e-0860
GO:004316117EndometriumEECproteasome-mediated ubiquitin-dependent protein catabolic process92/2168412/187233.01e-103.23e-0892
GO:003139717EndometriumEECnegative regulation of protein ubiquitination31/216883/187231.05e-099.13e-0831
GO:200005817EndometriumEECregulation of ubiquitin-dependent protein catabolic process47/2168164/187232.09e-091.72e-0747
GO:190332117EndometriumEECnegative regulation of protein modification by small protein conjugation or removal33/216895/187232.68e-092.01e-0733
GO:006113617EndometriumEECregulation of proteasomal protein catabolic process51/2168187/187232.91e-092.10e-0751
GO:003243417EndometriumEECregulation of proteasomal ubiquitin-dependent protein catabolic process39/2168134/187233.01e-081.71e-0639
GO:004217716EndometriumEECnegative regulation of protein catabolic process35/2168121/187231.79e-078.20e-0635
GO:190336314EndometriumEECnegative regulation of cellular protein catabolic process25/216875/187235.43e-072.04e-0525
GO:004586117EndometriumEECnegative regulation of proteolysis72/2168351/187238.46e-072.98e-0572
GO:200005916EndometriumEECnegative regulation of ubiquitin-dependent protein catabolic process18/216848/187233.08e-068.48e-0518
GO:190305114EndometriumEECnegative regulation of proteolysis involved in cellular protein catabolic process21/216864/187235.73e-061.40e-0421
GO:003133017EndometriumEECnegative regulation of cellular catabolic process55/2168262/187237.93e-061.80e-0455
GO:009015015EndometriumEECestablishment of protein localization to membrane52/2168260/187235.46e-058.64e-0452
GO:000989516EndometriumEECnegative regulation of catabolic process61/2168320/187235.76e-058.97e-0461
GO:190179911EndometriumEECnegative regulation of proteasomal protein catabolic process16/216849/187237.80e-051.13e-0316
GO:003243512EndometriumEECnegative regulation of proteasomal ubiquitin-dependent protein catabolic process13/216835/187238.13e-051.17e-0313
GO:004887217EndometriumEEChomeostasis of number of cells53/2168272/187239.52e-051.34e-0353
GO:005120512EndometriumEECprotein insertion into membrane14/216857/187234.65e-032.97e-0214
GO:004217627EsophagusHGINregulation of protein catabolic process119/2587391/187238.09e-182.43e-15119
Page: 1 2 3 4 5 6 7 8 9 10 11 12 13 14 15 16 17 18 19 20 21 22 23 24 

check button Enriched KEGG pathways.
Pathway IDTissueDisease StageDescriptionGene RatioBg Ratiopvaluep.adjustqvalueCount
Page: 1 

Top

Cell-cell communication analysis

check buttonIdentification of potential cell-cell interactions between two cell types and their ligand-receptor pairs for different disease states
LigandReceptorLRpairPathwayTissueDisease Stage
Page: 1 

Top

Single-cell gene regulatory network inference analysis

check buttonFind out the significant the regulons (TFs) and the target genes of each regulon across cell types for different disease states
TFCell TypeTissueDisease StageTarget GeneRSSRegulon Activity
∗The dot plots of a searched regulon are shown for all cell subpopulations in each disease state of each tissue based on the regulon specific score inferred using pySCENIC and by calculating the average expression.
Page: 1 

Top

Somatic mutation of malignant transformation related genes

check buttonAnnotation of somatic variants for genes involved in malignant transformation
Hugo SymbolVariant ClassVariant ClassificationdbSNP RSHGVScHGVSpHGVSp ShortSWISSPROTBIOTYPESIFTPolyPhenTumor Sample BarcodeTissueHistologySexAgeStageTherapy TypesDrugsOutcome
CAMLGSNVMissense_Mutationrs143564828c.310N>Ap.Glu104Lysp.E104KP49069protein_codingdeleterious(0.01)benign(0.266)TCGA-HM-A3JK-01Cervixcervical & endocervical cancerFemale<65I/IIChemotherapycisplatinSD
CAMLGSNVMissense_Mutationnovelc.133N>Cp.Asn45Hisp.N45HP49069protein_codingdeleterious(0)probably_damaging(0.999)TCGA-AA-3984-01Colorectumcolon adenocarcinomaFemale<65I/IIUnknownUnknownSD
CAMLGSNVMissense_Mutationc.71C>Tp.Ala24Valp.A24VP49069protein_codingtolerated_low_confidence(0.07)possibly_damaging(0.558)TCGA-AD-5900-01Colorectumcolon adenocarcinomaMale>=65I/IIUnknownUnknownSD
CAMLGSNVMissense_Mutationrs751766092c.566N>Ap.Arg189Glnp.R189QP49069protein_codingdeleterious_low_confidence(0.01)probably_damaging(0.946)TCGA-AZ-4315-01Colorectumcolon adenocarcinomaMale<65I/IIUnknownUnknownSD
CAMLGSNVMissense_Mutationrs765331970c.763N>Ap.Glu255Lysp.E255KP49069protein_codingdeleterious(0)probably_damaging(0.997)TCGA-AZ-4315-01Colorectumcolon adenocarcinomaMale<65I/IIUnknownUnknownSD
CAMLGSNVMissense_Mutationnovelc.308N>Tp.Ala103Valp.A103VP49069protein_codingtolerated(0.2)benign(0)TCGA-A5-A0G2-01Endometriumuterine corpus endometrioid carcinomaFemale<65III/IVUnknownUnknownSD
CAMLGSNVMissense_Mutationnovelc.204N>Tp.Gln68Hisp.Q68HP49069protein_codingtolerated(0.57)benign(0)TCGA-AP-A059-01Endometriumuterine corpus endometrioid carcinomaFemale>=65I/IIUnknownUnknownSD
CAMLGSNVMissense_Mutationrs757373789c.446N>Ap.Arg149Hisp.R149HP49069protein_codingtolerated_low_confidence(0.19)benign(0.006)TCGA-AP-A1DV-01Endometriumuterine corpus endometrioid carcinomaFemale<65I/IIUnknownUnknownSD
CAMLGSNVMissense_Mutationrs765331970c.763N>Ap.Glu255Lysp.E255KP49069protein_codingdeleterious(0)probably_damaging(0.997)TCGA-B5-A0JY-01Endometriumuterine corpus endometrioid carcinomaFemale<65III/IVChemotherapydoxorubicinSD
CAMLGSNVMissense_Mutationnovelc.868T>Cp.Tyr290Hisp.Y290HP49069protein_codingdeleterious(0.02)possibly_damaging(0.748)TCGA-B5-A3FA-01Endometriumuterine corpus endometrioid carcinomaFemale>=65I/IIUnknownUnknownSD
Page: 1 2 3 

Top

Related drugs of malignant transformation related genes

check buttonIdentification of chemicals and drugs interact with genes involved in malignant transfromation
(DGIdb 4.0)
Entrez IDSymbolCategoryInteraction TypesDrug Claim NameDrug NamePMIDs
819CAMLGNACYCLOSPORINE A
819CAMLGNACYCLOSPORINECYCLOSPORINE
Page: 1