
|
|||||
|
 | |
| |
| |
| |
| |
| |
|
Gene: BSG |
Gene summary for BSG |
| Gene information | Species | Human | Gene symbol | BSG | Gene ID | 682 |
| Gene name | basigin (Ok blood group) | |
| Gene Alias | 5F7 | |
| Cytomap | 19p13.3 | |
| Gene Type | protein-coding | GO ID | GO:0000003 | UniProtAcc | P35613 |
Top |
Malignant transformation analysis |
| Identification of the aberrant gene expression in precancerous and cancerous lesions by comparing the gene expression of stem-like cells in diseased tissues with normal stem cells |
| Entrez ID | Symbol | Replicates | Species | Organ | Tissue | Adj P-value | Log2FC | Malignancy |
| 682 | BSG | HTA11_2487_2000001011 | Human | Colorectum | SER | 3.28e-33 | 1.30e+00 | -0.1808 |
| 682 | BSG | HTA11_1938_2000001011 | Human | Colorectum | AD | 3.15e-07 | 6.01e-01 | -0.0811 |
| 682 | BSG | HTA11_78_2000001011 | Human | Colorectum | AD | 2.17e-03 | 5.22e-01 | -0.1088 |
| 682 | BSG | HTA11_347_2000001011 | Human | Colorectum | AD | 2.49e-43 | 1.14e+00 | -0.1954 |
| 682 | BSG | HTA11_411_2000001011 | Human | Colorectum | SER | 2.15e-08 | 1.30e+00 | -0.2602 |
| 682 | BSG | HTA11_2112_2000001011 | Human | Colorectum | SER | 4.69e-04 | 8.94e-01 | -0.2196 |
| 682 | BSG | HTA11_3361_2000001011 | Human | Colorectum | AD | 2.71e-23 | 1.09e+00 | -0.1207 |
| 682 | BSG | HTA11_83_2000001011 | Human | Colorectum | SER | 6.90e-20 | 1.19e+00 | -0.1526 |
| 682 | BSG | HTA11_696_2000001011 | Human | Colorectum | AD | 2.90e-28 | 9.61e-01 | -0.1464 |
| 682 | BSG | HTA11_866_2000001011 | Human | Colorectum | AD | 4.31e-12 | 6.39e-01 | -0.1001 |
| 682 | BSG | HTA11_1391_2000001011 | Human | Colorectum | AD | 1.33e-22 | 8.52e-01 | -0.059 |
| 682 | BSG | HTA11_2992_2000001011 | Human | Colorectum | SER | 5.29e-06 | 7.53e-01 | -0.1706 |
| 682 | BSG | HTA11_5212_2000001011 | Human | Colorectum | AD | 2.04e-19 | 1.42e+00 | -0.2061 |
| 682 | BSG | HTA11_5216_2000001011 | Human | Colorectum | SER | 9.61e-10 | 1.39e+00 | -0.1462 |
| 682 | BSG | HTA11_546_2000001011 | Human | Colorectum | AD | 1.64e-05 | 6.74e-01 | -0.0842 |
| 682 | BSG | HTA11_9341_2000001011 | Human | Colorectum | SER | 4.00e-03 | 5.87e-01 | -0.00410000000000005 |
| 682 | BSG | HTA11_7862_2000001011 | Human | Colorectum | AD | 1.65e-05 | 5.02e-01 | -0.0179 |
| 682 | BSG | HTA11_866_3004761011 | Human | Colorectum | AD | 1.53e-02 | 2.64e-01 | 0.096 |
| 682 | BSG | HTA11_4255_2000001011 | Human | Colorectum | SER | 5.67e-04 | 7.66e-01 | 0.0446 |
| 682 | BSG | HTA11_8622_2000001021 | Human | Colorectum | SER | 1.65e-05 | 6.58e-01 | 0.0528 |
| Page: 1 2 3 4 5 6 7 8 9 10 11 |
| Tissue | Expression Dynamics | Abbreviation |
| Colorectum (GSE201348) |  | FAP: Familial adenomatous polyposis |
| CRC: Colorectal cancer | ||
| Colorectum (HTA11) |  | AD: Adenomas |
| SER: Sessile serrated lesions | ||
| MSI-H: Microsatellite-high colorectal cancer | ||
| MSS: Microsatellite stable colorectal cancer | ||
| Endometrium |  | AEH: Atypical endometrial hyperplasia |
| EEC: Endometrioid Cancer | ||
| Esophagus | 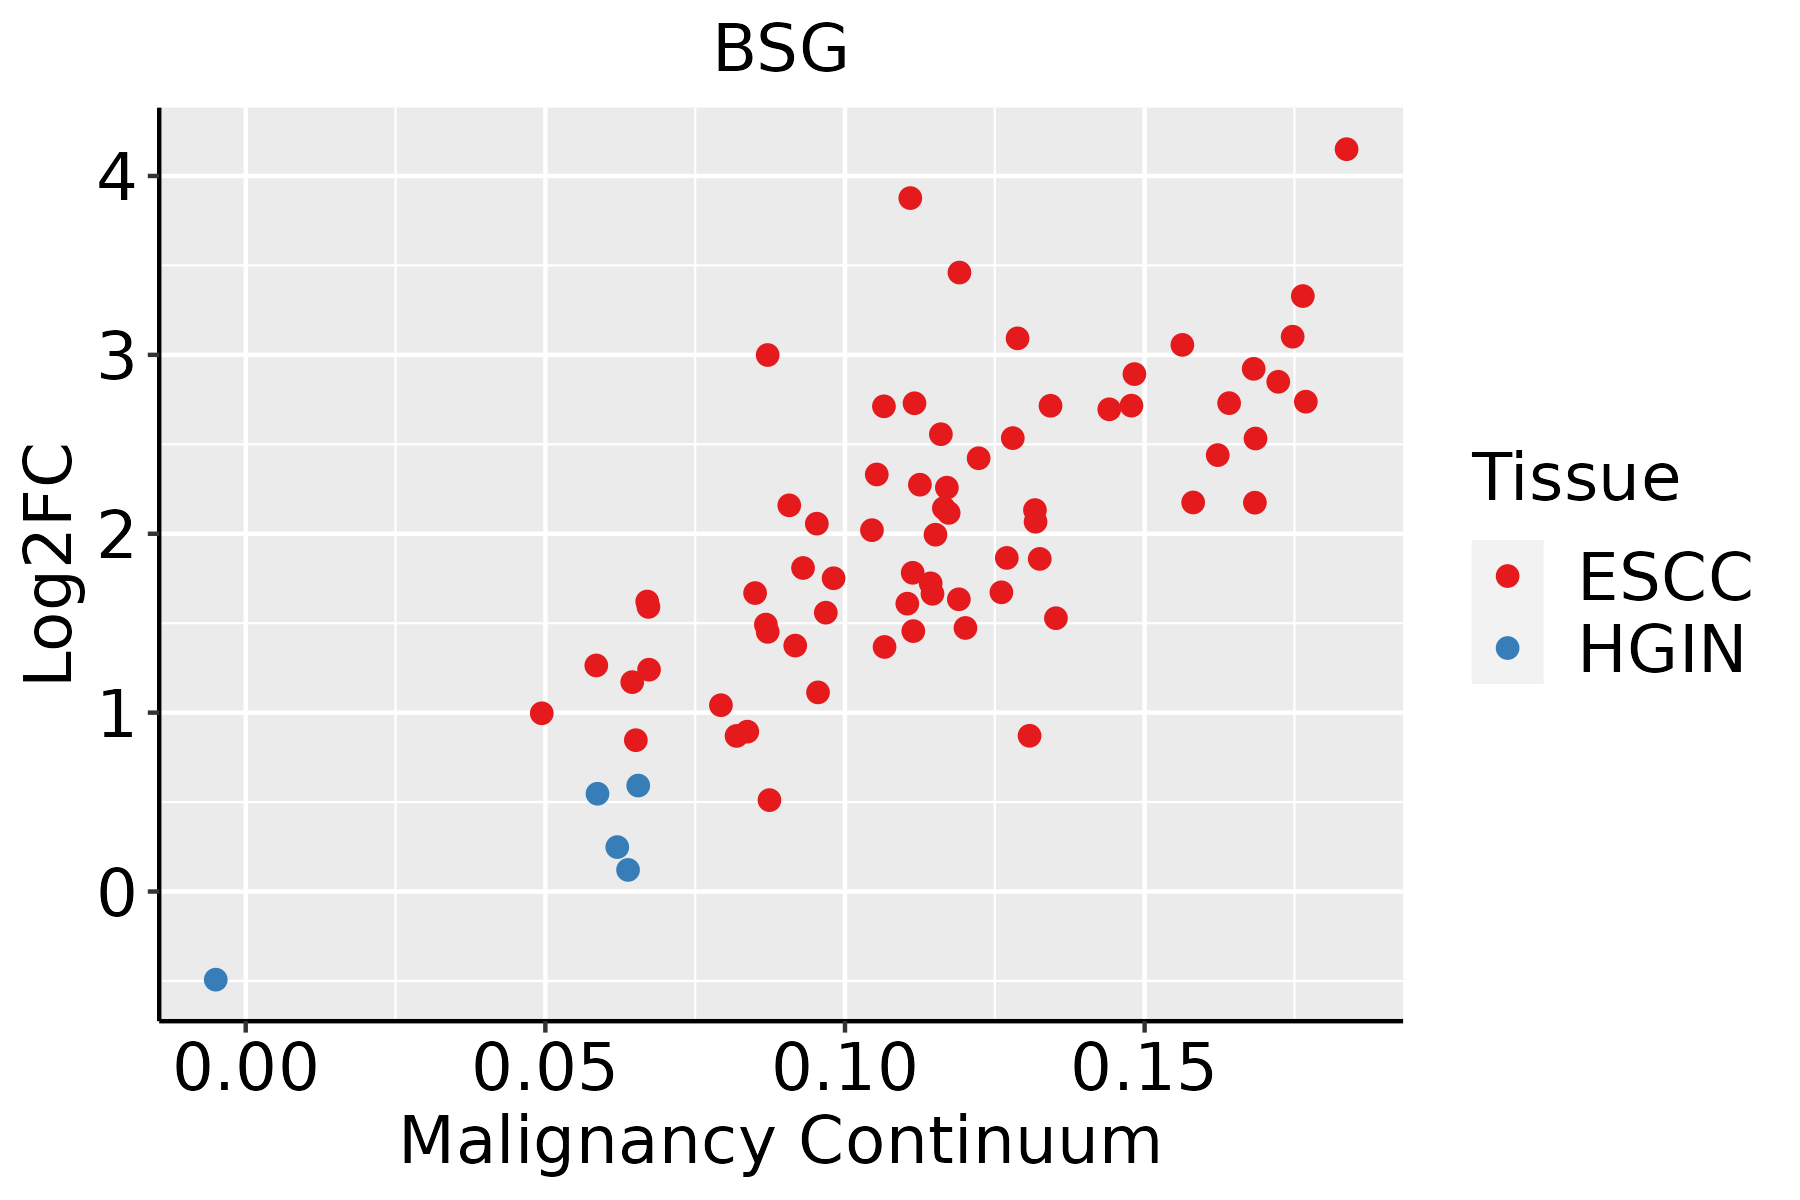 | ESCC: Esophageal squamous cell carcinoma |
| HGIN: High-grade intraepithelial neoplasias | ||
| LGIN: Low-grade intraepithelial neoplasias | ||
| Liver | 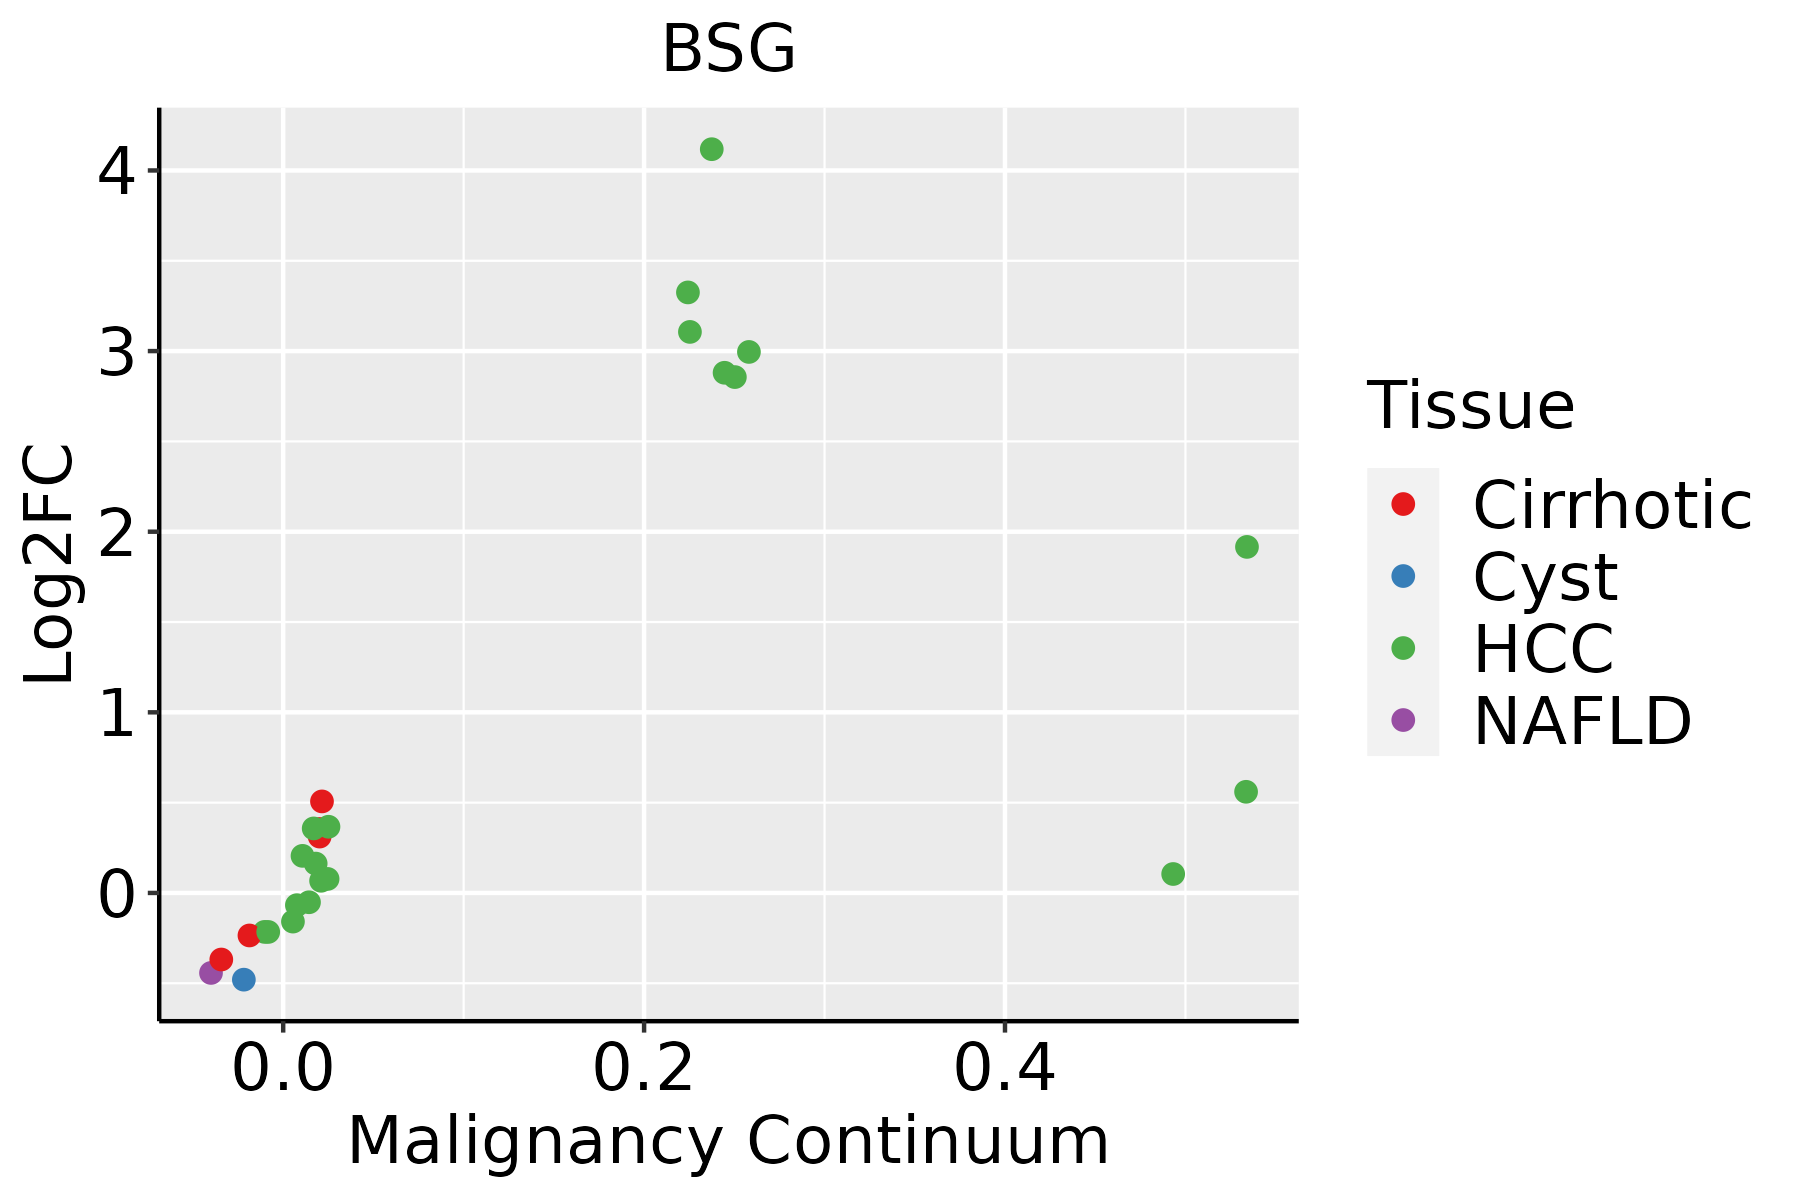 | HCC: Hepatocellular carcinoma |
| NAFLD: Non-alcoholic fatty liver disease | ||
| Oral Cavity | 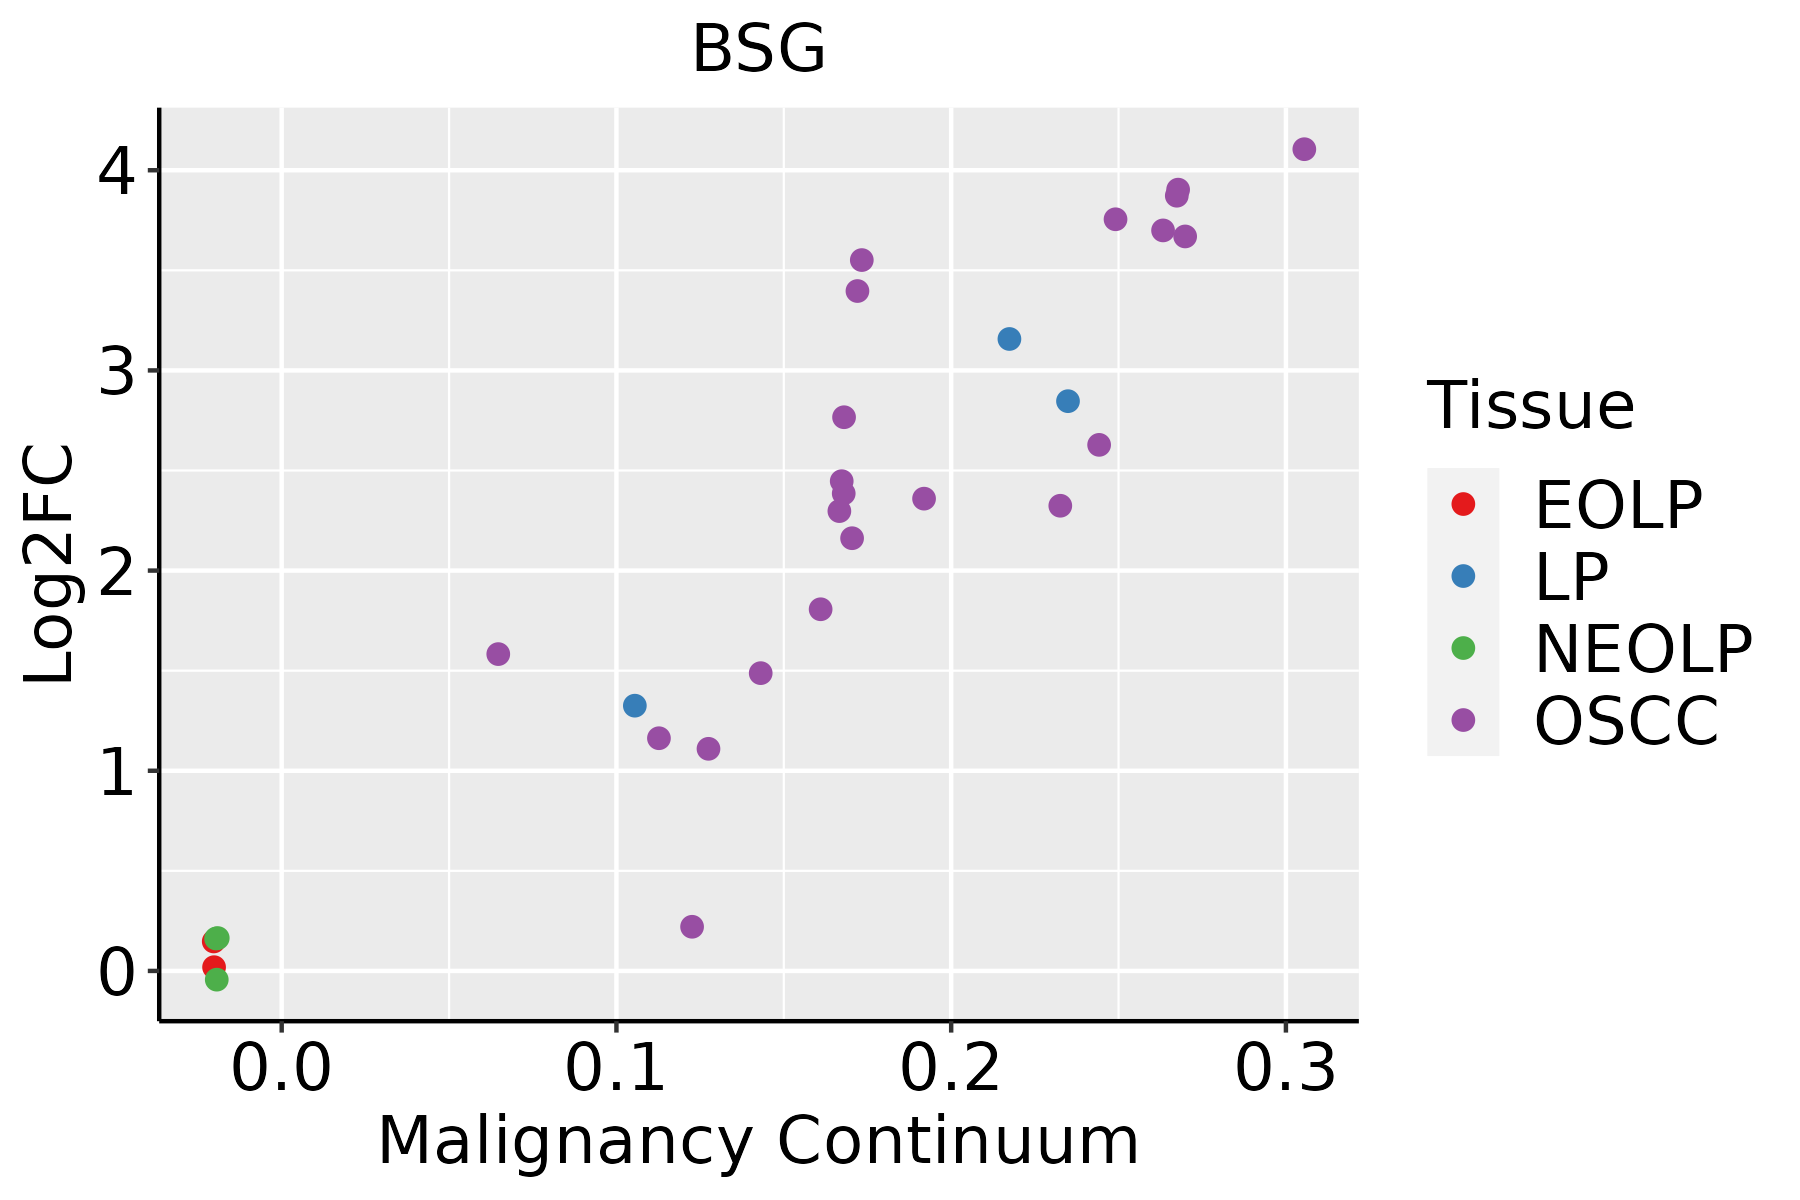 | EOLP: Erosive Oral lichen planus |
| LP: leukoplakia | ||
| NEOLP: Non-erosive oral lichen planus | ||
| OSCC: Oral squamous cell carcinoma | ||
| Prostate | 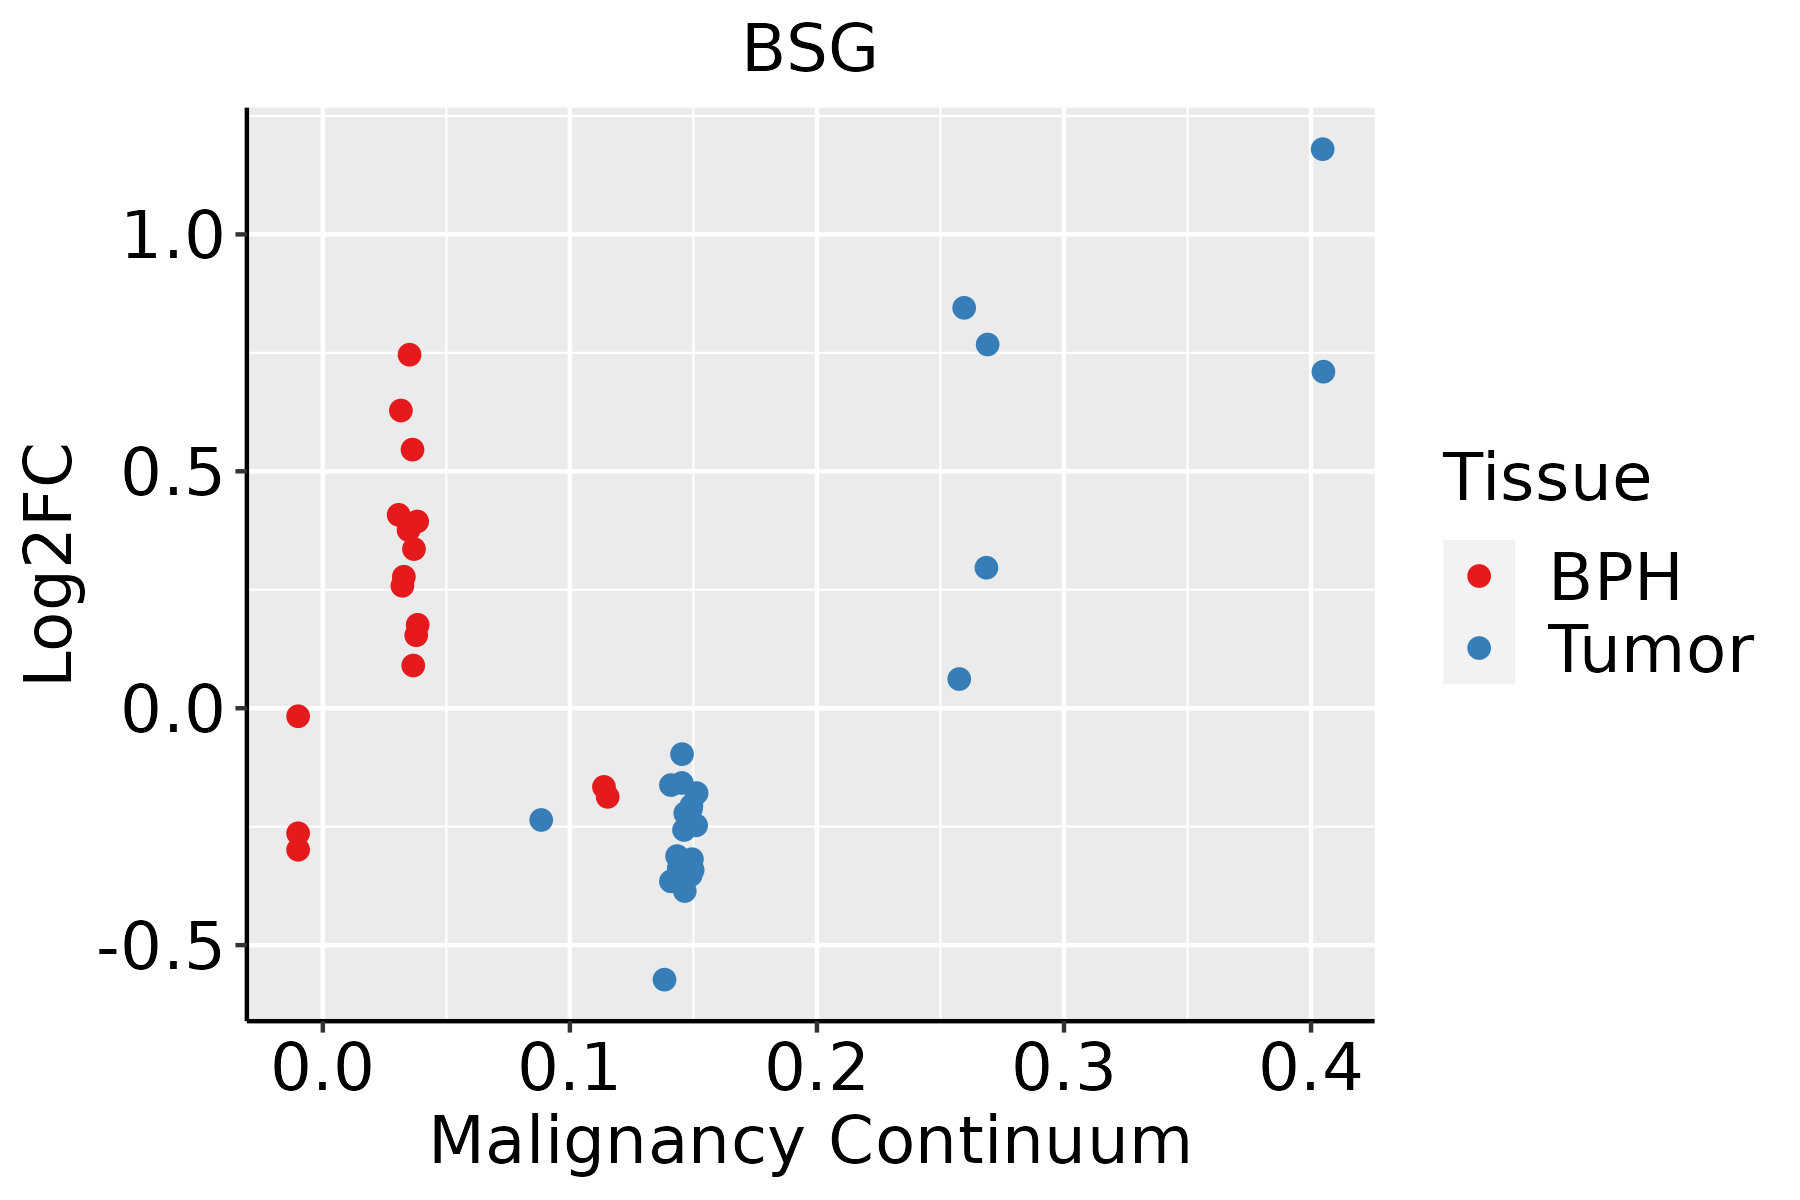 | BPH: Benign Prostatic Hyperplasia |
| Skin | 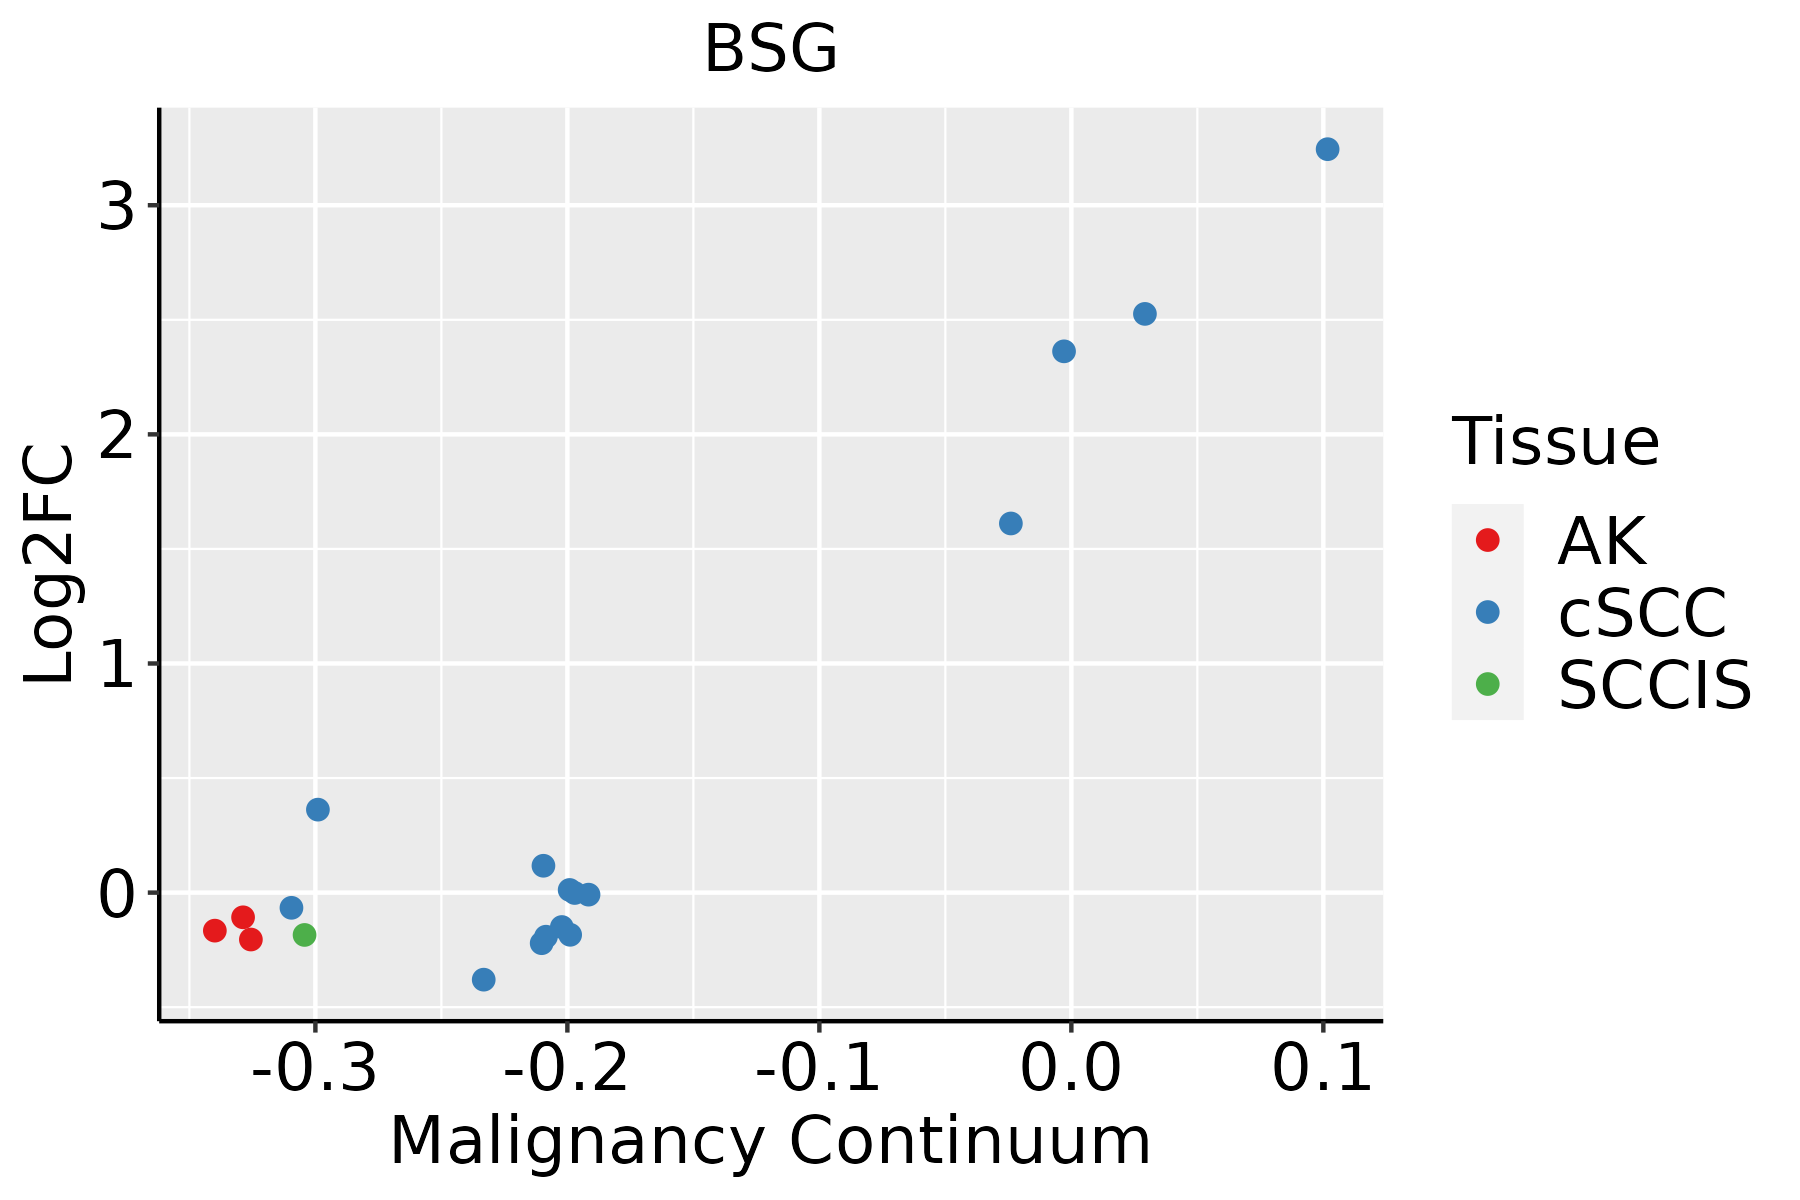 | AK: Actinic keratosis |
| cSCC: Cutaneous squamous cell carcinoma | ||
| SCCIS:squamous cell carcinoma in situ | ||
| Thyroid | 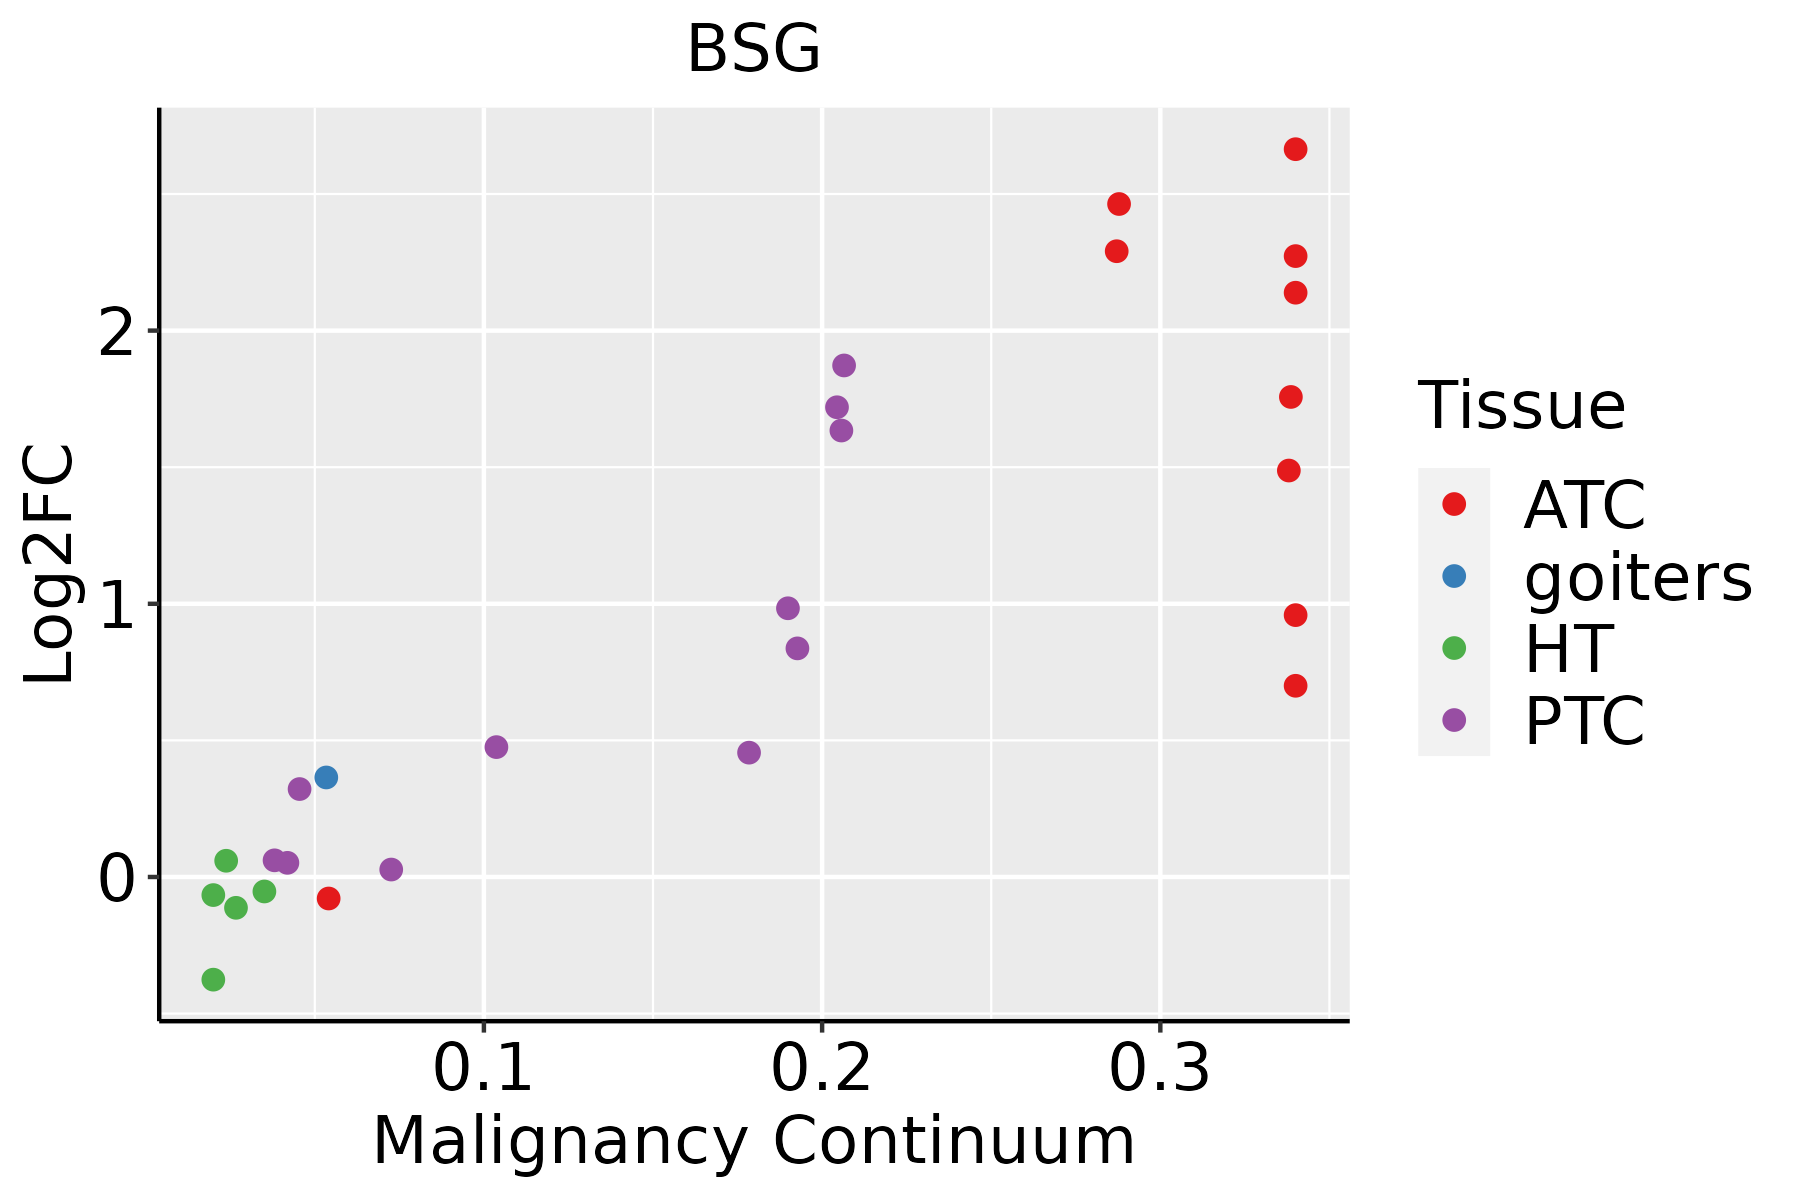 | ATC: Anaplastic thyroid cancer |
| HT: Hashimoto's thyroiditis | ||
| PTC: Papillary thyroid cancer |
| ∗log2FC in expression of this searched gene in stem-like cells from each diseased tissue sample relative to stem-like cells in normal samples in each tissue plotted against the malignancy continuum. Samples are colored based on if they are from different disease stage. |
Top |
Malignant transformation related pathway analysis |
| Find out the enriched GO biological processes and KEGG pathways involved in transition from healthy to precancer to cancer |
| Tissue | Disease Stage | Enriched GO biological Processes |
| Colorectum | AD |  |
| Colorectum | SER |  |
| Colorectum | MSS |  |
| Colorectum | MSI-H |  |
| Colorectum | FAP |  |
| ∗Top 15 enriched GO BP terms are showed in the bar plot of each disease state in each tissue. Each row represents a significant GO biological process which is colored according to the -log10(p.adjust). |
| Page: 1 2 3 4 5 6 7 8 9 |
| GO ID | Tissue | Disease Stage | Description | Gene Ratio | Bg Ratio | pvalue | p.adjust | Count |
| GO:004669711 | Endometrium | EEC | decidualization | 8/2168 | 26/18723 | 7.31e-03 | 4.15e-02 | 8 |
| GO:00716219 | Endometrium | EEC | granulocyte chemotaxis | 24/2168 | 125/18723 | 8.60e-03 | 4.70e-02 | 24 |
| GO:0016032111 | Esophagus | ESCC | viral process | 301/8552 | 415/18723 | 3.34e-29 | 1.32e-26 | 301 |
| GO:0019058111 | Esophagus | ESCC | viral life cycle | 226/8552 | 317/18723 | 1.17e-20 | 1.76e-18 | 226 |
| GO:0072659110 | Esophagus | ESCC | protein localization to plasma membrane | 193/8552 | 284/18723 | 1.95e-14 | 1.03e-12 | 193 |
| GO:199077819 | Esophagus | ESCC | protein localization to cell periphery | 217/8552 | 333/18723 | 4.08e-13 | 1.88e-11 | 217 |
| GO:0044403111 | Esophagus | ESCC | biological process involved in symbiotic interaction | 186/8552 | 290/18723 | 1.43e-10 | 4.16e-09 | 186 |
| GO:0051701111 | Esophagus | ESCC | biological process involved in interaction with host | 135/8552 | 203/18723 | 1.49e-09 | 3.49e-08 | 135 |
| GO:0052126111 | Esophagus | ESCC | movement in host environment | 117/8552 | 175/18723 | 1.14e-08 | 2.26e-07 | 117 |
| GO:0001890110 | Esophagus | ESCC | placenta development | 98/8552 | 144/18723 | 4.46e-08 | 8.11e-07 | 98 |
| GO:0061458110 | Esophagus | ESCC | reproductive system development | 247/8552 | 427/18723 | 2.24e-07 | 3.42e-06 | 247 |
| GO:004860818 | Esophagus | ESCC | reproductive structure development | 245/8552 | 424/18723 | 2.82e-07 | 4.14e-06 | 245 |
| GO:0043434111 | Esophagus | ESCC | response to peptide hormone | 234/8552 | 414/18723 | 4.93e-06 | 5.21e-05 | 234 |
| GO:0044409111 | Esophagus | ESCC | entry into host | 96/8552 | 151/18723 | 6.73e-06 | 6.84e-05 | 96 |
| GO:00018937 | Esophagus | ESCC | maternal placenta development | 28/8552 | 35/18723 | 3.40e-05 | 2.78e-04 | 28 |
| GO:001003827 | Esophagus | ESCC | response to metal ion | 208/8552 | 373/18723 | 5.02e-05 | 3.90e-04 | 208 |
| GO:004671827 | Esophagus | ESCC | viral entry into host cell | 89/8552 | 144/18723 | 6.84e-05 | 5.18e-04 | 89 |
| GO:006156415 | Esophagus | ESCC | axon development | 251/8552 | 467/18723 | 2.41e-04 | 1.49e-03 | 251 |
| GO:00466975 | Esophagus | ESCC | decidualization | 21/8552 | 26/18723 | 2.69e-04 | 1.63e-03 | 21 |
| GO:00601357 | Esophagus | ESCC | maternal process involved in female pregnancy | 40/8552 | 62/18723 | 2.14e-03 | 9.54e-03 | 40 |
| Page: 1 2 3 4 5 6 7 8 9 10 11 12 13 14 15 16 17 18 19 20 |
| Pathway ID | Tissue | Disease Stage | Description | Gene Ratio | Bg Ratio | pvalue | p.adjust | qvalue | Count |
| Page: 1 |
Top |
Cell-cell communication analysis |
| Identification of potential cell-cell interactions between two cell types and their ligand-receptor pairs for different disease states |
| Ligand | Receptor | LRpair | Pathway | Tissue | Disease Stage |
| Page: 1 |
Top |
Single-cell gene regulatory network inference analysis |
| Find out the significant the regulons (TFs) and the target genes of each regulon across cell types for different disease states |
| TF | Cell Type | Tissue | Disease Stage | Target Gene | RSS | Regulon Activity |
| ∗The dot plots of a searched regulon are shown for all cell subpopulations in each disease state of each tissue based on the regulon specific score inferred using pySCENIC and by calculating the average expression. |
| Page: 1 |
Top |
Somatic mutation of malignant transformation related genes |
| Annotation of somatic variants for genes involved in malignant transformation |
| Hugo Symbol | Variant Class | Variant Classification | dbSNP RS | HGVSc | HGVSp | HGVSp Short | SWISSPROT | BIOTYPE | SIFT | PolyPhen | Tumor Sample Barcode | Tissue | Histology | Sex | Age | Stage | Therapy Types | Drugs | Outcome |
| BSG | SNV | Missense_Mutation | c.620C>T | p.Pro207Leu | p.P207L | P35613 | protein_coding | tolerated(0.47) | probably_damaging(0.915) | TCGA-A1-A0SP-01 | Breast | breast invasive carcinoma | Female | <65 | I/II | Chemotherapy | SD | ||
| BSG | SNV | Missense_Mutation | novel | c.121G>C | p.Glu41Gln | p.E41Q | P35613 | protein_coding | deleterious(0.04) | benign(0.282) | TCGA-OL-A5DA-01 | Breast | breast invasive carcinoma | Female | <65 | I/II | Unknown | Unknown | SD |
| BSG | SNV | Missense_Mutation | c.688G>C | p.Glu230Gln | p.E230Q | P35613 | protein_coding | deleterious(0) | probably_damaging(0.998) | TCGA-JW-A5VL-01 | Cervix | cervical & endocervical cancer | Female | <65 | I/II | Unknown | Unknown | SD | |
| BSG | SNV | Missense_Mutation | novel | c.1000G>A | p.Glu334Lys | p.E334K | P35613 | protein_coding | deleterious(0) | probably_damaging(0.999) | TCGA-JW-A5VL-01 | Cervix | cervical & endocervical cancer | Female | <65 | I/II | Unknown | Unknown | SD |
| BSG | SNV | Missense_Mutation | novel | c.862G>C | p.Glu288Gln | p.E288Q | P35613 | protein_coding | tolerated(0.58) | benign(0.003) | TCGA-MA-AA41-01 | Cervix | cervical & endocervical cancer | Female | <65 | I/II | Unknown | Unknown | SD |
| BSG | SNV | Missense_Mutation | novel | c.8C>T | p.Ala3Val | p.A3V | P35613 | protein_coding | tolerated(0.34) | benign(0.02) | TCGA-AD-5900-01 | Colorectum | colon adenocarcinoma | Male | >=65 | I/II | Unknown | Unknown | SD |
| BSG | SNV | Missense_Mutation | c.238N>T | p.His80Tyr | p.H80Y | P35613 | protein_coding | tolerated(0.06) | possibly_damaging(0.686) | TCGA-CK-4951-01 | Colorectum | colon adenocarcinoma | Female | >=65 | I/II | Unknown | Unknown | PD | |
| BSG | SNV | Missense_Mutation | rs780701101 | c.386N>A | p.Arg129His | p.R129H | P35613 | protein_coding | tolerated(0.05) | benign(0.074) | TCGA-F4-6570-01 | Colorectum | colon adenocarcinoma | Female | >=65 | I/II | Unknown | Unknown | SD |
| BSG | SNV | Missense_Mutation | c.968N>T | p.Ala323Val | p.A323V | P35613 | protein_coding | deleterious(0) | probably_damaging(0.999) | TCGA-G4-6302-01 | Colorectum | colon adenocarcinoma | Female | >=65 | I/II | Unknown | Unknown | SD | |
| BSG | deletion | Frame_Shift_Del | c.519delN | p.Gly175AlafsTer4 | p.G175Afs*4 | P35613 | protein_coding | TCGA-CK-6746-01 | Colorectum | colon adenocarcinoma | Female | >=65 | I/II | Unknown | Unknown | SD |
| Page: 1 2 3 4 |
Top |
Related drugs of malignant transformation related genes |
| Identification of chemicals and drugs interact with genes involved in malignant transfromation |
| (DGIdb 4.0) |
| Entrez ID | Symbol | Category | Interaction Types | Drug Claim Name | Drug Name | PMIDs |
| 682 | BSG | DRUGGABLE GENOME, TRANSPORTER | [131I]-Metuximab injection | |||
| 682 | BSG | DRUGGABLE GENOME, TRANSPORTER | Gavilimomab | GAVILIMOMAB | ||
| 682 | BSG | DRUGGABLE GENOME, TRANSPORTER | CHEMBL2109193 | GAVILIMOMAB | ||
| 682 | BSG | DRUGGABLE GENOME, TRANSPORTER | antibody | 405560467 |
| Page: 1 |

Copyright 2023-Present -The University of Texas Health Science Center at Houston |