| Tissue | Expression Dynamics | Abbreviation |
| Breast | 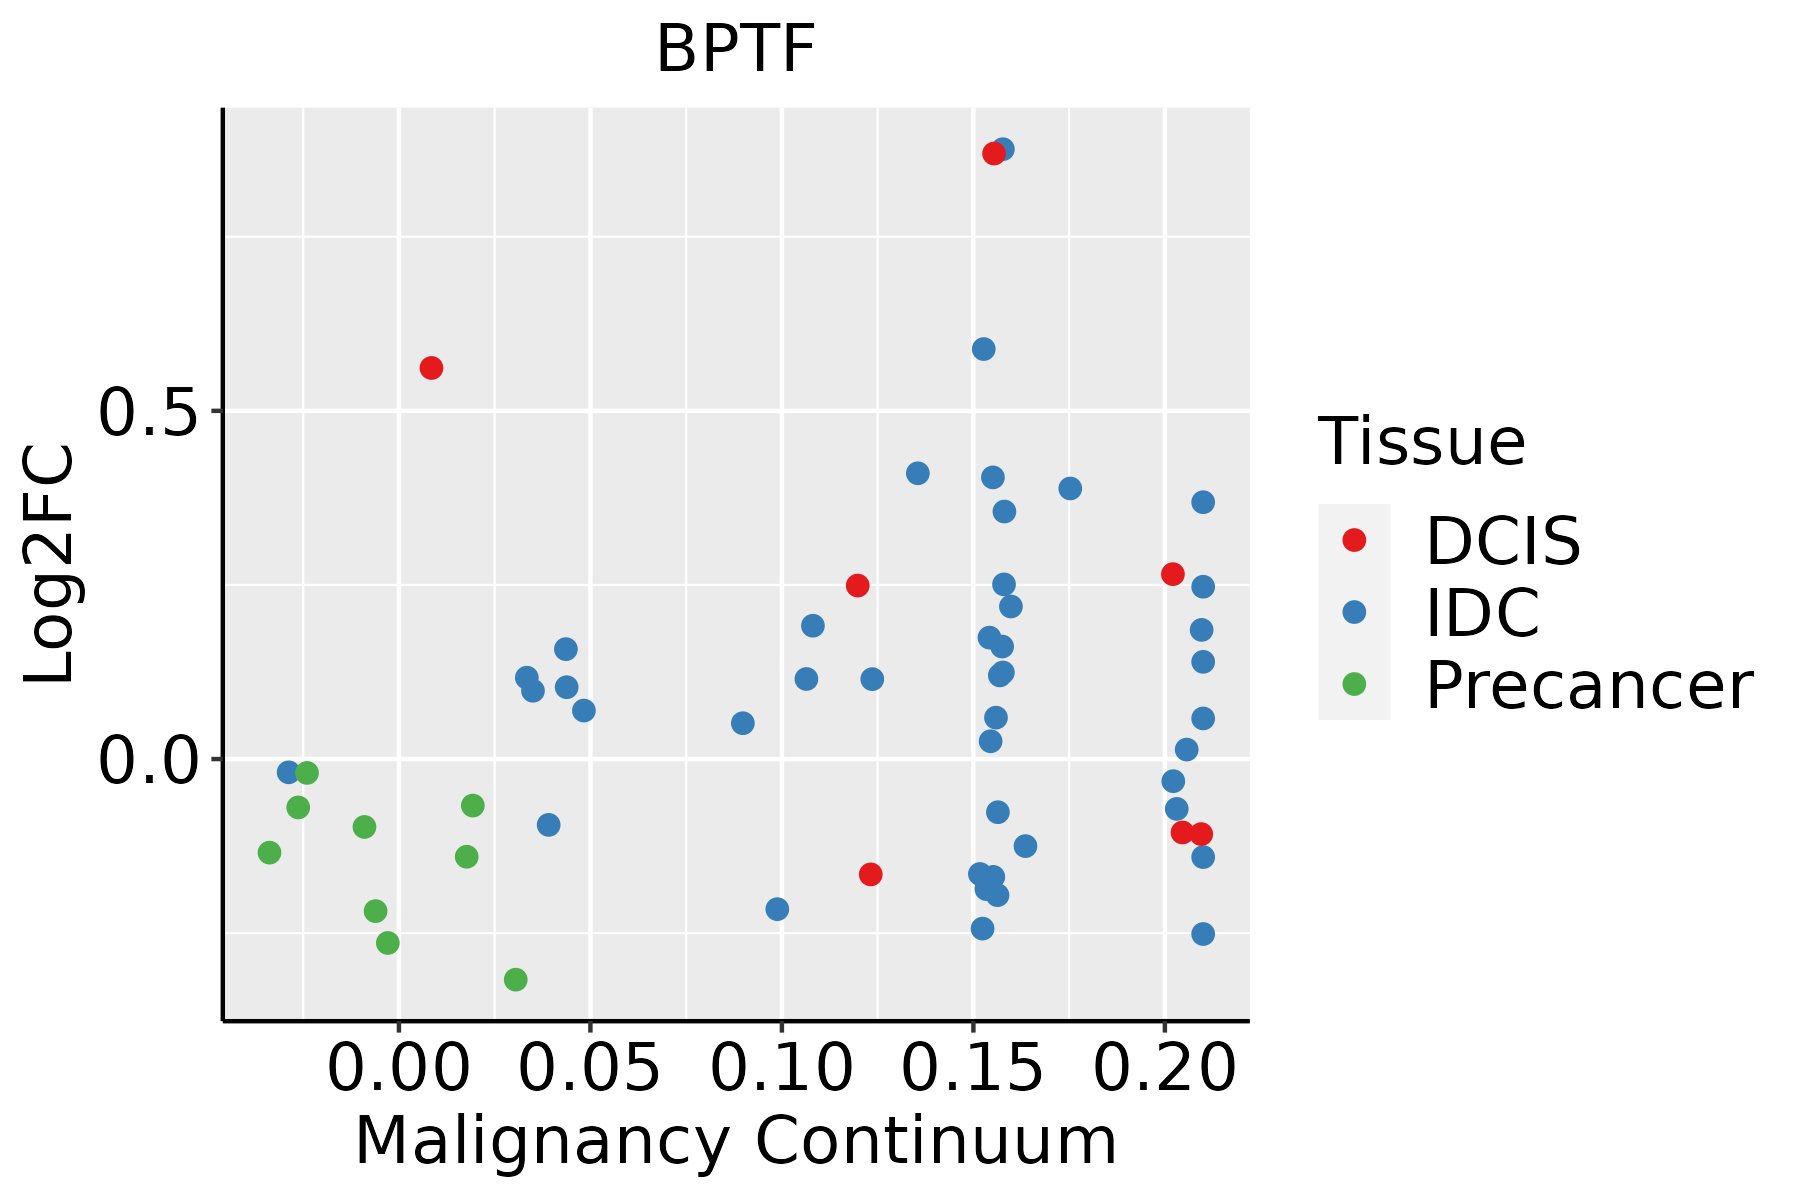 | IDC: Invasive ductal carcinoma |
| DCIS: Ductal carcinoma in situ |
| Precancer(BRCA1-mut): Precancerous lesion from BRCA1 mutation carriers |
| Cervix |  | CC: Cervix cancer |
| HSIL_HPV: HPV-infected high-grade squamous intraepithelial lesions |
| N_HPV: HPV-infected normal cervix |
| Colorectum (GSE201348) | 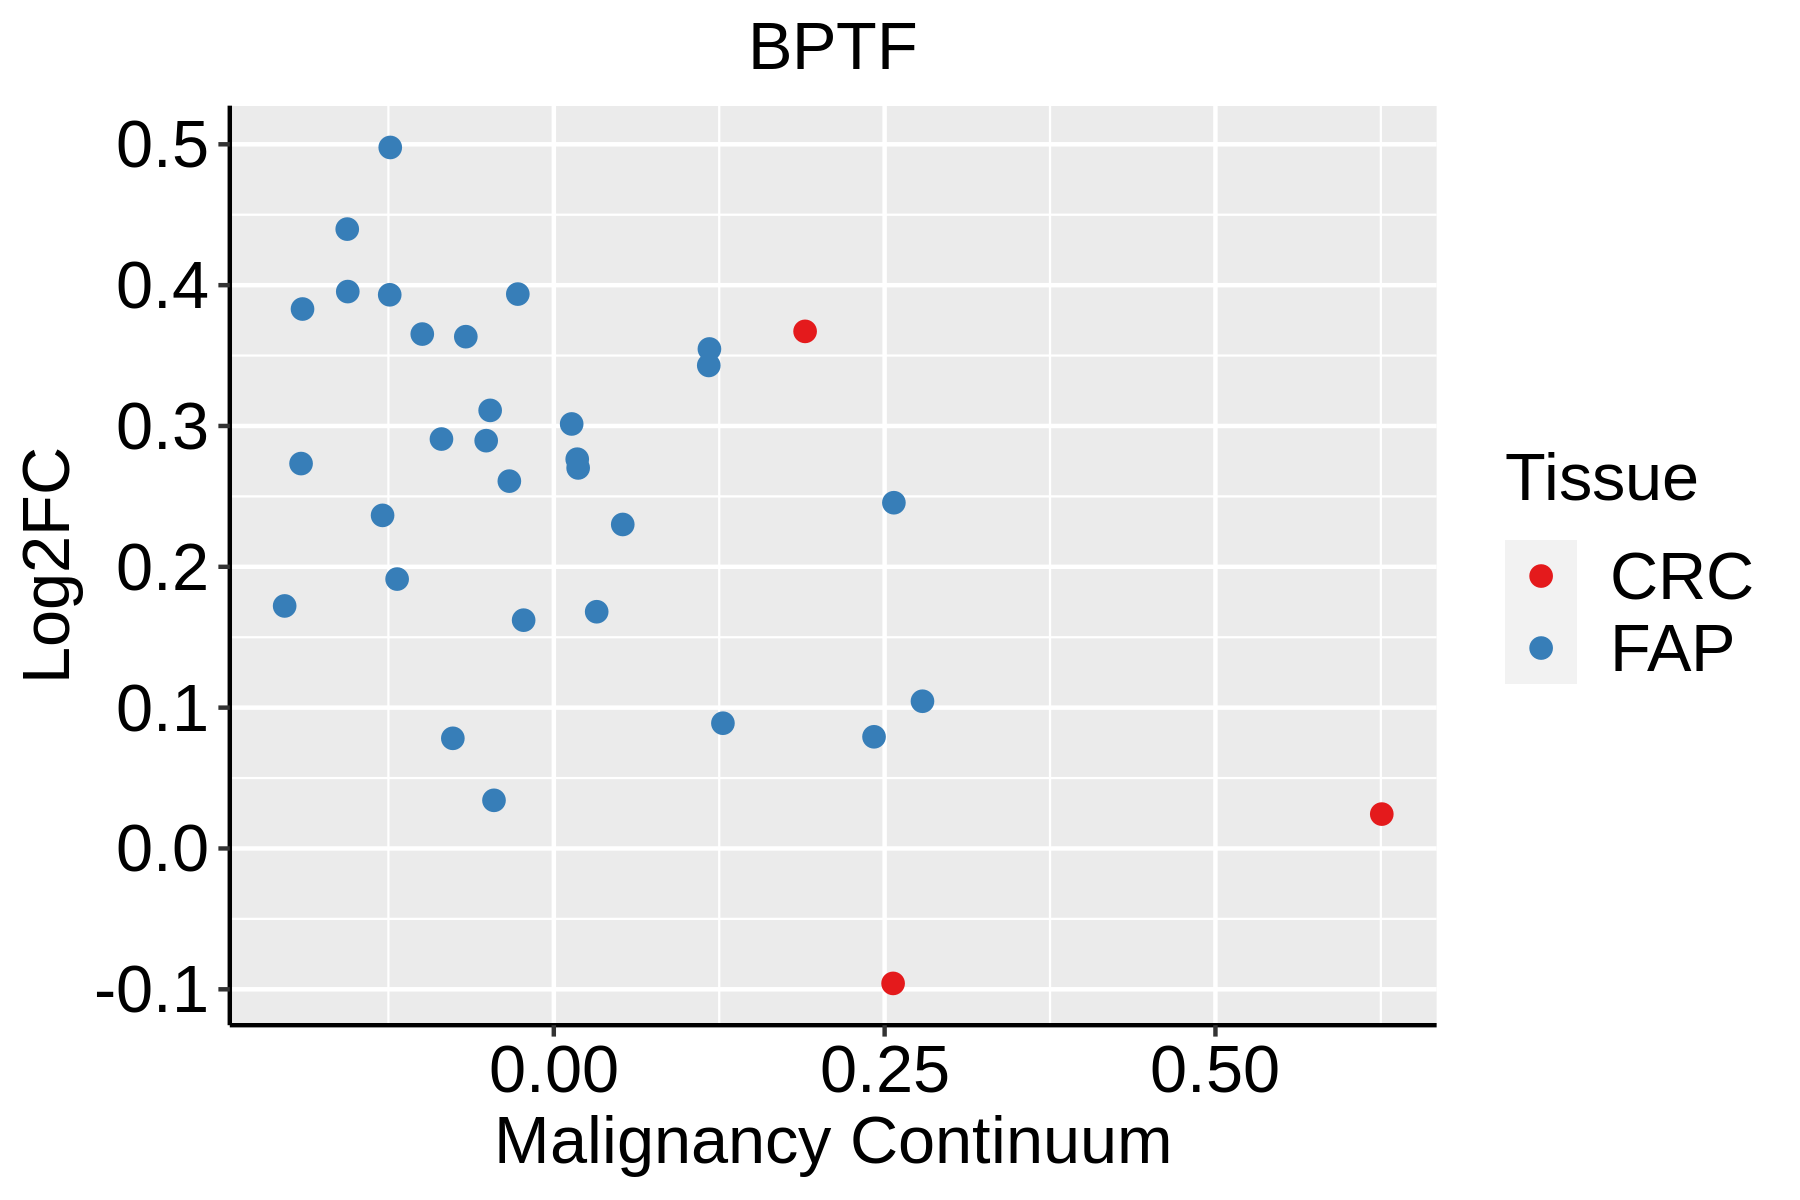 | FAP: Familial adenomatous polyposis |
| CRC: Colorectal cancer |
| Colorectum (HTA11) |  | AD: Adenomas |
| SER: Sessile serrated lesions |
| MSI-H: Microsatellite-high colorectal cancer |
| MSS: Microsatellite stable colorectal cancer |
| Esophagus |  | ESCC: Esophageal squamous cell carcinoma |
| HGIN: High-grade intraepithelial neoplasias |
| LGIN: Low-grade intraepithelial neoplasias |
| Liver | 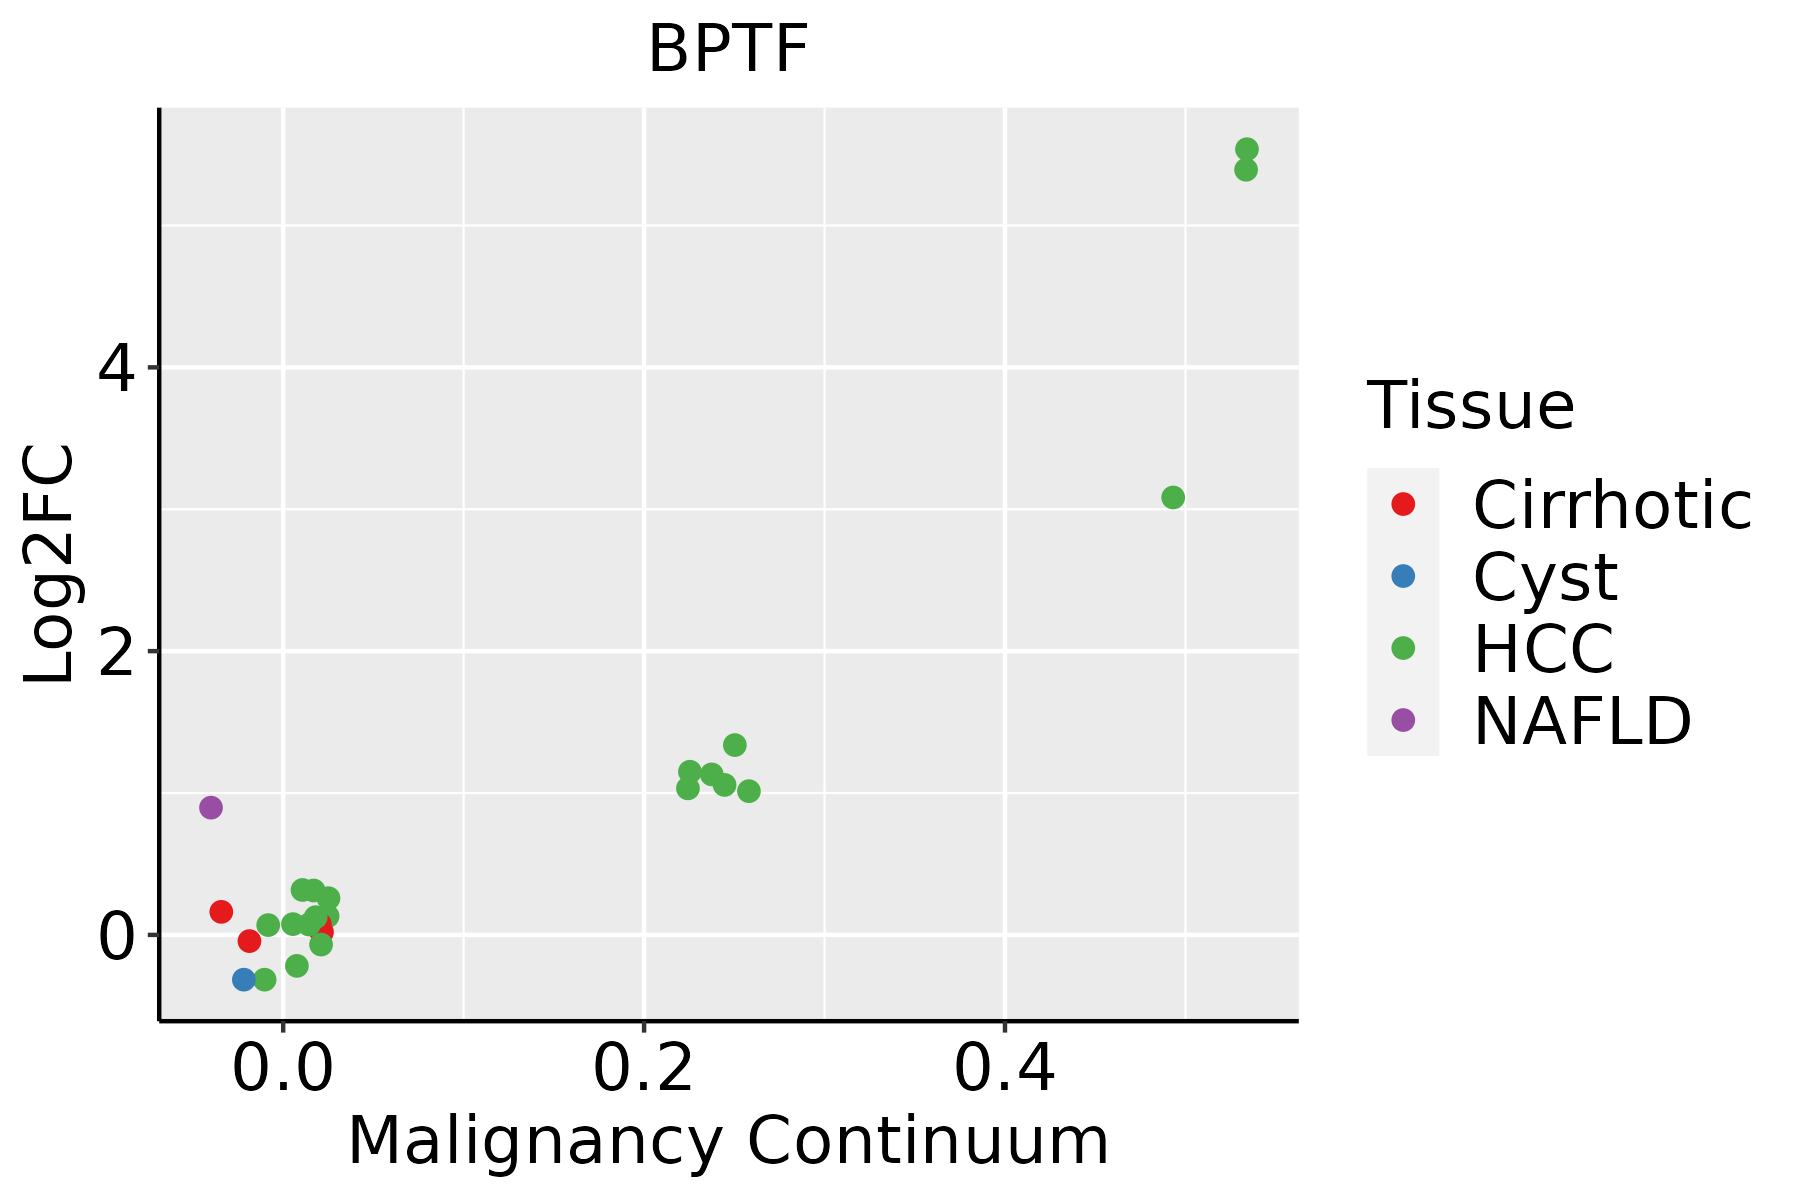 | HCC: Hepatocellular carcinoma |
| NAFLD: Non-alcoholic fatty liver disease |
| Lung |  | AAH: Atypical adenomatous hyperplasia |
| AIS: Adenocarcinoma in situ |
| IAC: Invasive lung adenocarcinoma |
| MIA: Minimally invasive adenocarcinoma |
| Oral Cavity | 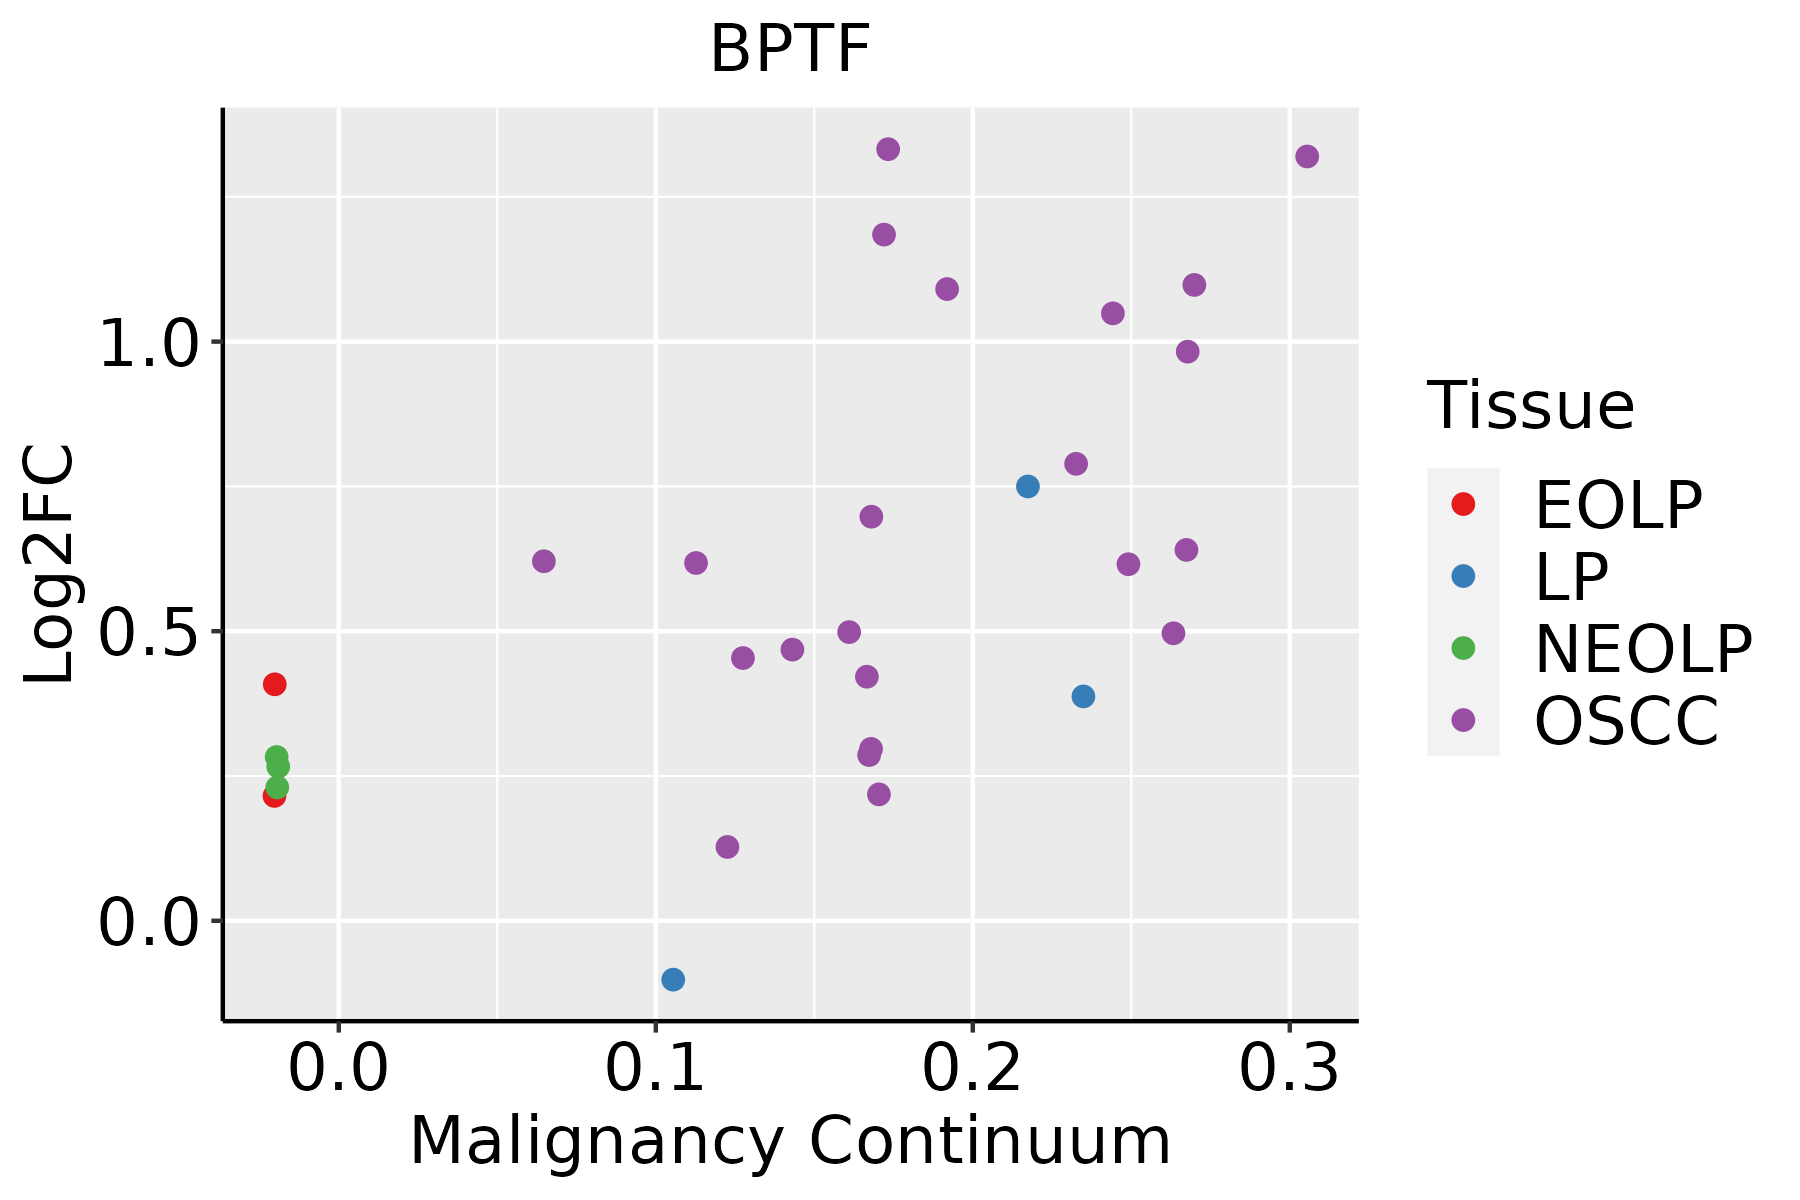 | EOLP: Erosive Oral lichen planus |
| LP: leukoplakia |
| NEOLP: Non-erosive oral lichen planus |
| OSCC: Oral squamous cell carcinoma |
| Prostate | 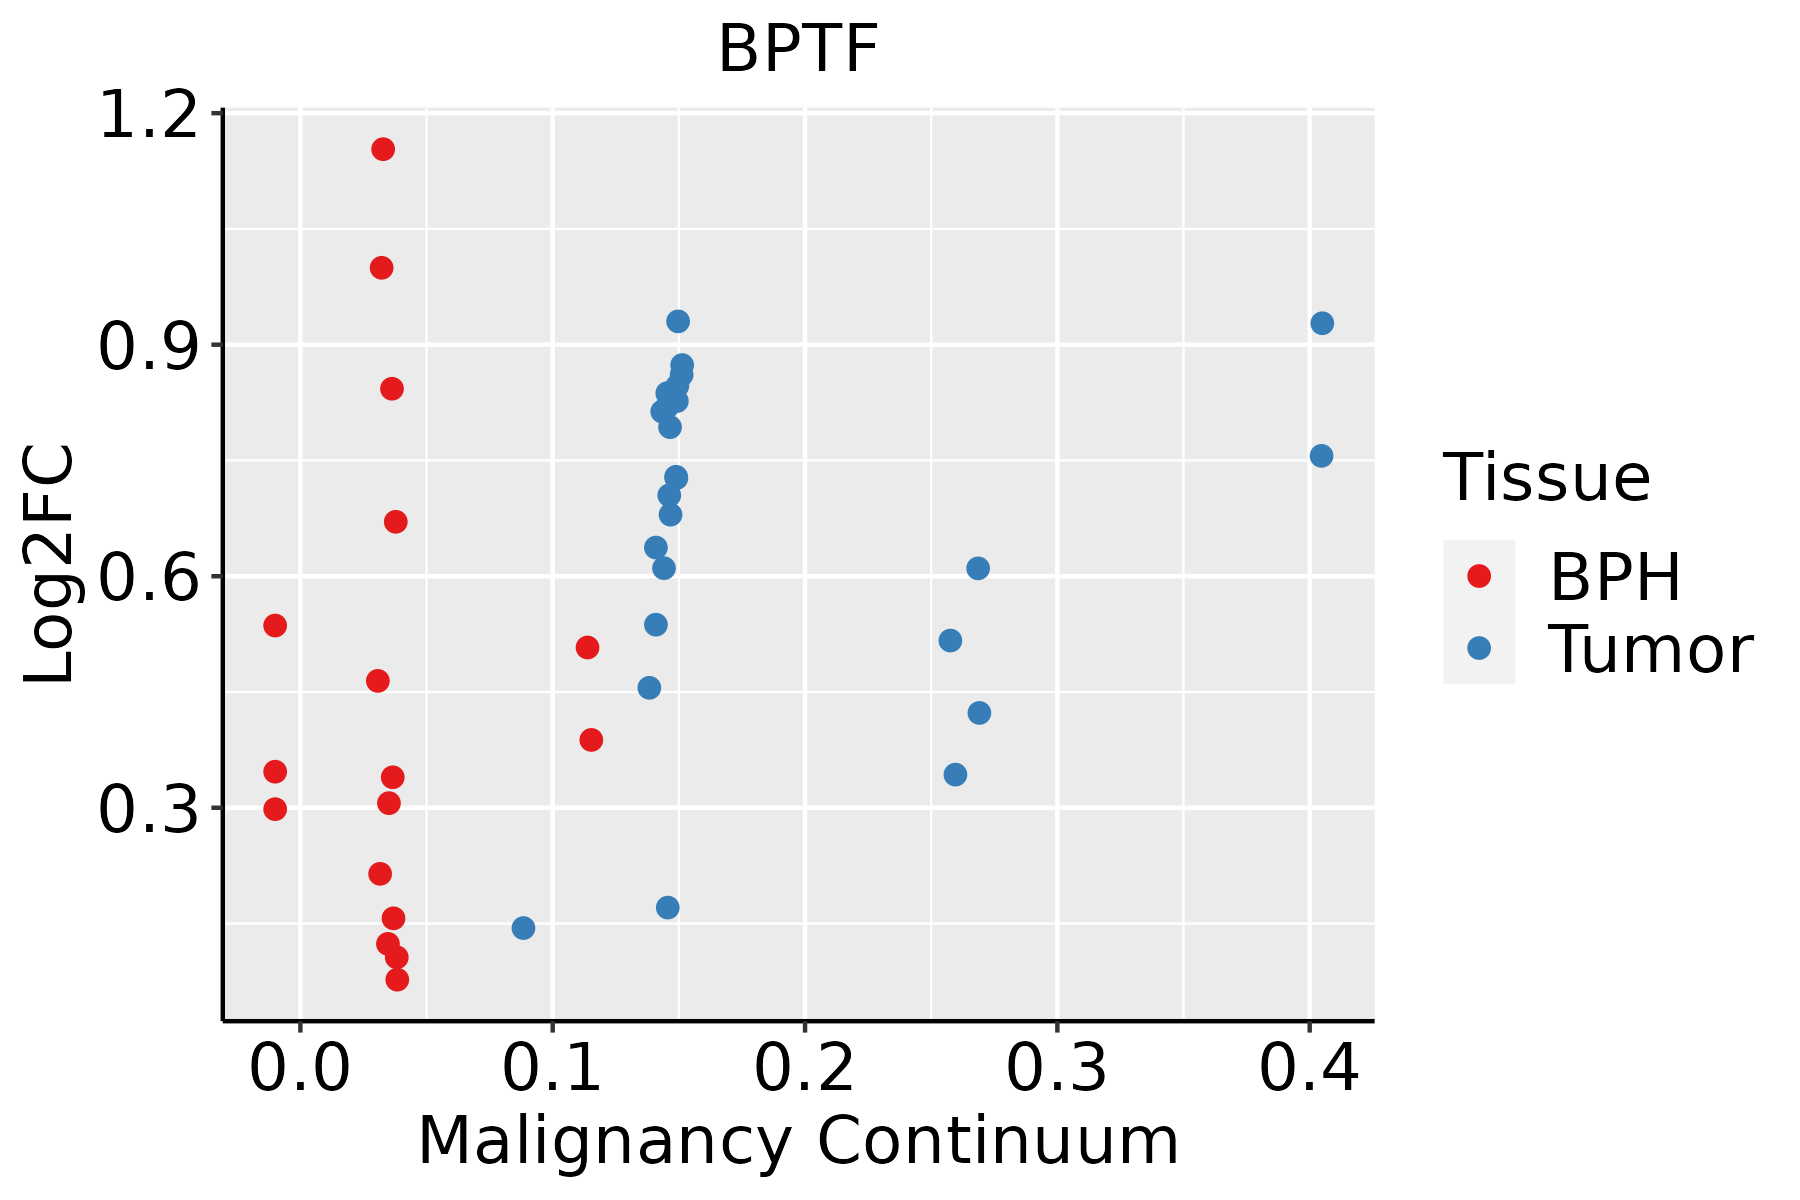 | BPH: Benign Prostatic Hyperplasia |
| Skin | 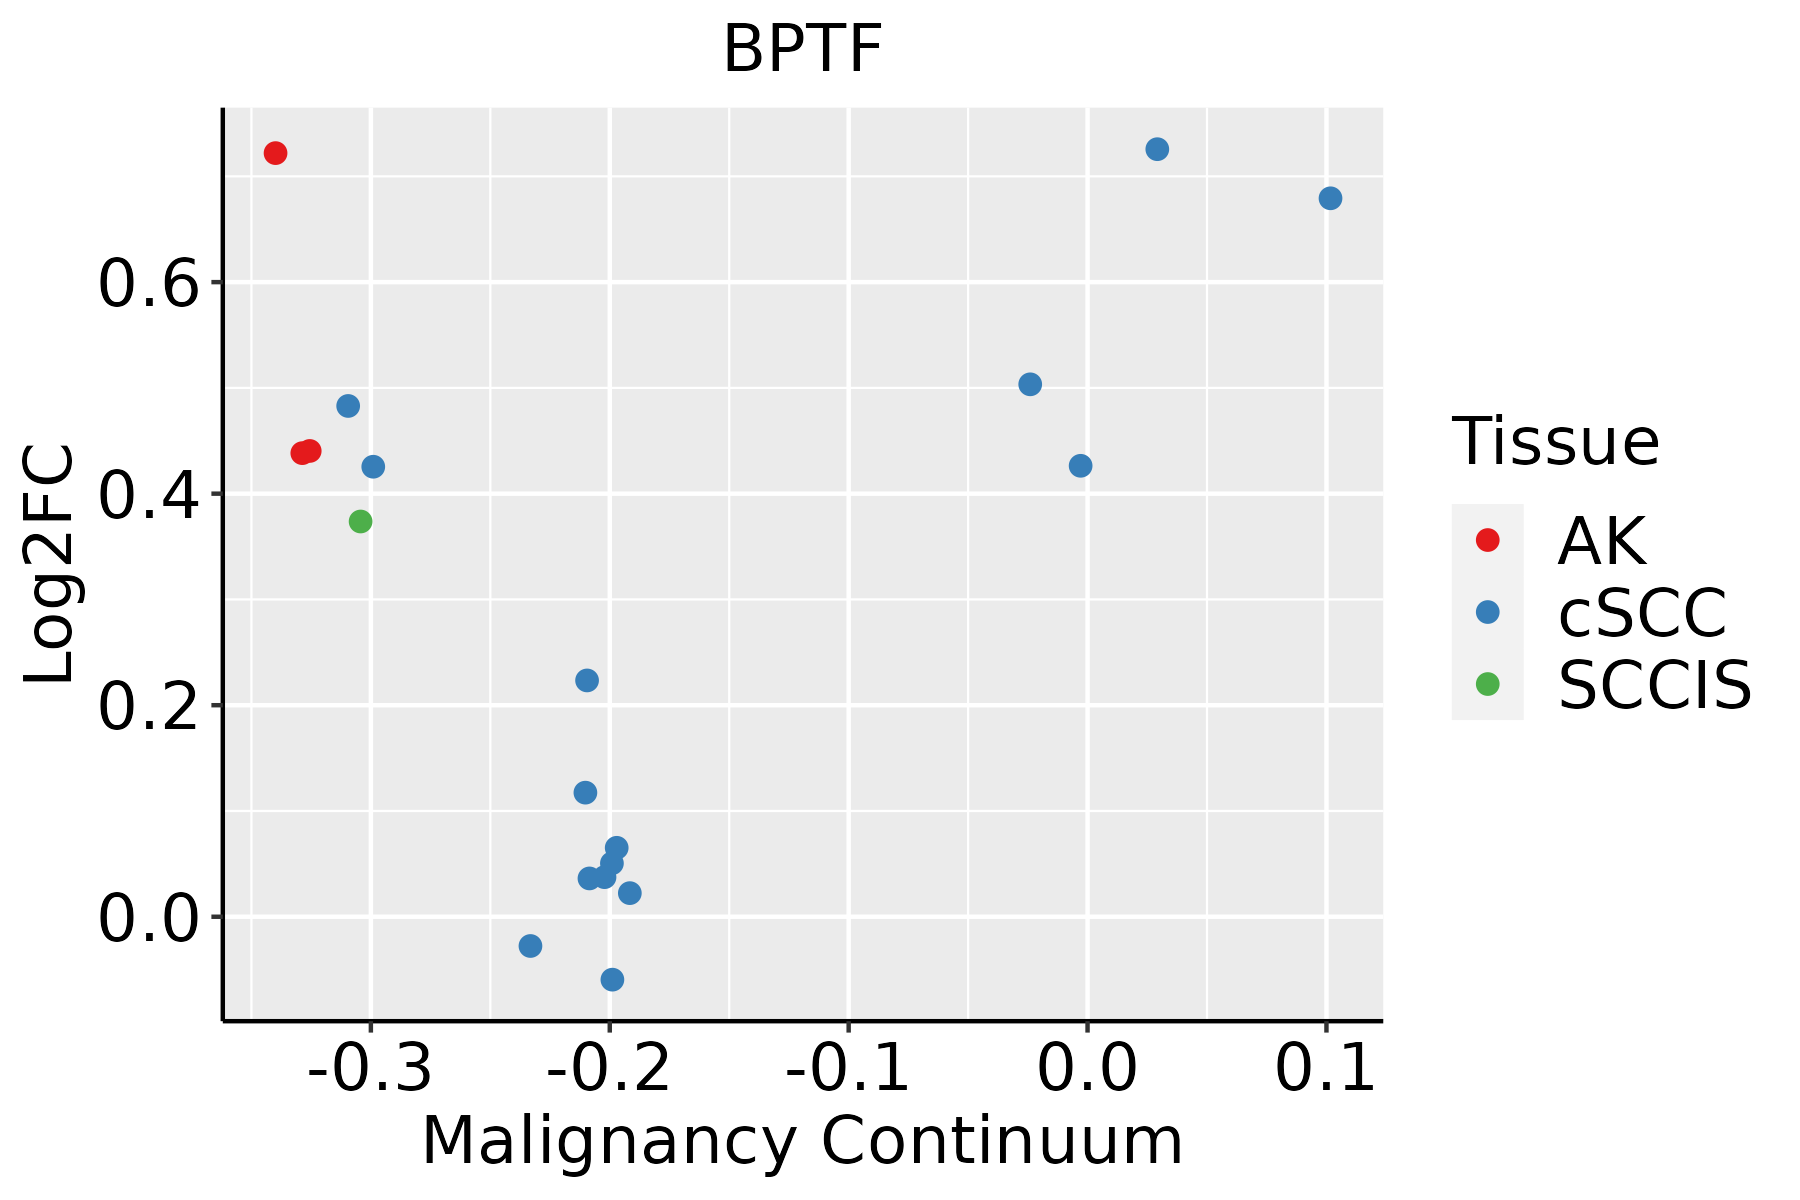 | AK: Actinic keratosis |
| cSCC: Cutaneous squamous cell carcinoma |
| SCCIS:squamous cell carcinoma in situ |
| Thyroid |  | ATC: Anaplastic thyroid cancer |
| HT: Hashimoto's thyroiditis |
| PTC: Papillary thyroid cancer |
| GO ID | Tissue | Disease Stage | Description | Gene Ratio | Bg Ratio | pvalue | p.adjust | Count |
| GO:000189231 | Oral cavity | NEOLP | embryonic placenta development | 27/2005 | 82/18723 | 5.12e-08 | 2.08e-06 | 27 |
| GO:000749221 | Oral cavity | NEOLP | endoderm development | 22/2005 | 77/18723 | 1.19e-05 | 2.17e-04 | 22 |
| GO:000632521 | Oral cavity | NEOLP | chromatin organization | 70/2005 | 409/18723 | 4.97e-05 | 6.83e-04 | 70 |
| GO:00485686 | Oral cavity | NEOLP | embryonic organ development | 71/2005 | 427/18723 | 1.12e-04 | 1.34e-03 | 71 |
| GO:199009022 | Oral cavity | NEOLP | cellular response to nerve growth factor stimulus | 14/2005 | 53/18723 | 1.06e-03 | 8.06e-03 | 14 |
| GO:199008923 | Oral cavity | NEOLP | response to nerve growth factor | 14/2005 | 56/18723 | 1.89e-03 | 1.28e-02 | 14 |
| GO:006145810 | Prostate | BPH | reproductive system development | 126/3107 | 427/18723 | 1.35e-11 | 9.95e-10 | 126 |
| GO:004860810 | Prostate | BPH | reproductive structure development | 124/3107 | 424/18723 | 3.76e-11 | 2.43e-09 | 124 |
| GO:000170110 | Prostate | BPH | in utero embryonic development | 104/3107 | 367/18723 | 9.17e-09 | 3.10e-07 | 104 |
| GO:000189010 | Prostate | BPH | placenta development | 50/3107 | 144/18723 | 8.97e-08 | 2.20e-06 | 50 |
| GO:000189210 | Prostate | BPH | embryonic placenta development | 32/3107 | 82/18723 | 9.93e-07 | 1.80e-05 | 32 |
| GO:00063259 | Prostate | BPH | chromatin organization | 101/3107 | 409/18723 | 1.52e-05 | 1.94e-04 | 101 |
| GO:00074924 | Prostate | BPH | endoderm development | 28/3107 | 77/18723 | 2.21e-05 | 2.67e-04 | 28 |
| GO:19900898 | Prostate | BPH | response to nerve growth factor | 22/3107 | 56/18723 | 4.21e-05 | 4.48e-04 | 22 |
| GO:199009010 | Prostate | BPH | cellular response to nerve growth factor stimulus | 21/3107 | 53/18723 | 5.39e-05 | 5.50e-04 | 21 |
| GO:00063382 | Prostate | BPH | chromatin remodeling | 62/3107 | 255/18723 | 9.47e-04 | 5.97e-03 | 62 |
| GO:006145816 | Prostate | Tumor | reproductive system development | 133/3246 | 427/18723 | 1.24e-12 | 1.15e-10 | 133 |
| GO:004860815 | Prostate | Tumor | reproductive structure development | 131/3246 | 424/18723 | 3.48e-12 | 2.89e-10 | 131 |
| GO:000170115 | Prostate | Tumor | in utero embryonic development | 106/3246 | 367/18723 | 2.37e-08 | 8.09e-07 | 106 |
| GO:000189016 | Prostate | Tumor | placenta development | 52/3246 | 144/18723 | 4.96e-08 | 1.52e-06 | 52 |
| TF | Cell Type | Tissue | Disease Stage | Target Gene | RSS | Regulon Activity |
| BPTF | CD8TEFF | Breast | IDC | PLCG2,DDX17,SYNE2, etc. | 7.55e-02 |  |
| BPTF | ASC | Colorectum | SER | ARL17B,HNF1A-AS1,MT-ATP8, etc. | 1.20e-01 |  |
| BPTF | CD8TEXINT | Stomach | CAG | GRAMD2B,MCTP2,PACS1, etc. | 1.82e-02 |  |
| BPTF | CD4TN | Stomach | CAG | GRAMD2B,MCTP2,PACS1, etc. | 1.17e-02 | |
| BPTF | CD4TN | Stomach | CSG | GRAMD2B,MCTP2,PACS1, etc. | 8.54e-02 |  |
| BPTF | MAIT | Stomach | SIM | GRAMD2B,MCTP2,PACS1, etc. | 4.20e-02 |  |
| BPTF | LYMEND | Stomach | ADJ | PHF14,PLA2G2A,MT-ND2, etc. | 1.50e-02 |  |
| BPTF | MVA | Stomach | CAG | PHF14,PLA2G2A,MT-ND2, etc. | 6.16e-02 | |
| BPTF | CAF | Stomach | CSG | PHF14,PLA2G2A,MT-ND2, etc. | 1.16e-01 | |
| BPTF | MVA | Stomach | Healthy | PHF14,PLA2G2A,MT-ND2, etc. | 3.92e-02 |  |
| Hugo Symbol | Variant Class | Variant Classification | dbSNP RS | HGVSc | HGVSp | HGVSp Short | SWISSPROT | BIOTYPE | SIFT | PolyPhen | Tumor Sample Barcode | Tissue | Histology | Sex | Age | Stage | Therapy Types | Drugs | Outcome |
| BPTF | SNV | Missense_Mutation | novel | c.4221N>G | p.Ile1407Met | p.I1407M | Q12830 | protein_coding | tolerated_low_confidence(0.28) | benign(0.295) | TCGA-A7-A4SE-01 | Breast | breast invasive carcinoma | Female | <65 | I/II | Chemotherapy | adriamycin | CR |
| BPTF | SNV | Missense_Mutation | novel | c.587N>A | p.Ser196Asn | p.S196N | Q12830 | protein_coding | deleterious(0) | probably_damaging(0.943) | TCGA-A8-A07W-01 | Breast | breast invasive carcinoma | Female | >=65 | III/IV | Hormone Therapy | exemestane | SD |
| BPTF | SNV | Missense_Mutation | | c.6194N>C | p.Arg2065Thr | p.R2065T | Q12830 | protein_coding | deleterious(0) | probably_damaging(0.919) | TCGA-AC-A23H-01 | Breast | breast invasive carcinoma | Female | >=65 | I/II | Unknown | Unknown | PD |
| BPTF | SNV | Missense_Mutation | | c.5514N>G | p.Ile1838Met | p.I1838M | Q12830 | protein_coding | deleterious(0.01) | possibly_damaging(0.847) | TCGA-BH-A0DZ-01 | Breast | breast invasive carcinoma | Female | <65 | I/II | Chemotherapy | docetaxel | SD |
| BPTF | SNV | Missense_Mutation | | c.6368N>T | p.Ser2123Leu | p.S2123L | Q12830 | protein_coding | deleterious(0.02) | benign(0.164) | TCGA-BH-A2L8-01 | Breast | breast invasive carcinoma | Female | <65 | I/II | Chemotherapy | cytoxan | CR |
| BPTF | SNV | Missense_Mutation | | c.5401C>A | p.Pro1801Thr | p.P1801T | Q12830 | protein_coding | deleterious(0.01) | possibly_damaging(0.908) | TCGA-C8-A132-01 | Breast | breast invasive carcinoma | Female | <65 | I/II | Unknown | Unknown | SD |
| BPTF | SNV | Missense_Mutation | | c.2908N>C | p.Asp970His | p.D970H | Q12830 | protein_coding | tolerated(0.07) | possibly_damaging(0.548) | TCGA-C8-A26Y-01 | Breast | breast invasive carcinoma | Female | >=65 | I/II | Unknown | Unknown | SD |
| BPTF | SNV | Missense_Mutation | | c.4442N>G | p.Ser1481Cys | p.S1481C | Q12830 | protein_coding | tolerated_low_confidence(0.14) | possibly_damaging(0.634) | TCGA-D8-A1JA-01 | Breast | breast invasive carcinoma | Female | <65 | III/IV | Chemotherapy | adriamycin | PD |
| BPTF | SNV | Missense_Mutation | | c.2053N>C | p.Glu685Gln | p.E685Q | Q12830 | protein_coding | deleterious(0.02) | benign(0.076) | TCGA-D8-A1JC-01 | Breast | breast invasive carcinoma | Female | <65 | III/IV | Chemotherapy | adriamycin | SD |
| BPTF | SNV | Missense_Mutation | | c.751G>A | p.Glu251Lys | p.E251K | Q12830 | protein_coding | deleterious(0) | probably_damaging(0.997) | TCGA-D8-A27G-01 | Breast | breast invasive carcinoma | Female | >=65 | I/II | Unknown | Unknown | SD |


