| Tissue | Expression Dynamics | Abbreviation |
| Colorectum (GSE201348) |  | FAP: Familial adenomatous polyposis |
| CRC: Colorectal cancer |
| Colorectum (HTA11) | 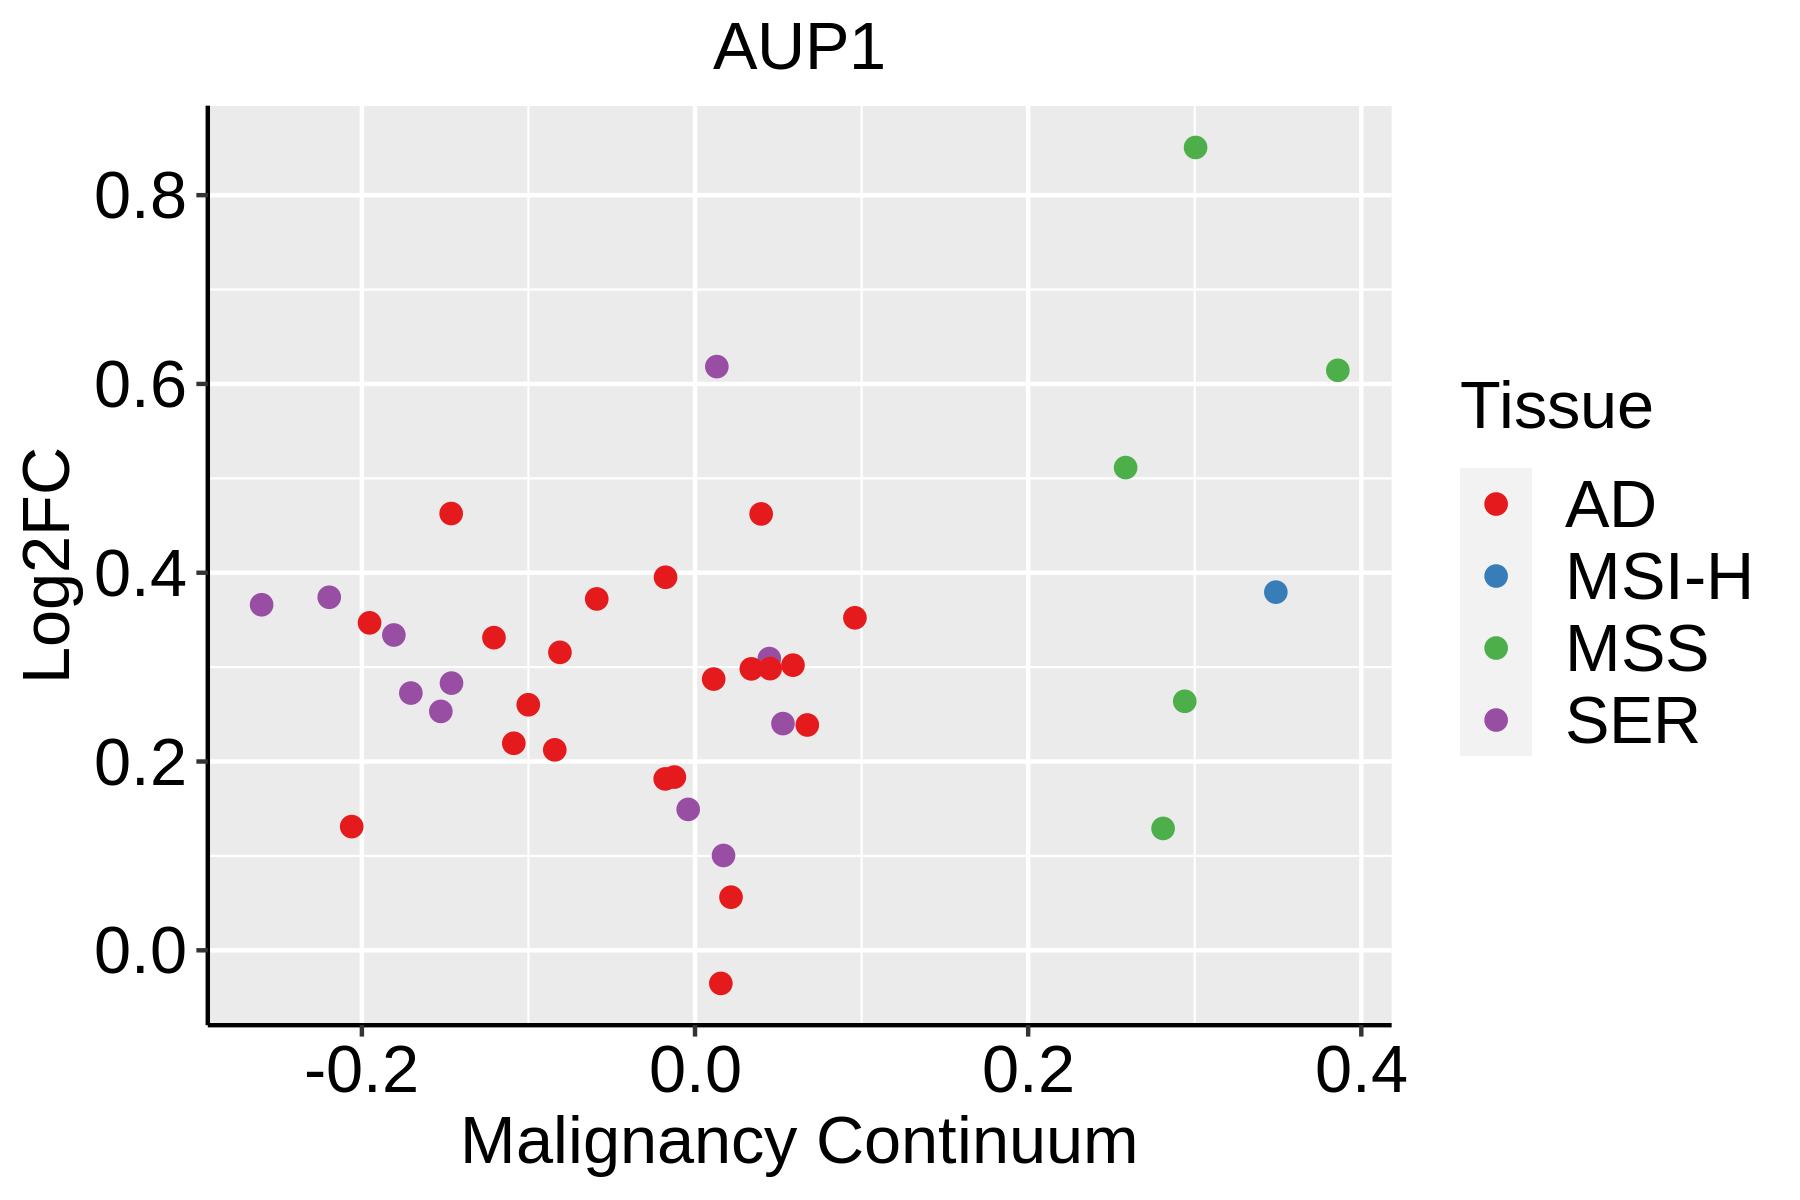 | AD: Adenomas |
| SER: Sessile serrated lesions |
| MSI-H: Microsatellite-high colorectal cancer |
| MSS: Microsatellite stable colorectal cancer |
| Esophagus | 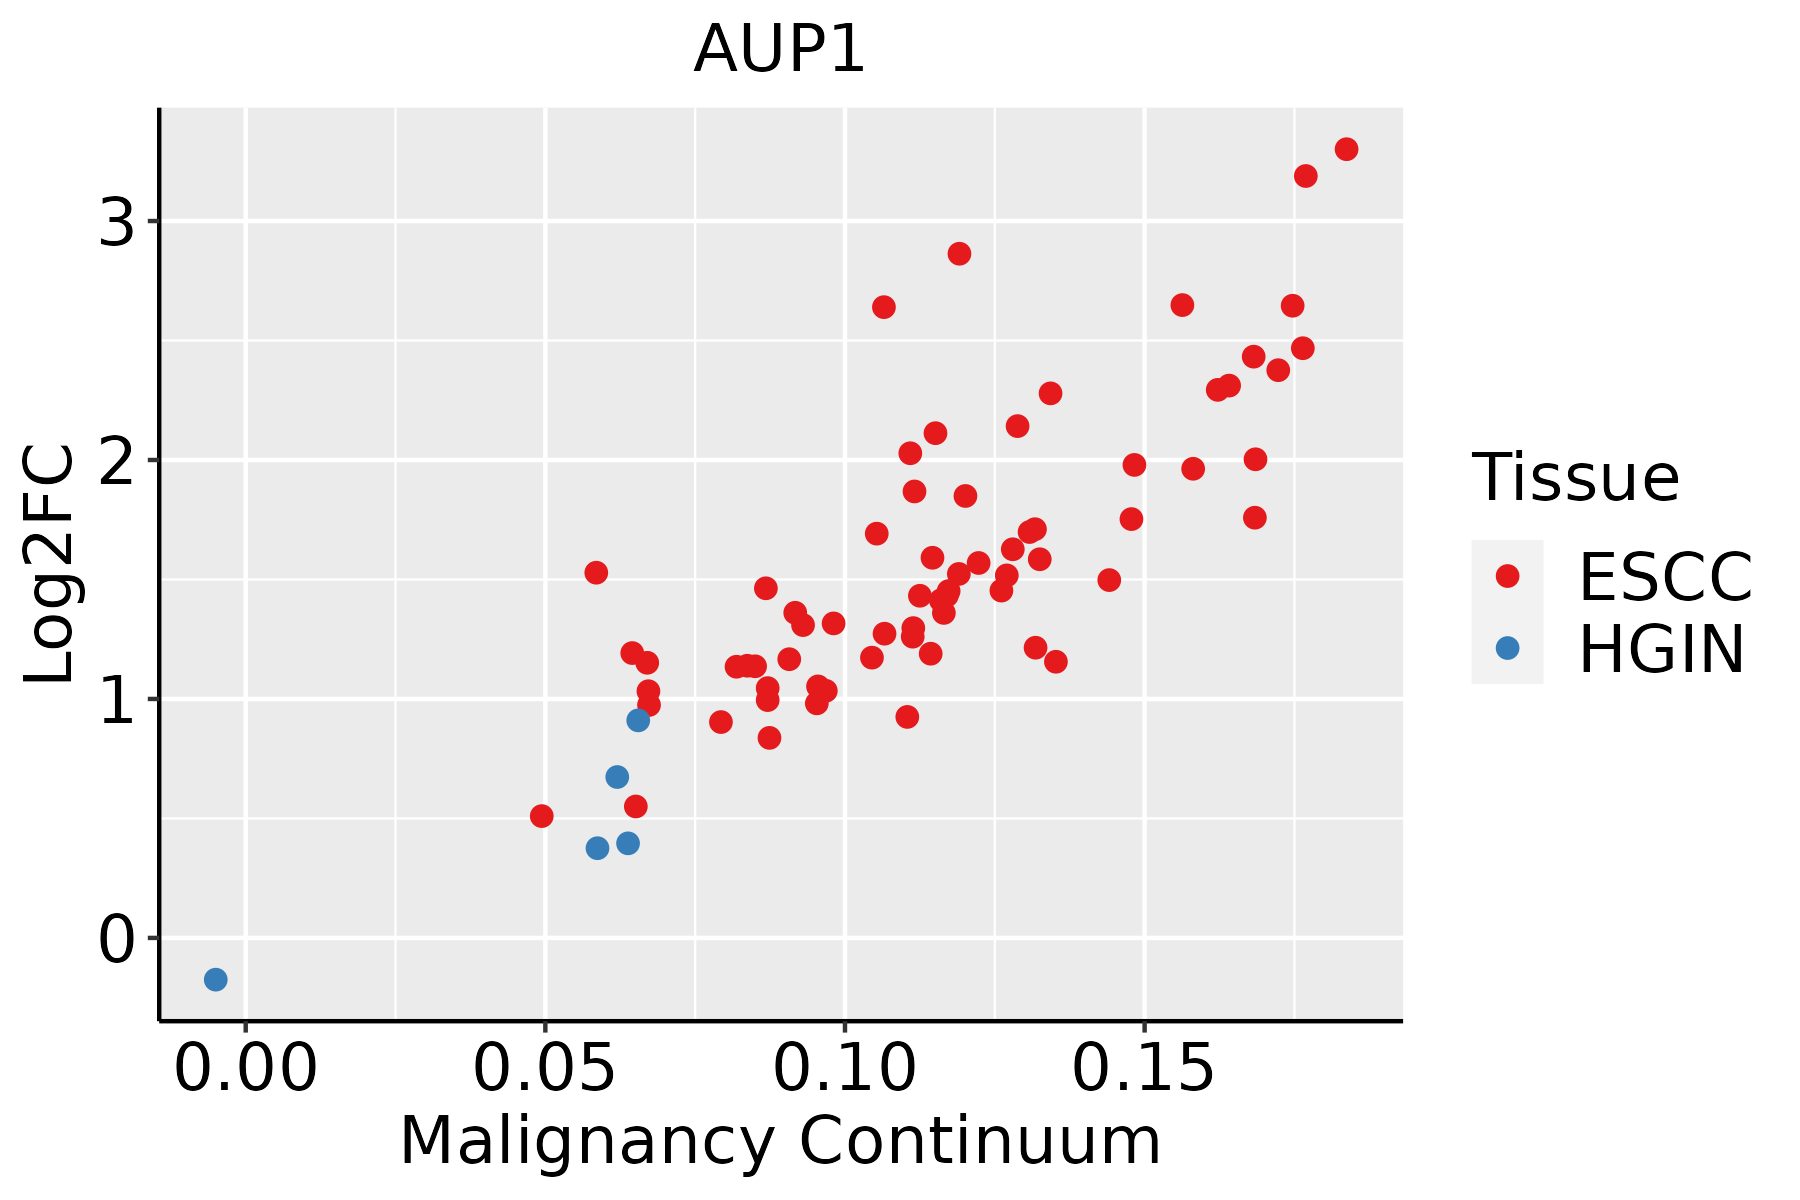 | ESCC: Esophageal squamous cell carcinoma |
| HGIN: High-grade intraepithelial neoplasias |
| LGIN: Low-grade intraepithelial neoplasias |
| Liver | 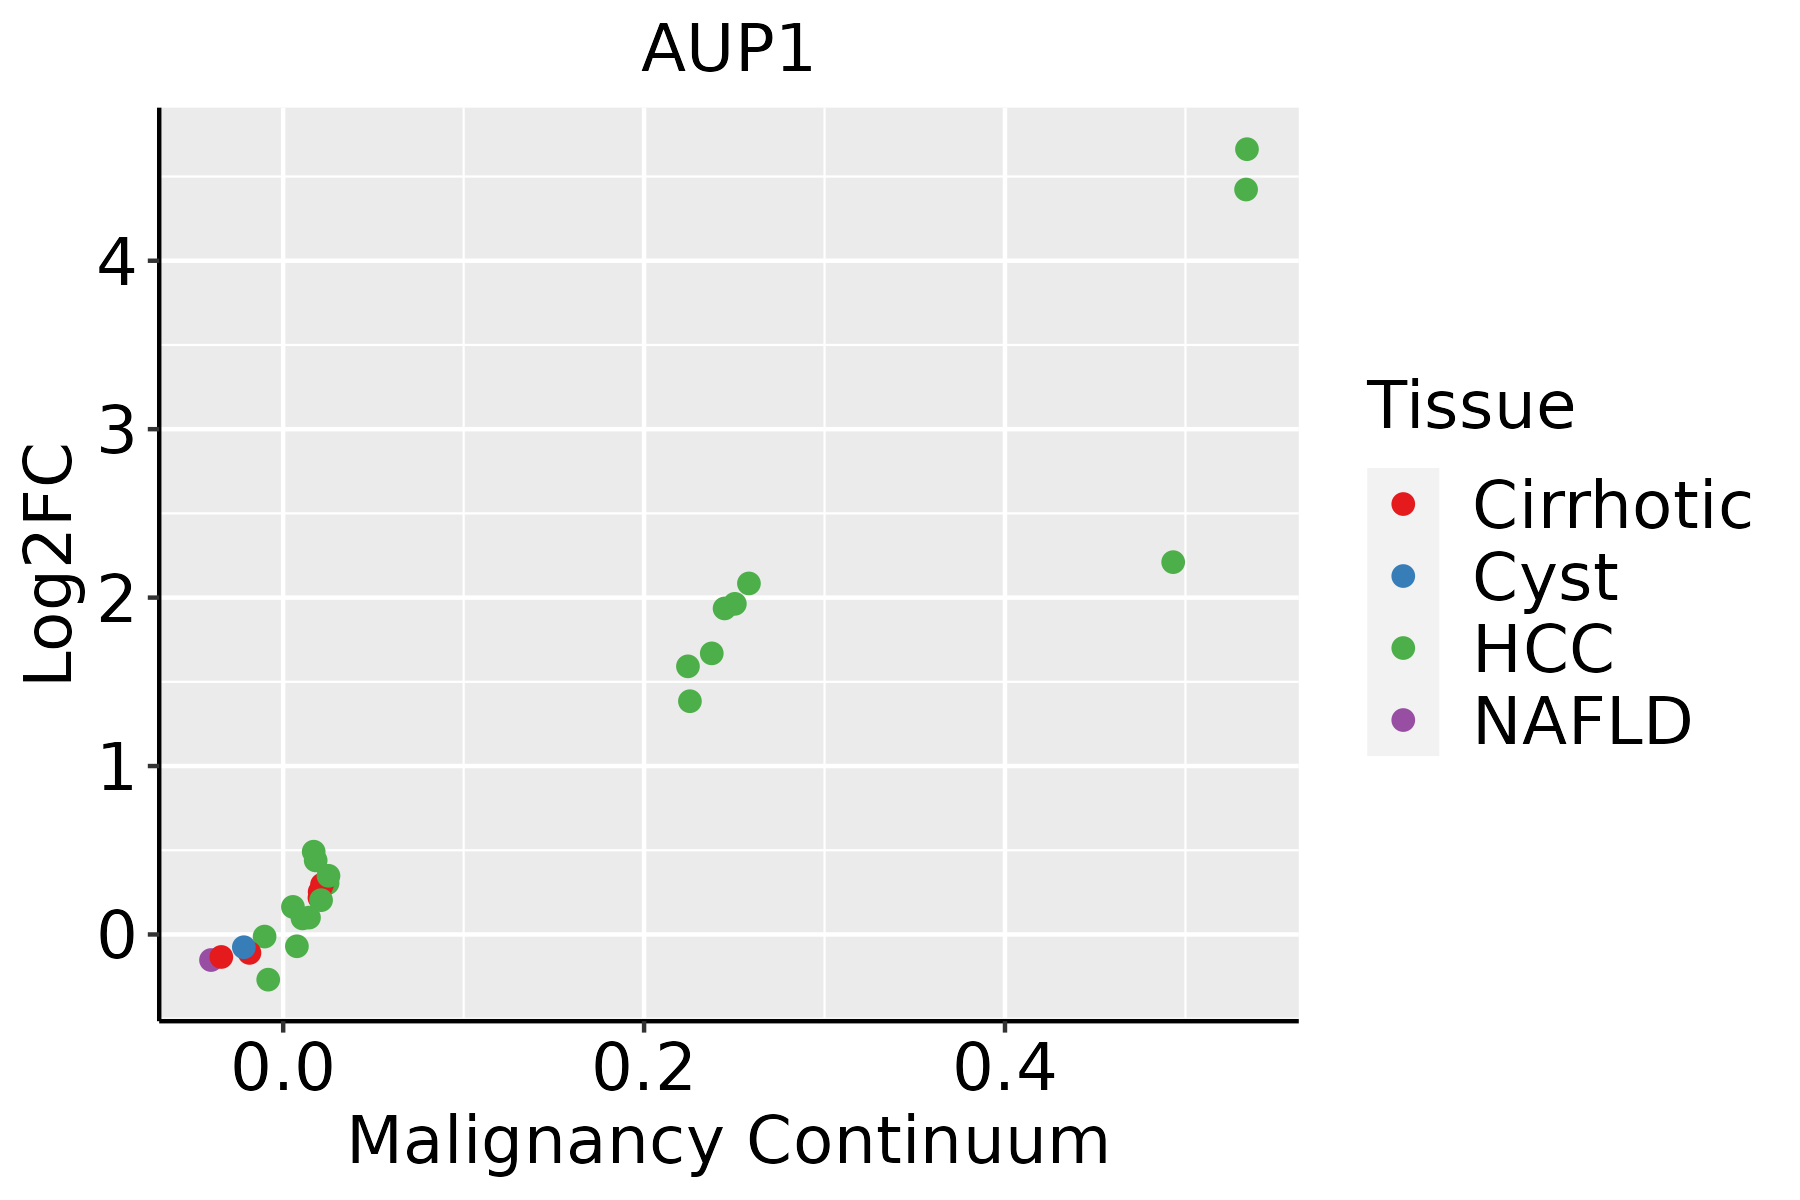 | HCC: Hepatocellular carcinoma |
| NAFLD: Non-alcoholic fatty liver disease |
| Oral Cavity | 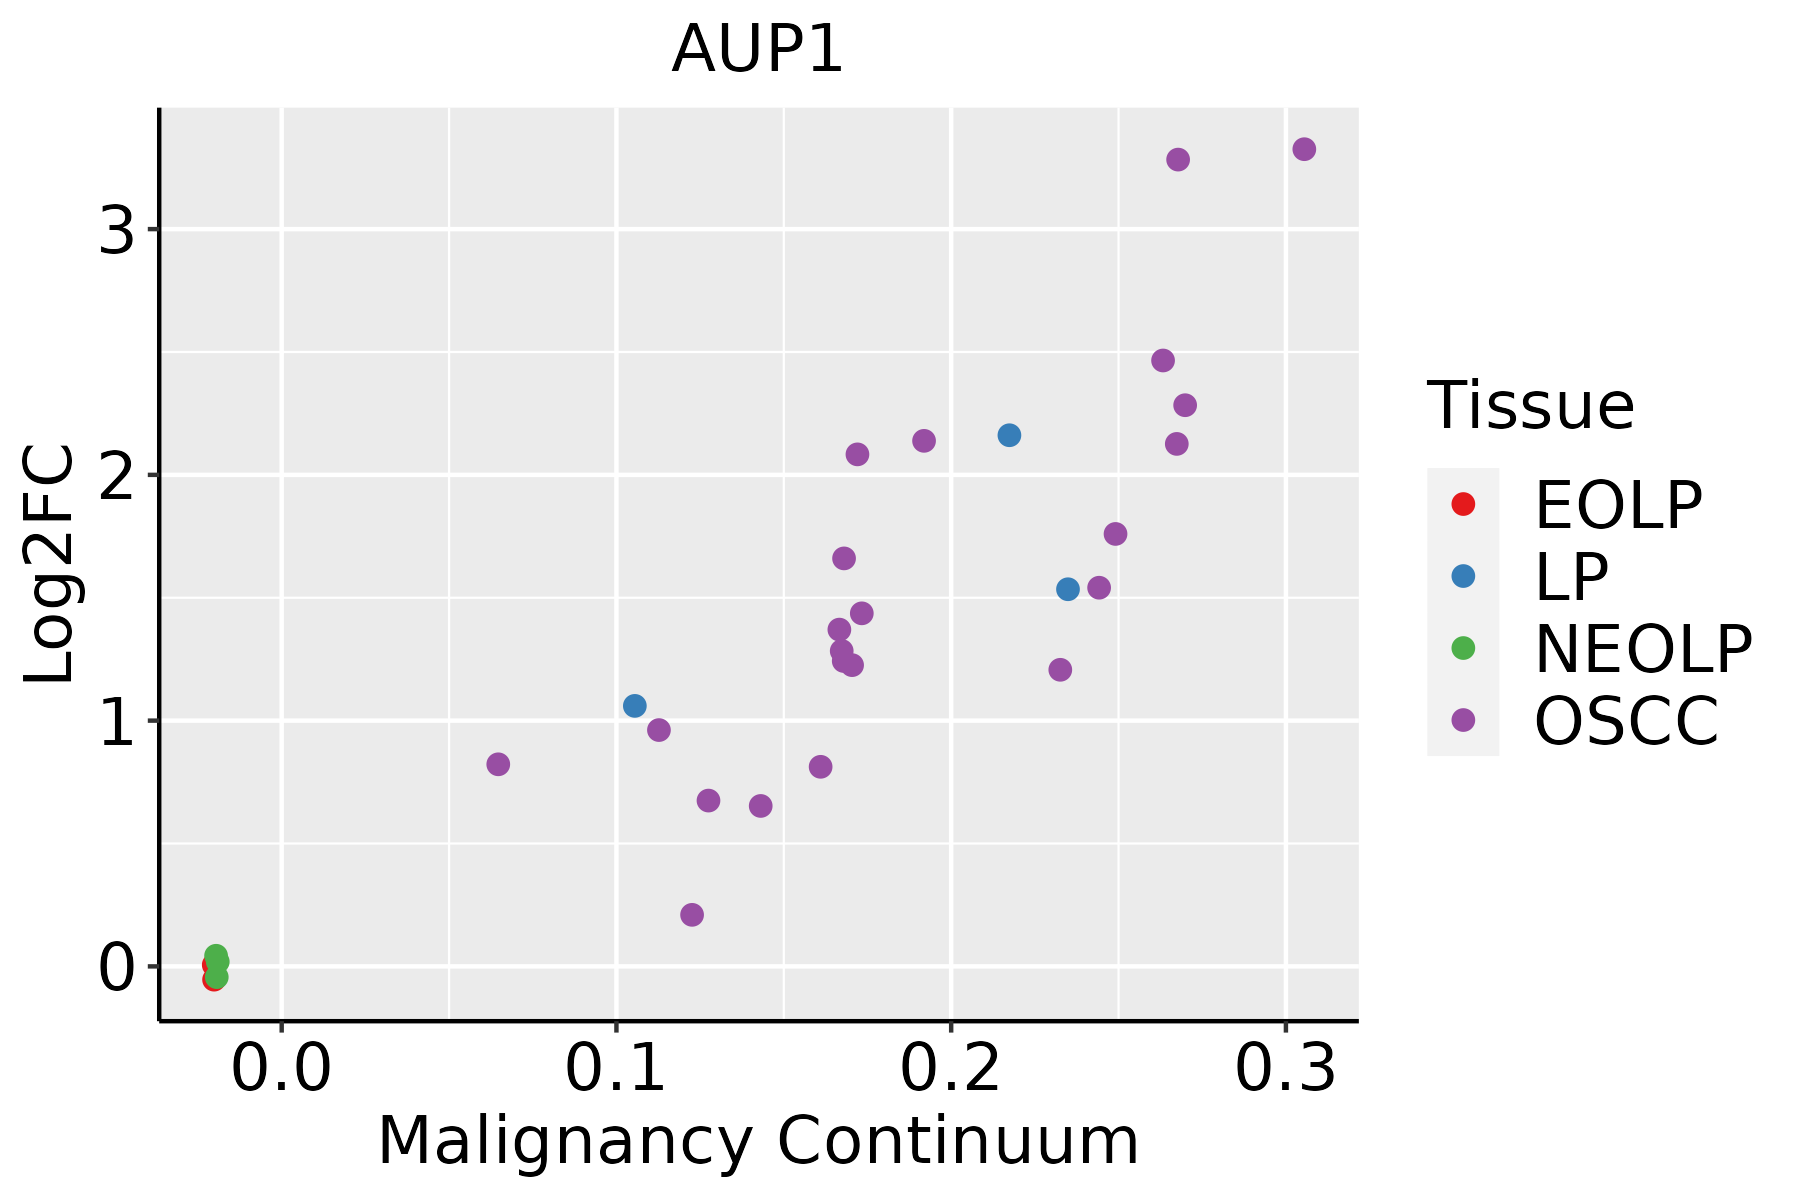 | EOLP: Erosive Oral lichen planus |
| LP: leukoplakia |
| NEOLP: Non-erosive oral lichen planus |
| OSCC: Oral squamous cell carcinoma |
| Skin | 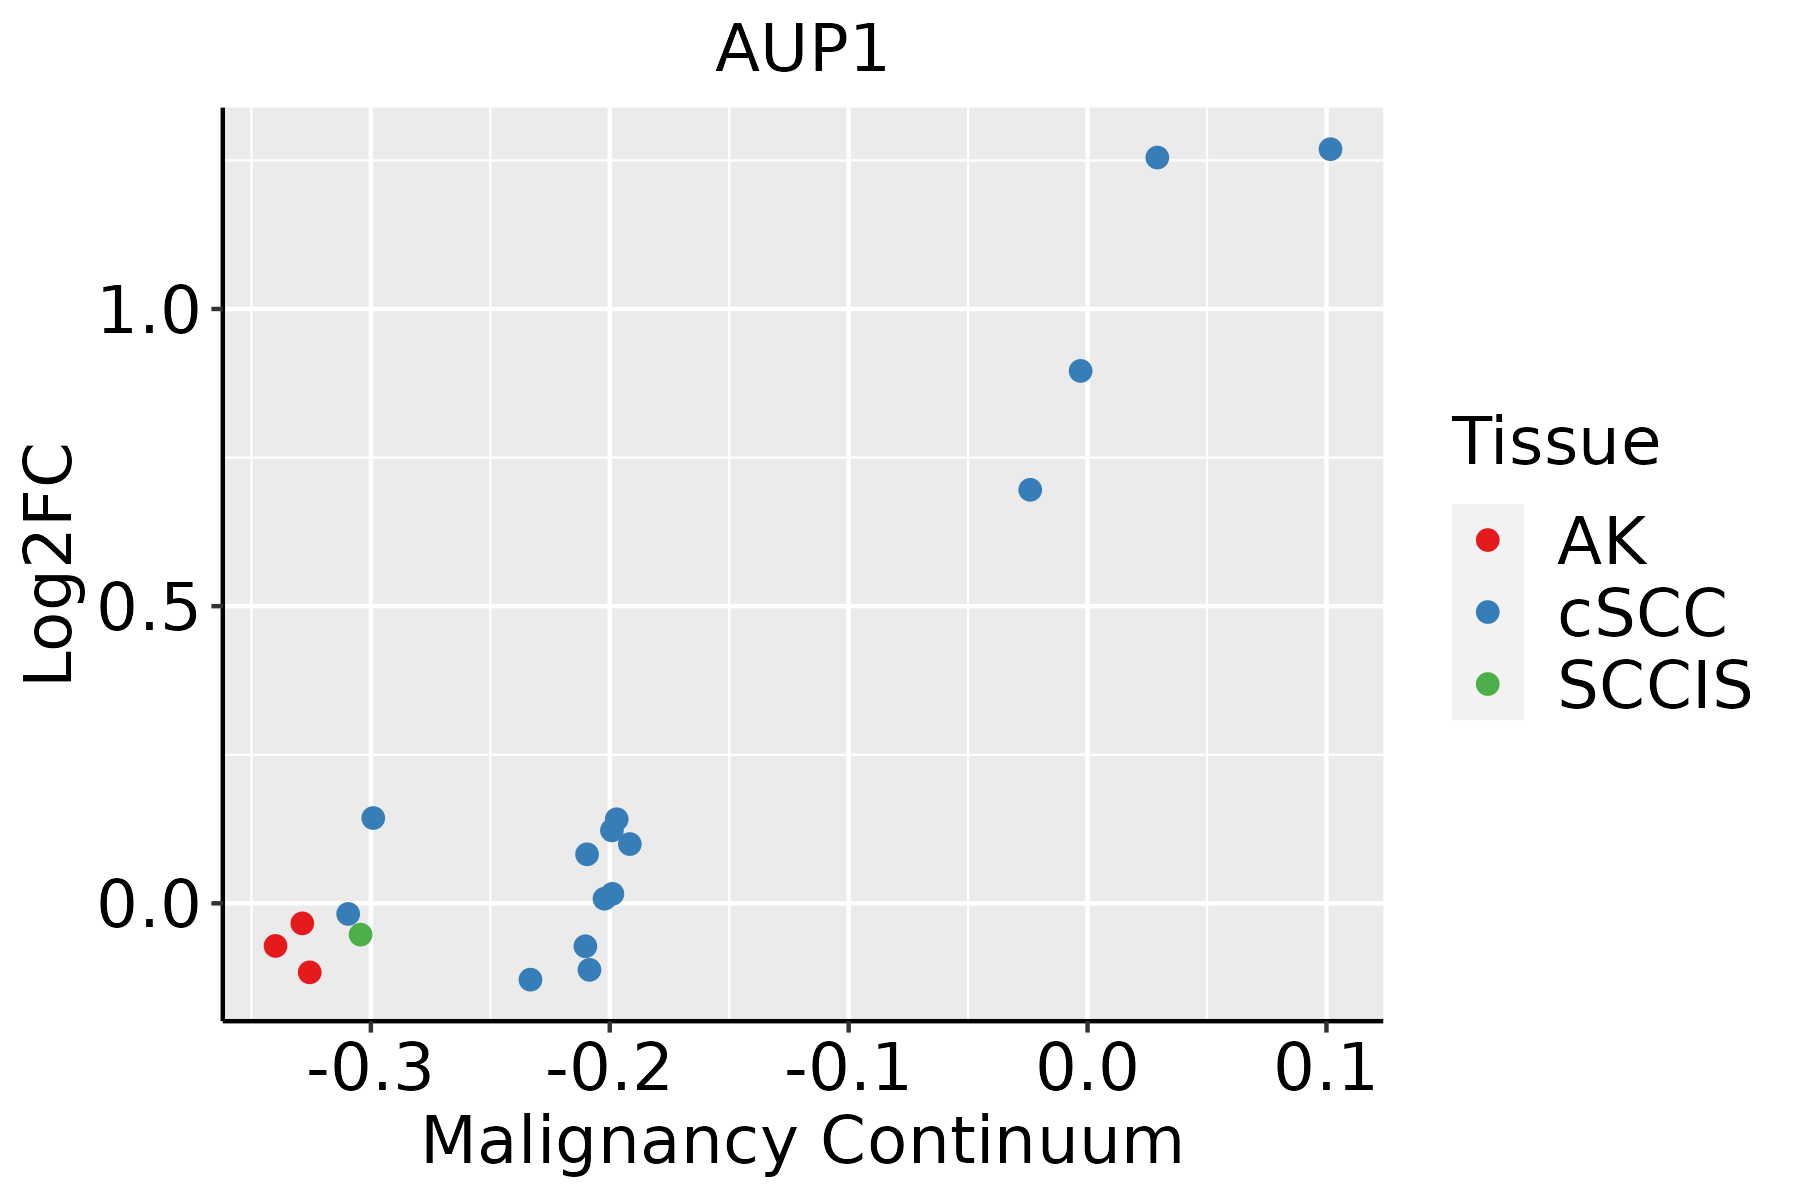 | AK: Actinic keratosis |
| cSCC: Cutaneous squamous cell carcinoma |
| SCCIS:squamous cell carcinoma in situ |
| Thyroid |  | ATC: Anaplastic thyroid cancer |
| HT: Hashimoto's thyroiditis |
| PTC: Papillary thyroid cancer |
| GO ID | Tissue | Disease Stage | Description | Gene Ratio | Bg Ratio | pvalue | p.adjust | Count |
| GO:006191214 | Oral cavity | LP | selective autophagy | 28/4623 | 68/18723 | 2.01e-03 | 1.49e-02 | 28 |
| GO:007121812 | Oral cavity | LP | cellular response to misfolded protein | 12/4623 | 23/18723 | 4.14e-03 | 2.66e-02 | 12 |
| GO:001049828 | Skin | cSCC | proteasomal protein catabolic process | 243/4864 | 490/18723 | 7.85e-30 | 4.10e-27 | 243 |
| GO:004316128 | Skin | cSCC | proteasome-mediated ubiquitin-dependent protein catabolic process | 205/4864 | 412/18723 | 1.46e-25 | 4.16e-23 | 205 |
| GO:0034976112 | Skin | cSCC | response to endoplasmic reticulum stress | 128/4864 | 256/18723 | 1.16e-16 | 1.17e-14 | 128 |
| GO:0035966112 | Skin | cSCC | response to topologically incorrect protein | 90/4864 | 159/18723 | 2.26e-16 | 2.12e-14 | 90 |
| GO:001623619 | Skin | cSCC | macroautophagy | 136/4864 | 291/18723 | 1.36e-14 | 9.78e-13 | 136 |
| GO:0035967112 | Skin | cSCC | cellular response to topologically incorrect protein | 65/4864 | 116/18723 | 5.93e-12 | 3.10e-10 | 65 |
| GO:000961522 | Skin | cSCC | response to virus | 152/4864 | 367/18723 | 5.88e-11 | 2.75e-09 | 152 |
| GO:00304336 | Skin | cSCC | ubiquitin-dependent ERAD pathway | 43/4864 | 85/18723 | 1.02e-06 | 1.82e-05 | 43 |
| GO:00365037 | Skin | cSCC | ERAD pathway | 51/4864 | 107/18723 | 1.11e-06 | 1.95e-05 | 51 |
| GO:00325278 | Skin | cSCC | protein exit from endoplasmic reticulum | 27/4864 | 48/18723 | 8.24e-06 | 1.10e-04 | 27 |
| GO:00309707 | Skin | cSCC | retrograde protein transport, ER to cytosol | 17/4864 | 29/18723 | 2.00e-04 | 1.67e-03 | 17 |
| GO:19035137 | Skin | cSCC | endoplasmic reticulum to cytosol transport | 17/4864 | 29/18723 | 2.00e-04 | 1.67e-03 | 17 |
| GO:00517885 | Skin | cSCC | response to misfolded protein | 15/4864 | 25/18723 | 3.36e-04 | 2.67e-03 | 15 |
| GO:00619129 | Skin | cSCC | selective autophagy | 30/4864 | 68/18723 | 8.91e-04 | 6.10e-03 | 30 |
| GO:00065155 | Skin | cSCC | protein quality control for misfolded or incompletely synthesized proteins | 15/4864 | 28/18723 | 1.69e-03 | 1.04e-02 | 15 |
| GO:00712185 | Skin | cSCC | cellular response to misfolded protein | 13/4864 | 23/18723 | 1.81e-03 | 1.09e-02 | 13 |
| GO:005123527 | Skin | cSCC | maintenance of location | 106/4864 | 327/18723 | 5.17e-03 | 2.61e-02 | 106 |
| GO:0010498113 | Thyroid | PTC | proteasomal protein catabolic process | 297/5968 | 490/18723 | 4.58e-40 | 9.63e-37 | 297 |
| Hugo Symbol | Variant Class | Variant Classification | dbSNP RS | HGVSc | HGVSp | HGVSp Short | SWISSPROT | BIOTYPE | SIFT | PolyPhen | Tumor Sample Barcode | Tissue | Histology | Sex | Age | Stage | Therapy Types | Drugs | Outcome |
| AUP1 | SNV | Missense_Mutation | | c.1003N>C | p.Glu335Gln | p.E335Q | Q9Y679 | protein_coding | deleterious(0) | probably_damaging(0.998) | TCGA-A2-A0D0-01 | Breast | breast invasive carcinoma | Female | <65 | I/II | Chemotherapy | cytoxan | SD |
| AUP1 | SNV | Missense_Mutation | | c.340N>T | p.Pro114Ser | p.P114S | Q9Y679 | protein_coding | deleterious(0) | probably_damaging(0.999) | TCGA-A7-A13D-01 | Breast | breast invasive carcinoma | Female | <65 | I/II | Chemotherapy | cytoxan | SD |
| AUP1 | SNV | Missense_Mutation | novel | c.896C>T | p.Thr299Ile | p.T299I | Q9Y679 | protein_coding | tolerated(0.18) | benign(0) | TCGA-AO-A0JB-01 | Breast | breast invasive carcinoma | Female | <65 | III/IV | Chemotherapy | cyclophosphamide | SD |
| AUP1 | insertion | Frame_Shift_Ins | novel | c.704_705insGAATGGAATTATGGAGCTACTACGGCAAAGCCTGAATAATATC | p.Ala236AsnfsTer17 | p.A236Nfs*17 | Q9Y679 | protein_coding | | | TCGA-AN-A0FN-01 | Breast | breast invasive carcinoma | Female | <65 | I/II | Unknown | Unknown | SD |
| AUP1 | insertion | In_Frame_Ins | novel | c.897_898insTTTATATTTTTTGCCATGTTGCCC | p.Thr299_Leu300insPheIlePhePheAlaMetLeuPro | p.T299_L300insFIFFAMLP | Q9Y679 | protein_coding | | | TCGA-AO-A0JB-01 | Breast | breast invasive carcinoma | Female | <65 | III/IV | Chemotherapy | cyclophosphamide | SD |
| AUP1 | SNV | Missense_Mutation | novel | c.4G>A | p.Glu2Lys | p.E2K | Q9Y679 | protein_coding | deleterious_low_confidence(0.02) | benign(0.001) | TCGA-2W-A8YY-01 | Cervix | cervical & endocervical cancer | Female | <65 | I/II | Chemotherapy | cisplatin | CR |
| AUP1 | SNV | Missense_Mutation | rs755973491 | c.679N>T | p.Arg227Cys | p.R227C | Q9Y679 | protein_coding | deleterious(0) | benign(0.292) | TCGA-FU-A3HZ-01 | Cervix | cervical & endocervical cancer | Female | <65 | I/II | Chemotherapy | cisplatin | CR |
| AUP1 | SNV | Missense_Mutation | | c.40N>C | p.Asp14His | p.D14H | Q9Y679 | protein_coding | tolerated(0.14) | probably_damaging(0.971) | TCGA-JX-A3Q0-01 | Cervix | cervical & endocervical cancer | Female | <65 | III/IV | Unknown | Unknown | SD |
| AUP1 | SNV | Missense_Mutation | novel | c.43N>C | p.Ser15Pro | p.S15P | Q9Y679 | protein_coding | tolerated(0.21) | possibly_damaging(0.736) | TCGA-5M-AAT5-01 | Colorectum | colon adenocarcinoma | Unknown | Unknown | I/II | Unknown | Unknown | Unknown |
| AUP1 | SNV | Missense_Mutation | rs746000640 | c.1145N>A | p.Arg382Gln | p.R382Q | Q9Y679 | protein_coding | deleterious(0) | probably_damaging(0.997) | TCGA-AZ-6601-01 | Colorectum | colon adenocarcinoma | Male | >=65 | I/II | Unknown | Unknown | PD |


