
|
|||||
|
 | |
| |
| |
| |
| |
| |
|
Gene: ATP1B1 |
Gene summary for ATP1B1 |
| Gene information | Species | Human | Gene symbol | ATP1B1 | Gene ID | 481 |
| Gene name | ATPase Na+/K+ transporting subunit beta 1 | |
| Gene Alias | ATP1B | |
| Cytomap | 1q24.2 | |
| Gene Type | protein-coding | GO ID | GO:0001508 | UniProtAcc | A3KLL5 |
Top |
Malignant transformation analysis |
| Identification of the aberrant gene expression in precancerous and cancerous lesions by comparing the gene expression of stem-like cells in diseased tissues with normal stem cells |
| Entrez ID | Symbol | Replicates | Species | Organ | Tissue | Adj P-value | Log2FC | Malignancy |
| 481 | ATP1B1 | GSM4909281 | Human | Breast | IDC | 6.15e-10 | 4.34e-01 | 0.21 |
| 481 | ATP1B1 | GSM4909285 | Human | Breast | IDC | 5.18e-20 | -6.55e-01 | 0.21 |
| 481 | ATP1B1 | GSM4909286 | Human | Breast | IDC | 1.07e-36 | -8.68e-01 | 0.1081 |
| 481 | ATP1B1 | GSM4909291 | Human | Breast | IDC | 2.03e-07 | -6.04e-01 | 0.1753 |
| 481 | ATP1B1 | GSM4909293 | Human | Breast | IDC | 7.62e-11 | -4.72e-01 | 0.1581 |
| 481 | ATP1B1 | GSM4909294 | Human | Breast | IDC | 2.69e-14 | -6.76e-01 | 0.2022 |
| 481 | ATP1B1 | GSM4909296 | Human | Breast | IDC | 1.88e-17 | -6.24e-01 | 0.1524 |
| 481 | ATP1B1 | GSM4909297 | Human | Breast | IDC | 1.44e-16 | -4.23e-01 | 0.1517 |
| 481 | ATP1B1 | GSM4909298 | Human | Breast | IDC | 5.45e-04 | -3.44e-01 | 0.1551 |
| 481 | ATP1B1 | GSM4909301 | Human | Breast | IDC | 2.54e-31 | -8.16e-01 | 0.1577 |
| 481 | ATP1B1 | GSM4909304 | Human | Breast | IDC | 7.85e-14 | -6.11e-01 | 0.1636 |
| 481 | ATP1B1 | GSM4909308 | Human | Breast | IDC | 7.65e-08 | 3.28e-01 | 0.158 |
| 481 | ATP1B1 | GSM4909309 | Human | Breast | IDC | 8.59e-06 | -4.73e-01 | 0.0483 |
| 481 | ATP1B1 | GSM4909311 | Human | Breast | IDC | 7.62e-44 | -8.53e-01 | 0.1534 |
| 481 | ATP1B1 | GSM4909312 | Human | Breast | IDC | 1.46e-35 | -8.18e-01 | 0.1552 |
| 481 | ATP1B1 | GSM4909315 | Human | Breast | IDC | 6.48e-10 | -5.30e-01 | 0.21 |
| 481 | ATP1B1 | GSM4909316 | Human | Breast | IDC | 5.84e-05 | -6.45e-01 | 0.21 |
| 481 | ATP1B1 | GSM4909318 | Human | Breast | IDC | 1.91e-02 | -7.18e-01 | 0.2031 |
| 481 | ATP1B1 | GSM4909319 | Human | Breast | IDC | 2.57e-41 | -6.25e-01 | 0.1563 |
| 481 | ATP1B1 | GSM4909320 | Human | Breast | IDC | 1.78e-22 | -9.93e-01 | 0.1575 |
| Page: 1 2 3 4 5 6 7 8 9 10 11 12 13 14 |
| Tissue | Expression Dynamics | Abbreviation |
| Breast | 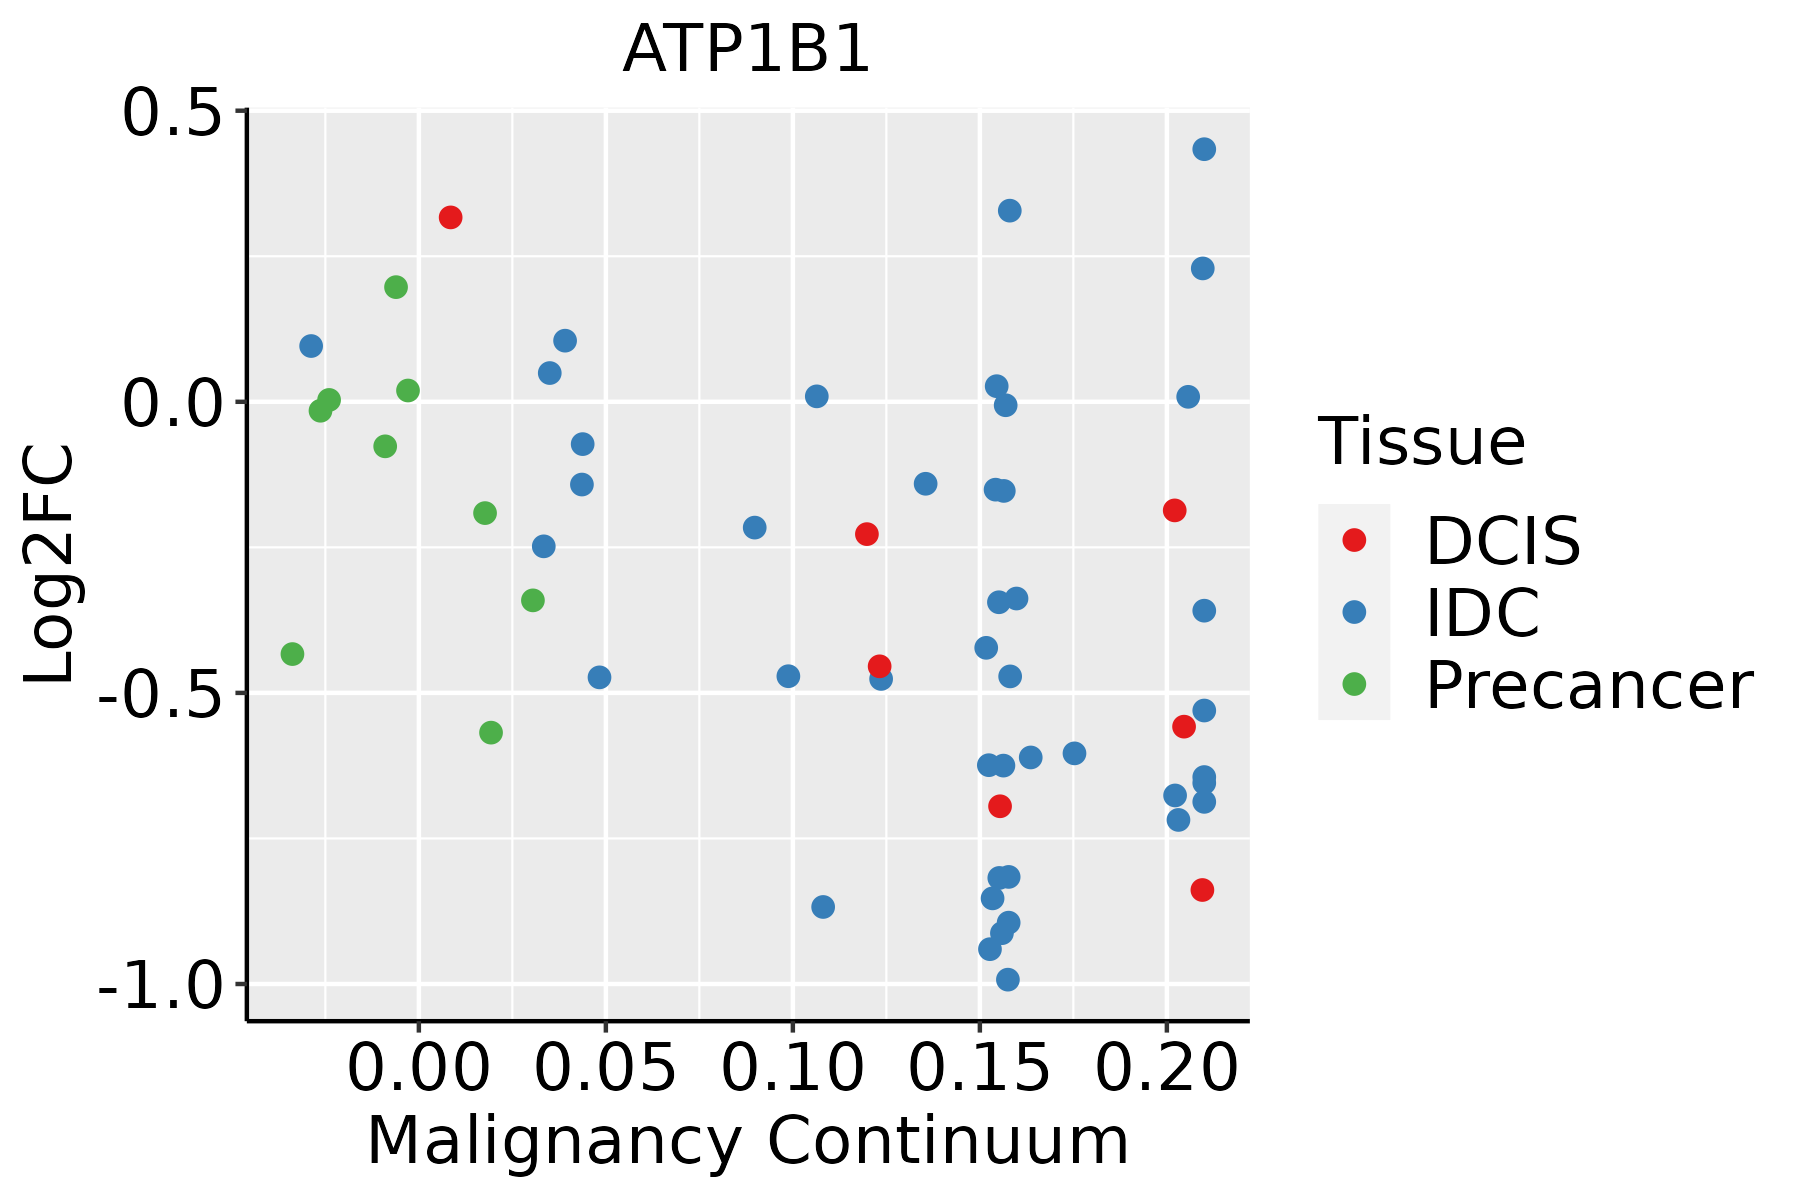 | IDC: Invasive ductal carcinoma |
| DCIS: Ductal carcinoma in situ | ||
| Precancer(BRCA1-mut): Precancerous lesion from BRCA1 mutation carriers | ||
| Cervix | 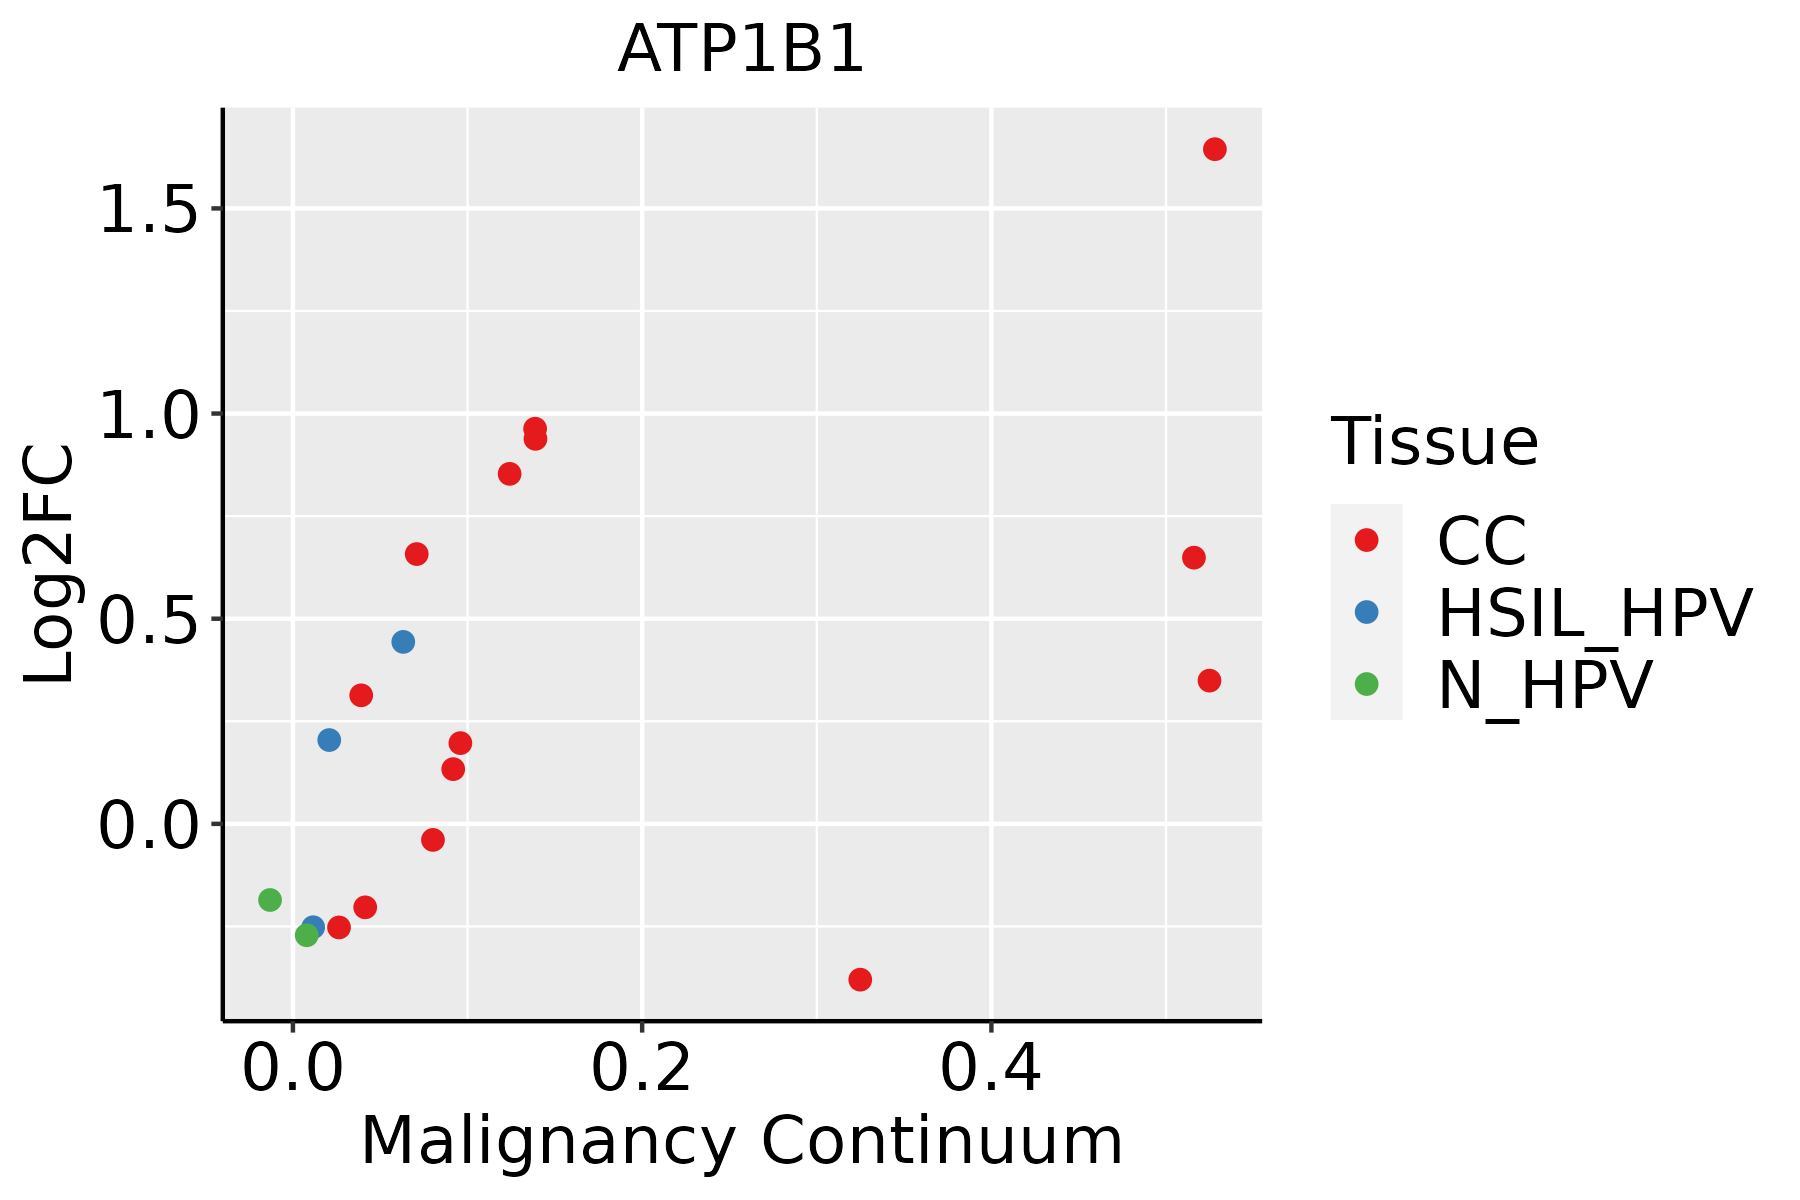 | CC: Cervix cancer |
| HSIL_HPV: HPV-infected high-grade squamous intraepithelial lesions | ||
| N_HPV: HPV-infected normal cervix | ||
| Colorectum (GSE201348) |  | FAP: Familial adenomatous polyposis |
| CRC: Colorectal cancer | ||
| Colorectum (HTA11) |  | AD: Adenomas |
| SER: Sessile serrated lesions | ||
| MSI-H: Microsatellite-high colorectal cancer | ||
| MSS: Microsatellite stable colorectal cancer | ||
| Endometrium | 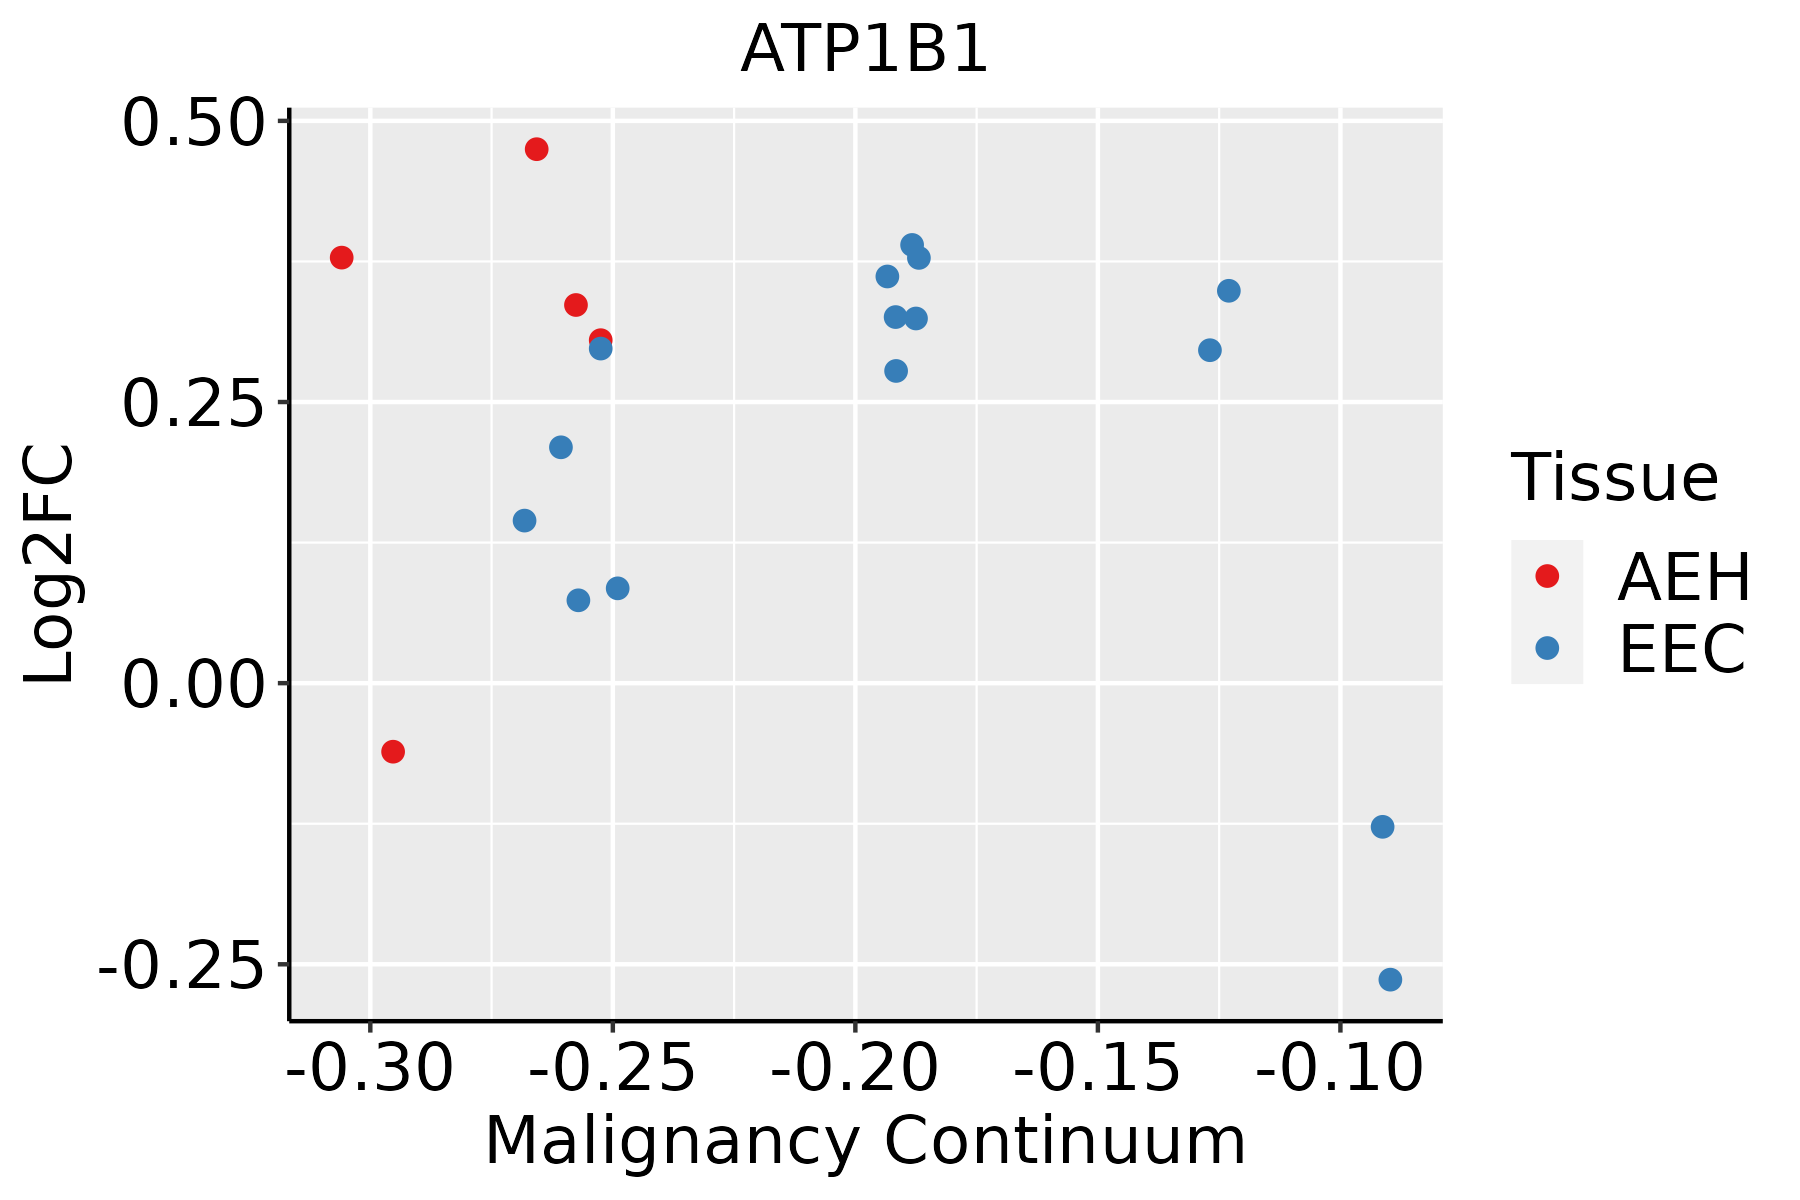 | AEH: Atypical endometrial hyperplasia |
| EEC: Endometrioid Cancer | ||
| Esophagus |  | ESCC: Esophageal squamous cell carcinoma |
| HGIN: High-grade intraepithelial neoplasias | ||
| LGIN: Low-grade intraepithelial neoplasias | ||
| Liver | 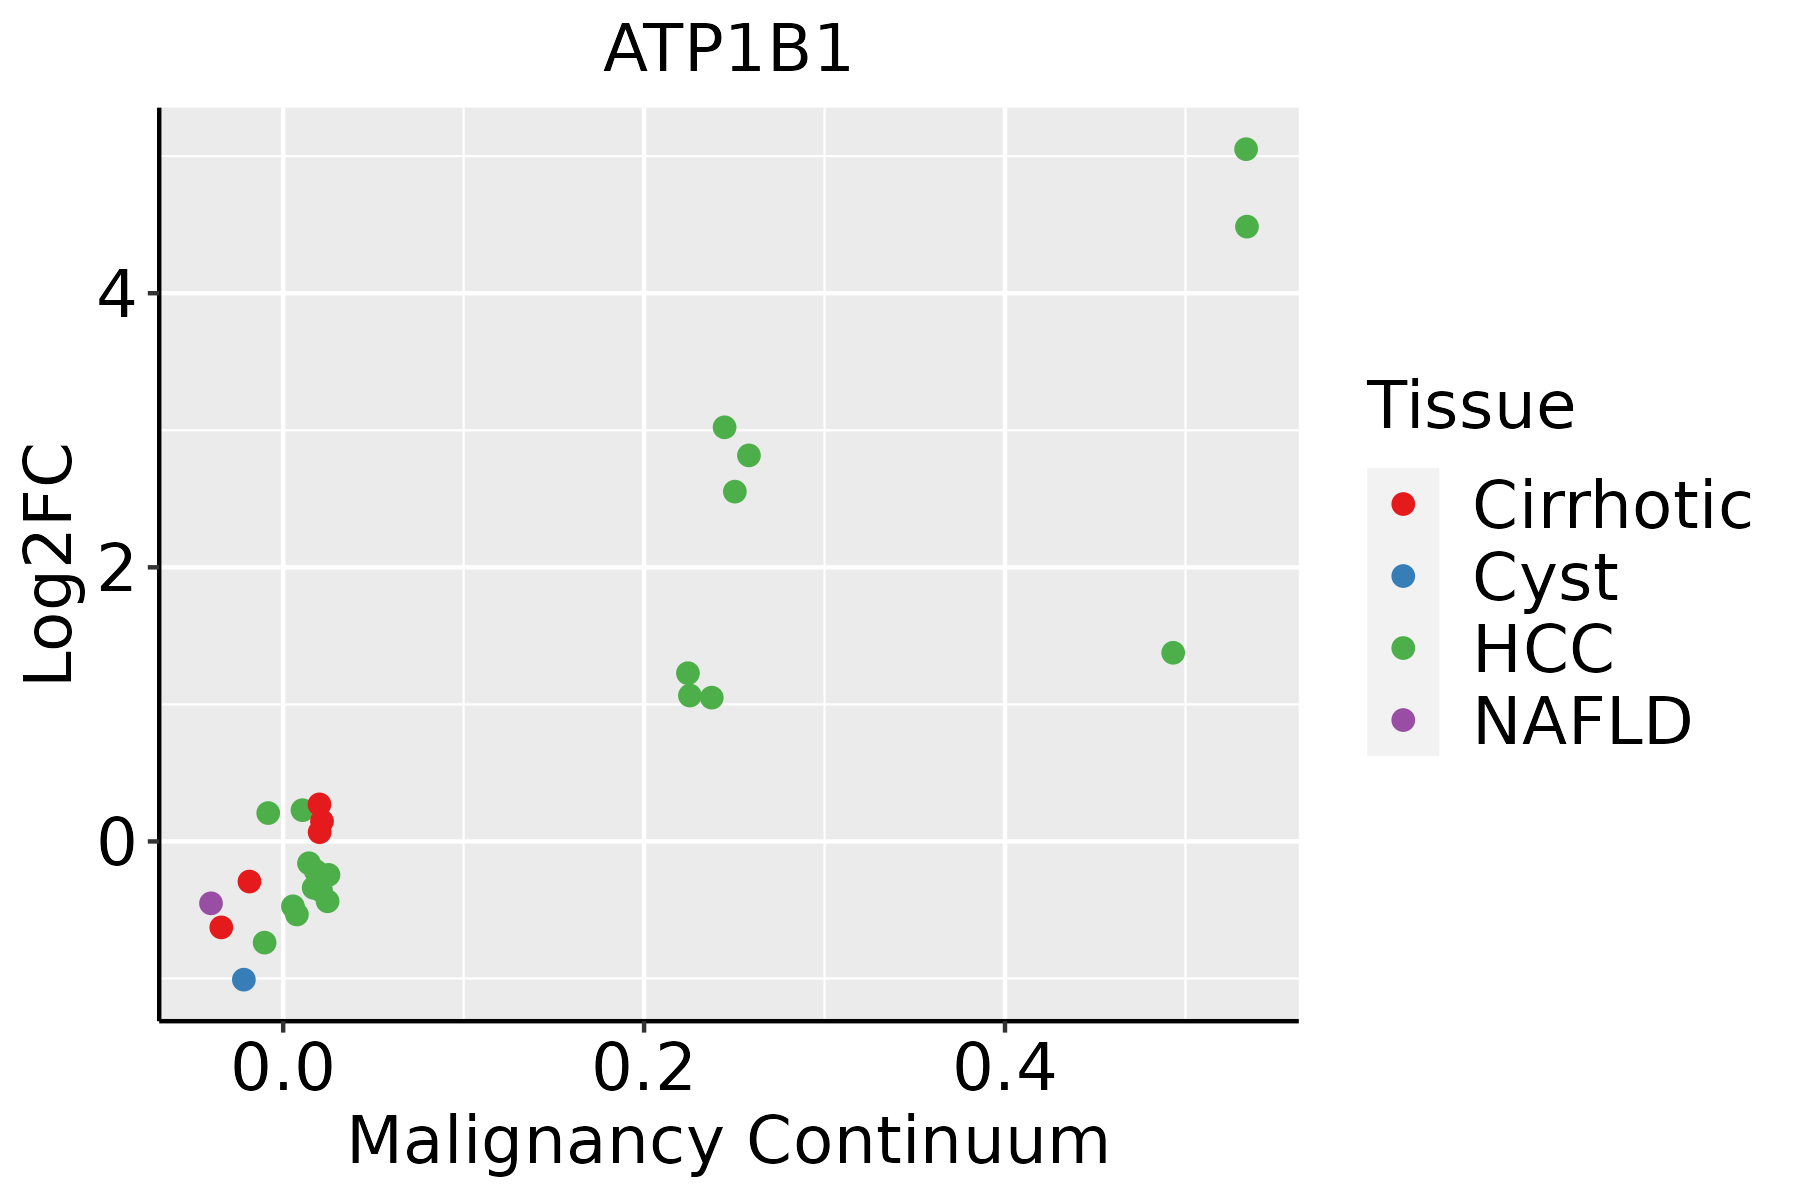 | HCC: Hepatocellular carcinoma |
| NAFLD: Non-alcoholic fatty liver disease | ||
| Lung | 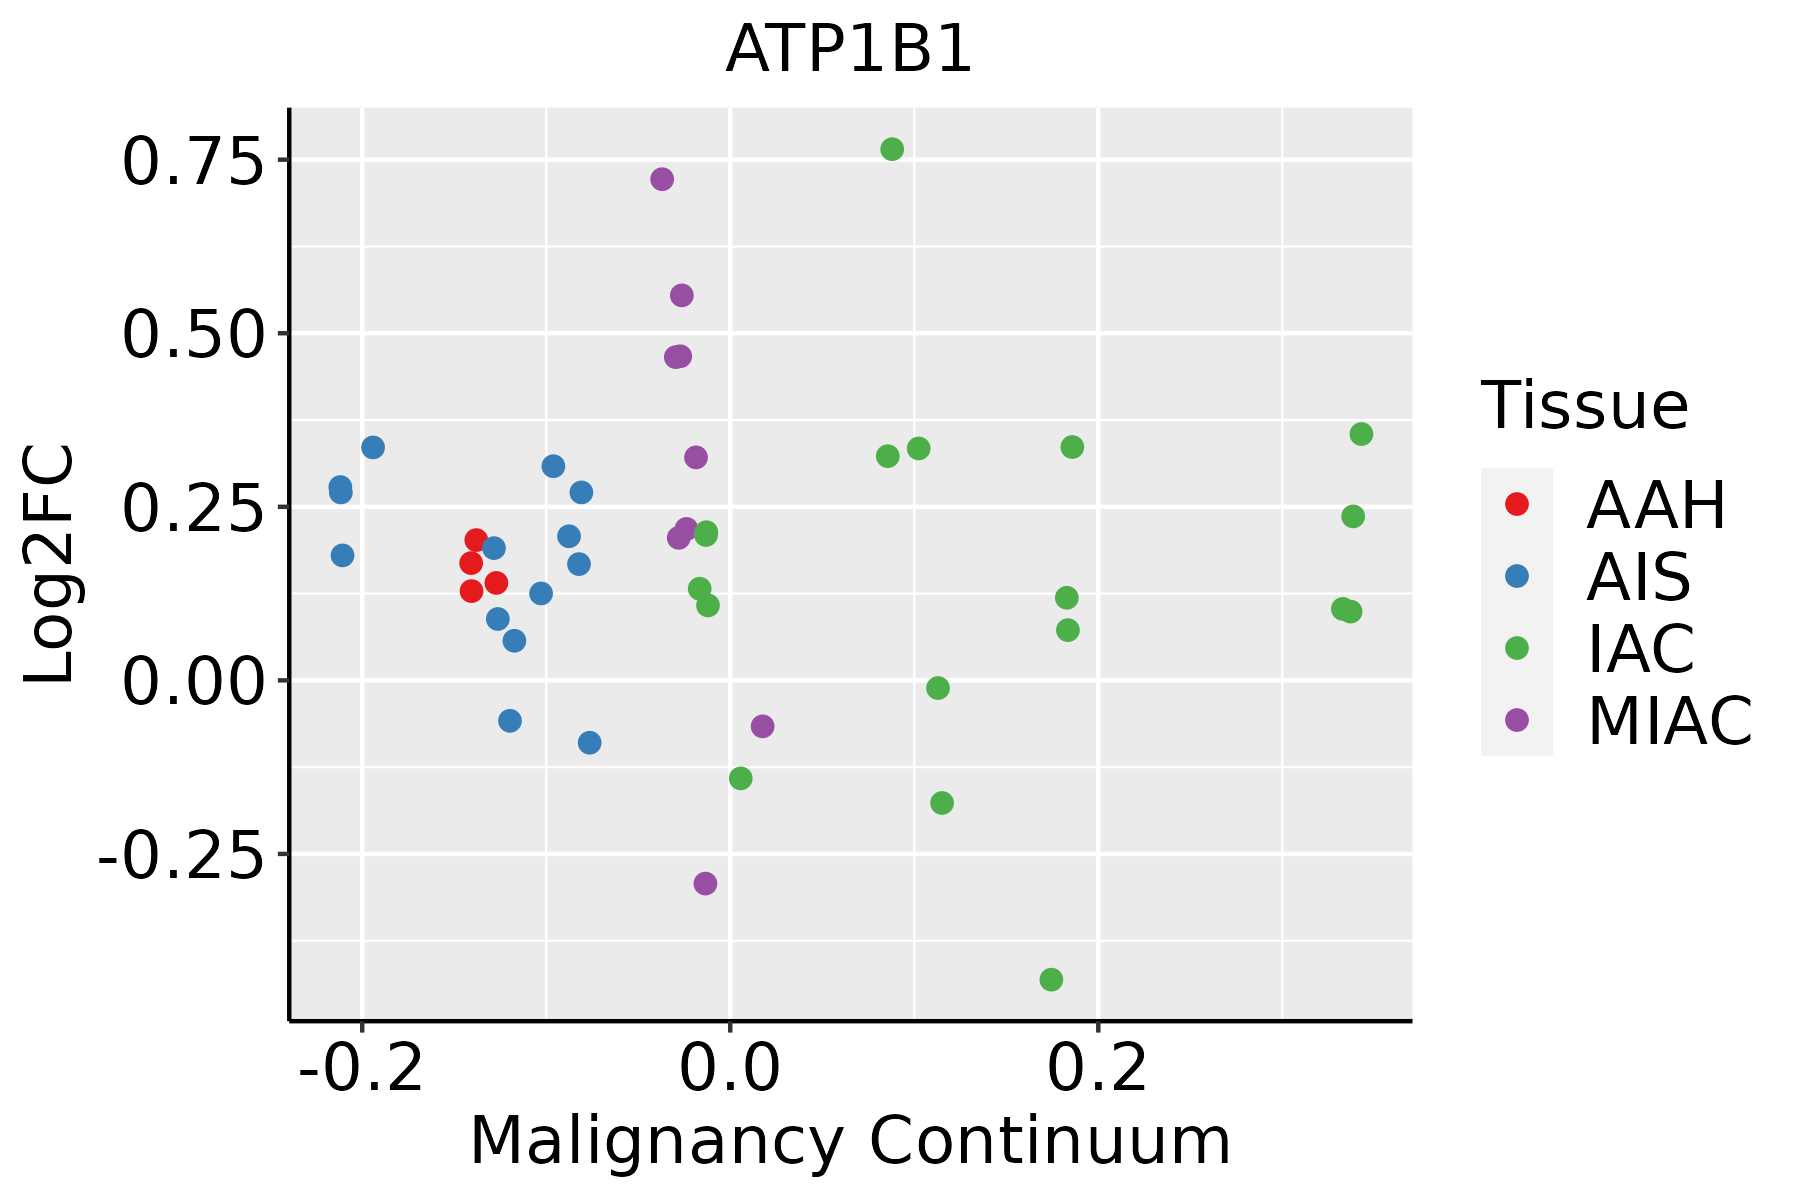 | AAH: Atypical adenomatous hyperplasia |
| AIS: Adenocarcinoma in situ | ||
| IAC: Invasive lung adenocarcinoma | ||
| MIA: Minimally invasive adenocarcinoma | ||
| Oral Cavity |  | EOLP: Erosive Oral lichen planus |
| LP: leukoplakia | ||
| NEOLP: Non-erosive oral lichen planus | ||
| OSCC: Oral squamous cell carcinoma | ||
| Prostate | 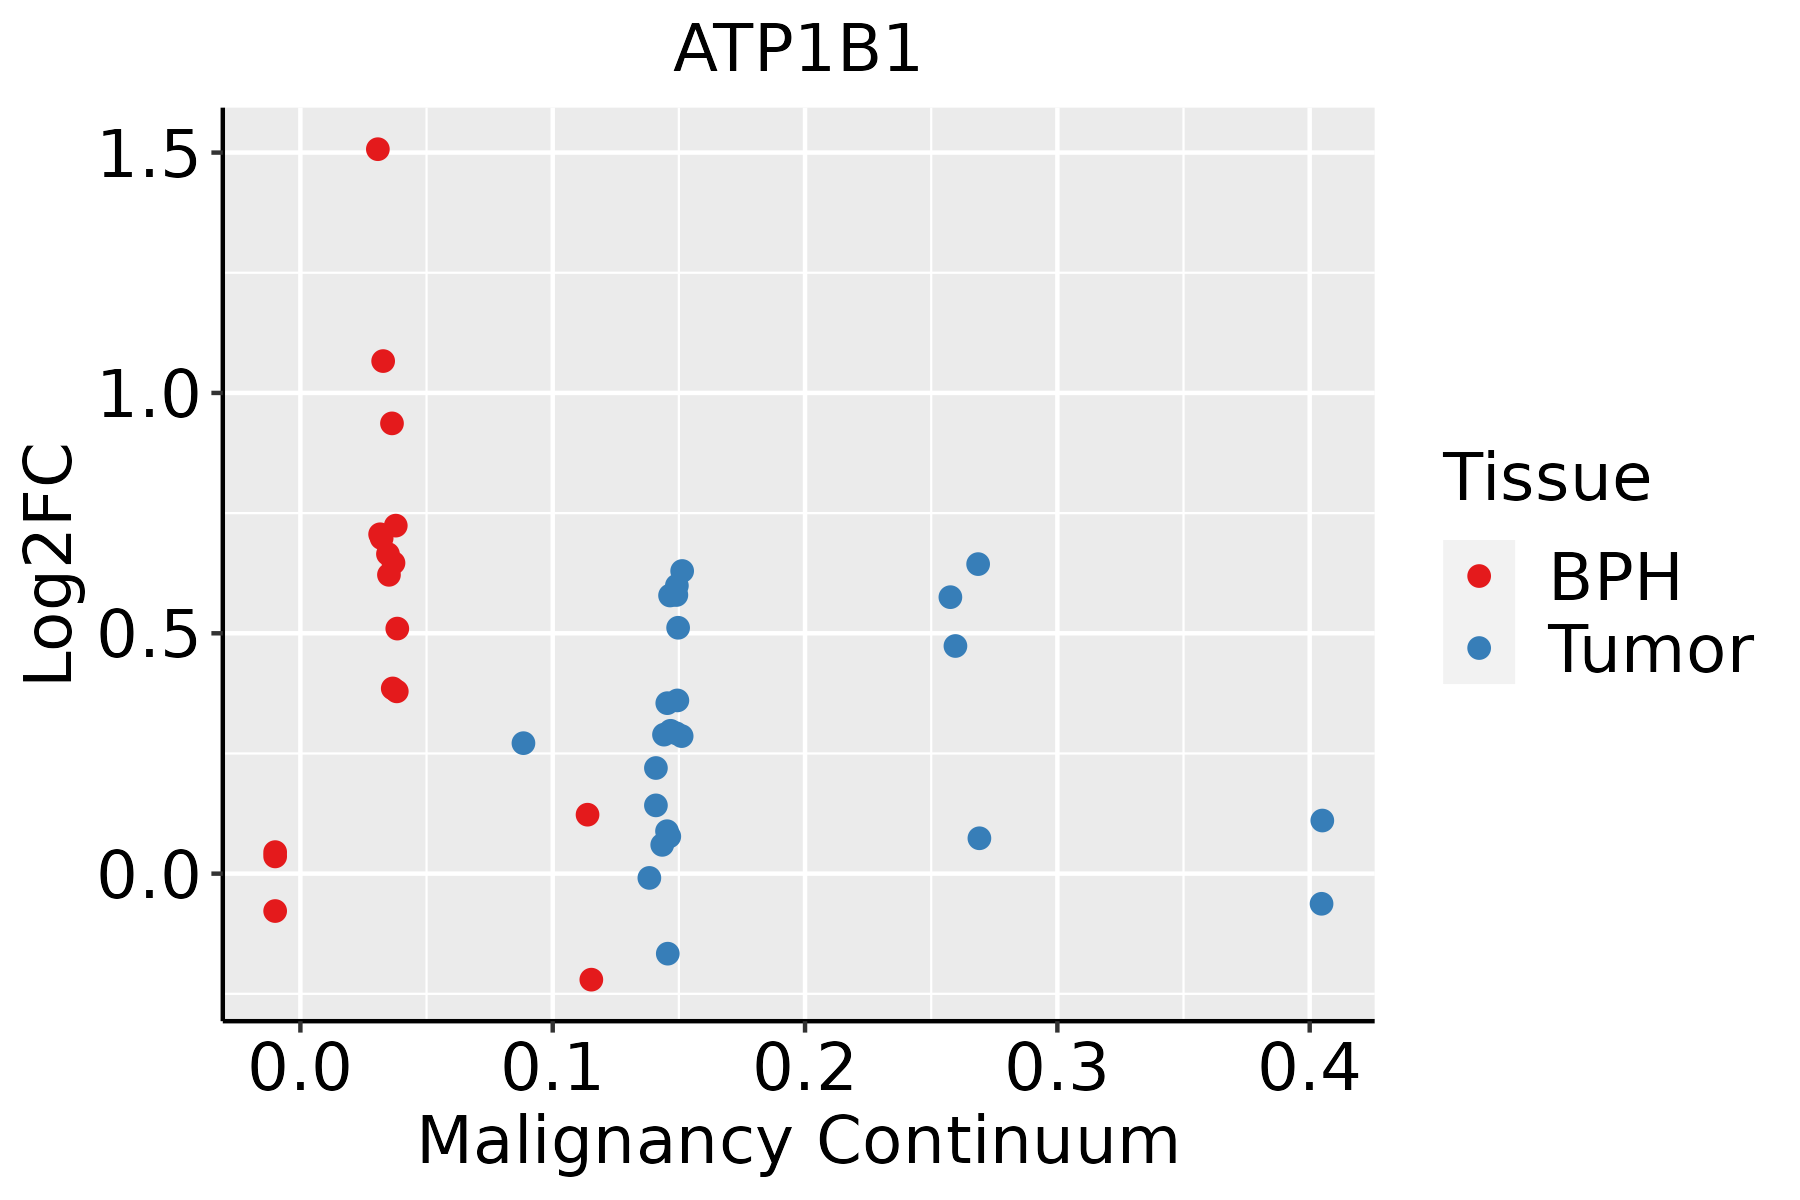 | BPH: Benign Prostatic Hyperplasia |
| Skin | 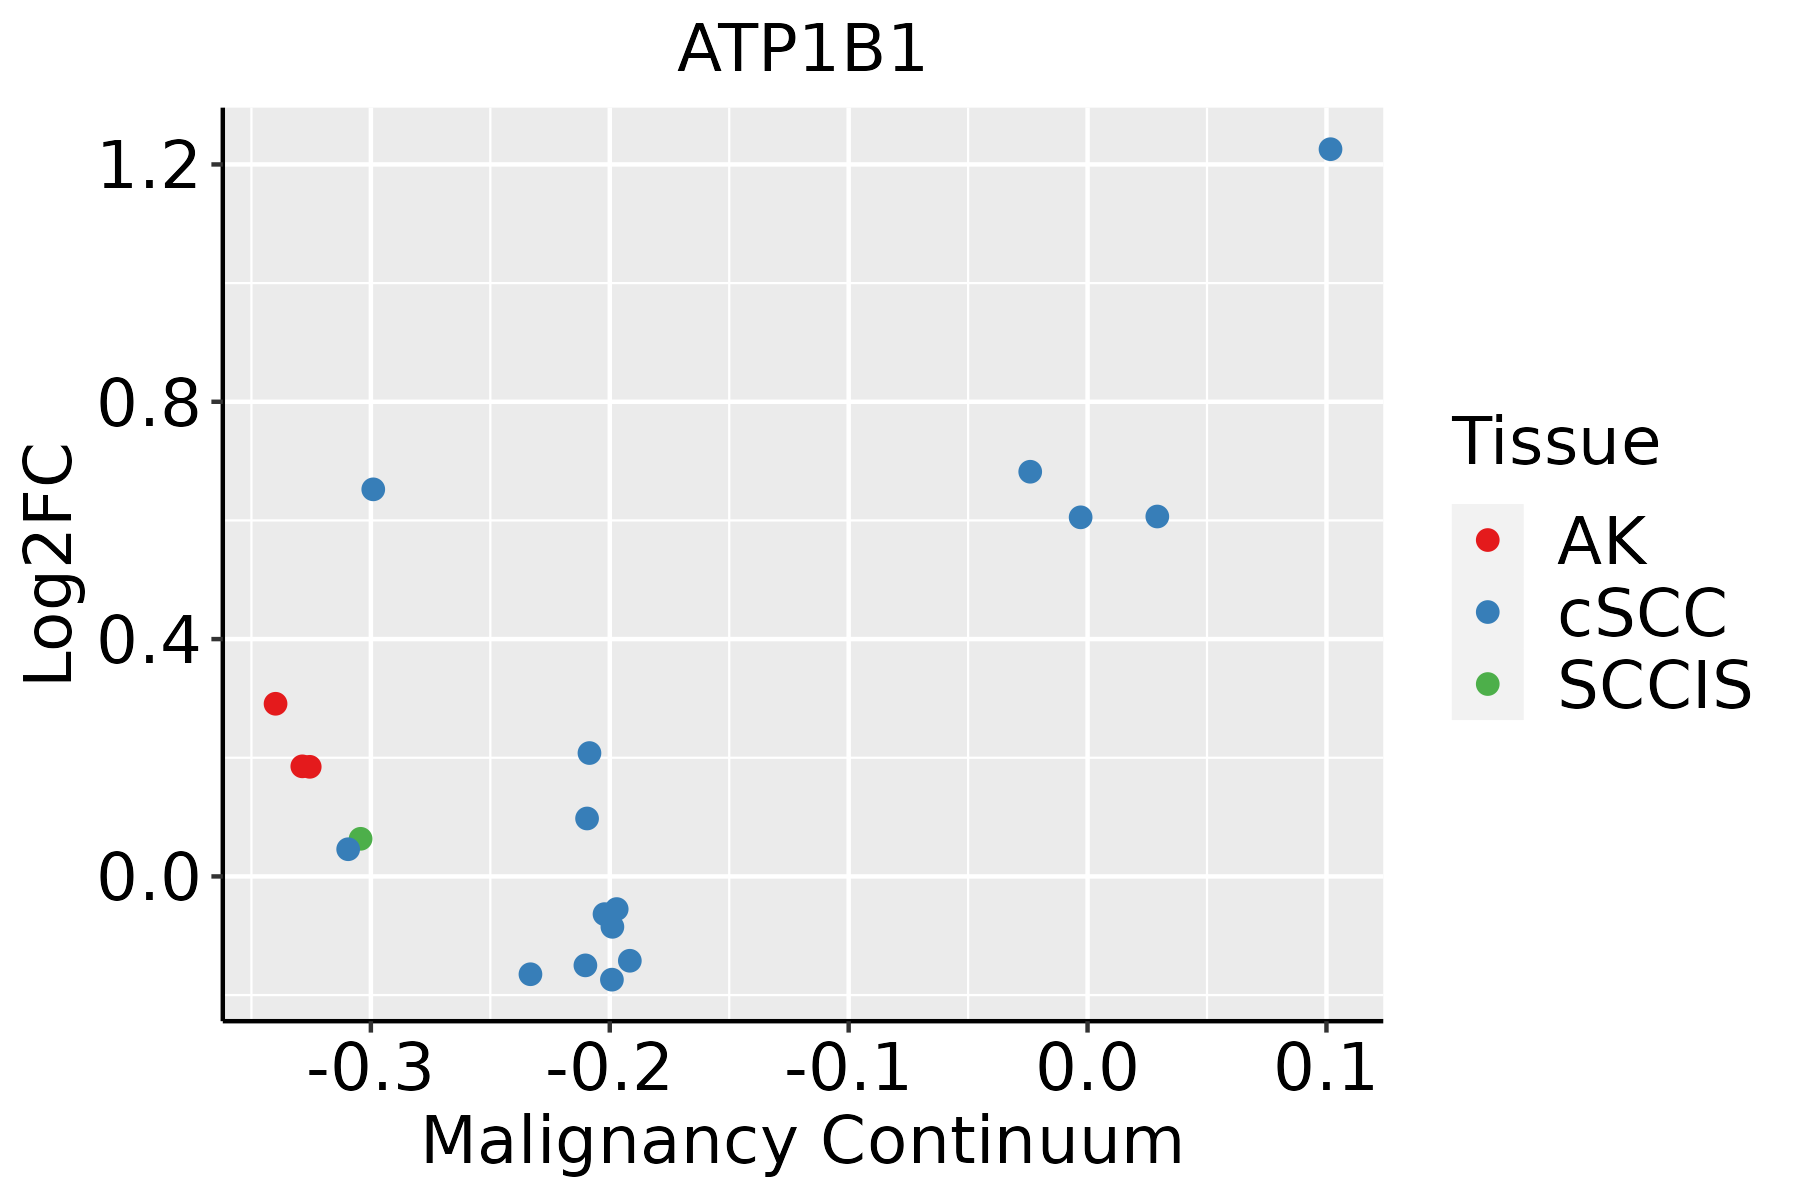 | AK: Actinic keratosis |
| cSCC: Cutaneous squamous cell carcinoma | ||
| SCCIS:squamous cell carcinoma in situ | ||
| Thyroid | 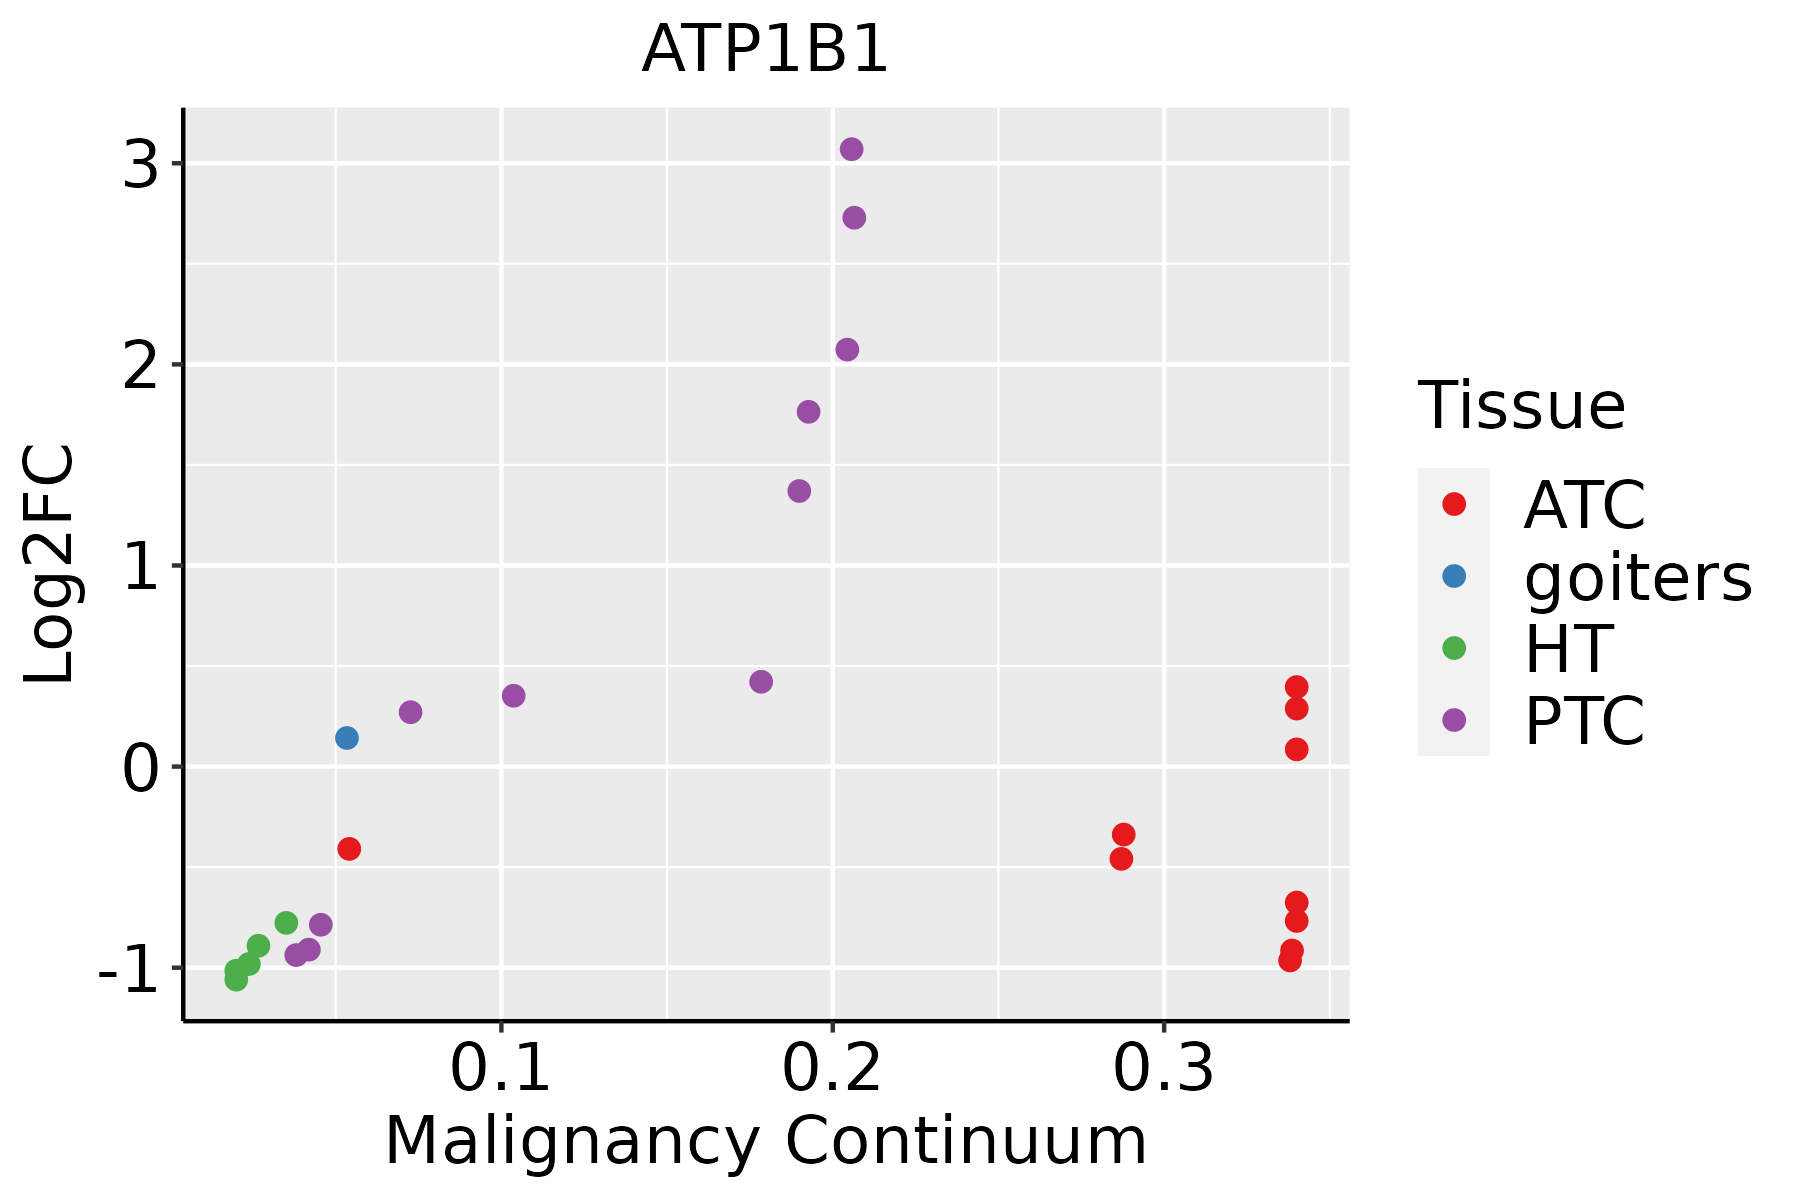 | ATC: Anaplastic thyroid cancer |
| HT: Hashimoto's thyroiditis | ||
| PTC: Papillary thyroid cancer |
| ∗log2FC in expression of this searched gene in stem-like cells from each diseased tissue sample relative to stem-like cells in normal samples in each tissue plotted against the malignancy continuum. Samples are colored based on if they are from different disease stage. |
Top |
Malignant transformation related pathway analysis |
| Find out the enriched GO biological processes and KEGG pathways involved in transition from healthy to precancer to cancer |
| Tissue | Disease Stage | Enriched GO biological Processes |
| Colorectum | AD |  |
| Colorectum | SER |  |
| Colorectum | MSS |  |
| Colorectum | MSI-H |  |
| Colorectum | FAP |  |
| ∗Top 15 enriched GO BP terms are showed in the bar plot of each disease state in each tissue. Each row represents a significant GO biological process which is colored according to the -log10(p.adjust). |
| Page: 1 2 3 4 5 6 7 8 9 |
| GO ID | Tissue | Disease Stage | Description | Gene Ratio | Bg Ratio | pvalue | p.adjust | Count |
| GO:0032409 | Colorectum | SER | regulation of transporter activity | 65/2897 | 310/18723 | 5.71e-03 | 4.19e-02 | 65 |
| GO:00460342 | Colorectum | MSS | ATP metabolic process | 125/3467 | 277/18723 | 1.38e-24 | 2.15e-21 | 125 |
| GO:00726592 | Colorectum | MSS | protein localization to plasma membrane | 113/3467 | 284/18723 | 3.23e-17 | 1.55e-14 | 113 |
| GO:19907782 | Colorectum | MSS | protein localization to cell periphery | 120/3467 | 333/18723 | 2.02e-14 | 5.47e-12 | 120 |
| GO:00316472 | Colorectum | MSS | regulation of protein stability | 103/3467 | 298/18723 | 2.52e-11 | 3.49e-09 | 103 |
| GO:00901502 | Colorectum | MSS | establishment of protein localization to membrane | 90/3467 | 260/18723 | 4.11e-10 | 3.49e-08 | 90 |
| GO:00508212 | Colorectum | MSS | protein stabilization | 68/3467 | 191/18723 | 1.53e-08 | 8.81e-07 | 68 |
| GO:00020282 | Colorectum | MSS | regulation of sodium ion transport | 32/3467 | 90/18723 | 9.56e-05 | 1.50e-03 | 32 |
| GO:19023052 | Colorectum | MSS | regulation of sodium ion transmembrane transport | 26/3467 | 68/18723 | 1.08e-04 | 1.68e-03 | 26 |
| GO:20006492 | Colorectum | MSS | regulation of sodium ion transmembrane transporter activity | 22/3467 | 58/18723 | 4.06e-04 | 4.99e-03 | 22 |
| GO:00107652 | Colorectum | MSS | positive regulation of sodium ion transport | 15/3467 | 35/18723 | 7.59e-04 | 8.09e-03 | 15 |
| GO:0086001 | Colorectum | MSS | cardiac muscle cell action potential | 26/3467 | 76/18723 | 8.18e-04 | 8.59e-03 | 26 |
| GO:0086065 | Colorectum | MSS | cell communication involved in cardiac conduction | 21/3467 | 58/18723 | 1.11e-03 | 1.09e-02 | 21 |
| GO:00902572 | Colorectum | MSS | regulation of muscle system process | 66/3467 | 252/18723 | 1.55e-03 | 1.41e-02 | 66 |
| GO:00324091 | Colorectum | MSS | regulation of transporter activity | 78/3467 | 310/18723 | 2.09e-03 | 1.78e-02 | 78 |
| GO:0034764 | Colorectum | MSS | positive regulation of transmembrane transport | 58/3467 | 219/18723 | 2.19e-03 | 1.83e-02 | 58 |
| GO:19023072 | Colorectum | MSS | positive regulation of sodium ion transmembrane transport | 10/3467 | 21/18723 | 2.23e-03 | 1.84e-02 | 10 |
| GO:00300042 | Colorectum | MSS | cellular monovalent inorganic cation homeostasis | 31/3467 | 103/18723 | 2.94e-03 | 2.27e-02 | 31 |
| GO:00324112 | Colorectum | MSS | positive regulation of transporter activity | 35/3467 | 120/18723 | 2.95e-03 | 2.28e-02 | 35 |
| GO:0086064 | Colorectum | MSS | cell communication by electrical coupling involved in cardiac conduction | 11/3467 | 25/18723 | 2.96e-03 | 2.28e-02 | 11 |
| Page: 1 2 3 4 5 6 7 8 9 10 11 12 13 14 15 16 17 18 19 20 21 22 23 24 25 26 27 28 29 |
| Pathway ID | Tissue | Disease Stage | Description | Gene Ratio | Bg Ratio | pvalue | p.adjust | qvalue | Count |
| hsa0426016 | Breast | Precancer | Cardiac muscle contraction | 22/684 | 87/8465 | 9.72e-07 | 1.62e-05 | 1.24e-05 | 22 |
| hsa0496110 | Breast | Precancer | Endocrine and other factor-regulated calcium reabsorption | 11/684 | 53/8465 | 2.92e-03 | 1.81e-02 | 1.39e-02 | 11 |
| hsa0497114 | Breast | Precancer | Gastric acid secretion | 13/684 | 76/8465 | 7.35e-03 | 4.07e-02 | 3.12e-02 | 13 |
| hsa0426017 | Breast | Precancer | Cardiac muscle contraction | 22/684 | 87/8465 | 9.72e-07 | 1.62e-05 | 1.24e-05 | 22 |
| hsa0496111 | Breast | Precancer | Endocrine and other factor-regulated calcium reabsorption | 11/684 | 53/8465 | 2.92e-03 | 1.81e-02 | 1.39e-02 | 11 |
| hsa0497115 | Breast | Precancer | Gastric acid secretion | 13/684 | 76/8465 | 7.35e-03 | 4.07e-02 | 3.12e-02 | 13 |
| hsa0491916 | Breast | IDC | Thyroid hormone signaling pathway | 23/867 | 121/8465 | 2.45e-03 | 1.69e-02 | 1.27e-02 | 23 |
| hsa0497122 | Breast | IDC | Gastric acid secretion | 16/867 | 76/8465 | 3.80e-03 | 2.33e-02 | 1.74e-02 | 16 |
| hsa0496121 | Breast | IDC | Endocrine and other factor-regulated calcium reabsorption | 12/867 | 53/8465 | 6.29e-03 | 3.30e-02 | 2.47e-02 | 12 |
| hsa0497812 | Breast | IDC | Mineral absorption | 13/867 | 60/8465 | 6.73e-03 | 3.42e-02 | 2.56e-02 | 13 |
| hsa0491917 | Breast | IDC | Thyroid hormone signaling pathway | 23/867 | 121/8465 | 2.45e-03 | 1.69e-02 | 1.27e-02 | 23 |
| hsa0497132 | Breast | IDC | Gastric acid secretion | 16/867 | 76/8465 | 3.80e-03 | 2.33e-02 | 1.74e-02 | 16 |
| hsa0496131 | Breast | IDC | Endocrine and other factor-regulated calcium reabsorption | 12/867 | 53/8465 | 6.29e-03 | 3.30e-02 | 2.47e-02 | 12 |
| hsa0497813 | Breast | IDC | Mineral absorption | 13/867 | 60/8465 | 6.73e-03 | 3.42e-02 | 2.56e-02 | 13 |
| hsa0426042 | Breast | DCIS | Cardiac muscle contraction | 22/846 | 87/8465 | 3.08e-05 | 3.43e-04 | 2.53e-04 | 22 |
| hsa0491922 | Breast | DCIS | Thyroid hormone signaling pathway | 23/846 | 121/8465 | 1.78e-03 | 1.22e-02 | 9.00e-03 | 23 |
| hsa0497142 | Breast | DCIS | Gastric acid secretion | 16/846 | 76/8465 | 2.97e-03 | 1.81e-02 | 1.33e-02 | 16 |
| hsa0496141 | Breast | DCIS | Endocrine and other factor-regulated calcium reabsorption | 12/846 | 53/8465 | 5.17e-03 | 2.69e-02 | 1.98e-02 | 12 |
| hsa0497821 | Breast | DCIS | Mineral absorption | 13/846 | 60/8465 | 5.48e-03 | 2.81e-02 | 2.07e-02 | 13 |
| hsa0426052 | Breast | DCIS | Cardiac muscle contraction | 22/846 | 87/8465 | 3.08e-05 | 3.43e-04 | 2.53e-04 | 22 |
| Page: 1 2 3 4 5 6 7 8 9 |
Top |
Cell-cell communication analysis |
| Identification of potential cell-cell interactions between two cell types and their ligand-receptor pairs for different disease states |
| Ligand | Receptor | LRpair | Pathway | Tissue | Disease Stage |
| Page: 1 |
Top |
Single-cell gene regulatory network inference analysis |
| Find out the significant the regulons (TFs) and the target genes of each regulon across cell types for different disease states |
| TF | Cell Type | Tissue | Disease Stage | Target Gene | RSS | Regulon Activity |
| ∗The dot plots of a searched regulon are shown for all cell subpopulations in each disease state of each tissue based on the regulon specific score inferred using pySCENIC and by calculating the average expression. |
| Page: 1 |
Top |
Somatic mutation of malignant transformation related genes |
| Annotation of somatic variants for genes involved in malignant transformation |
| Hugo Symbol | Variant Class | Variant Classification | dbSNP RS | HGVSc | HGVSp | HGVSp Short | SWISSPROT | BIOTYPE | SIFT | PolyPhen | Tumor Sample Barcode | Tissue | Histology | Sex | Age | Stage | Therapy Types | Drugs | Outcome |
| ATP1B1 | SNV | Missense_Mutation | rs758593381 | c.650G>A | p.Arg217Gln | p.R217Q | P05026 | protein_coding | deleterious(0.03) | possibly_damaging(0.821) | TCGA-AN-A046-01 | Breast | breast invasive carcinoma | Female | >=65 | I/II | Unknown | Unknown | SD |
| ATP1B1 | SNV | Missense_Mutation | c.237N>T | p.Gln79His | p.Q79H | P05026 | protein_coding | tolerated(0.56) | benign(0.015) | TCGA-E9-A1NF-01 | Breast | breast invasive carcinoma | Female | <65 | I/II | Chemotherapy | doxorubicin | PD | |
| ATP1B1 | insertion | Frame_Shift_Ins | novel | c.228_229insT | p.Leu77PhefsTer11 | p.L77Ffs*11 | P05026 | protein_coding | TCGA-BH-A0H3-01 | Breast | breast invasive carcinoma | Female | <65 | I/II | Unknown | Unknown | SD | ||
| ATP1B1 | deletion | Frame_Shift_Del | novel | c.339delA | p.Asp114IlefsTer8 | p.D114Ifs*8 | P05026 | protein_coding | TCGA-D8-A27V-01 | Breast | breast invasive carcinoma | Female | <65 | I/II | Hormone Therapy | tamoxiphen | SD | ||
| ATP1B1 | SNV | Missense_Mutation | rs369488918 | c.794A>G | p.Asn265Ser | p.N265S | P05026 | protein_coding | deleterious(0) | probably_damaging(0.999) | TCGA-EA-A439-01 | Cervix | cervical & endocervical cancer | Female | <65 | I/II | Unknown | Unknown | PD |
| ATP1B1 | SNV | Missense_Mutation | c.407N>A | p.Arg136Gln | p.R136Q | P05026 | protein_coding | tolerated(0.17) | probably_damaging(1) | TCGA-AA-A010-01 | Colorectum | colon adenocarcinoma | Female | <65 | I/II | Chemotherapy | folinic | CR | |
| ATP1B1 | insertion | Frame_Shift_Ins | novel | c.550_551insA | p.Leu184HisfsTer6 | p.L184Hfs*6 | P05026 | protein_coding | TCGA-AM-5820-01 | Colorectum | colon adenocarcinoma | Female | <65 | I/II | Unknown | Unknown | SD | ||
| ATP1B1 | insertion | In_Frame_Ins | novel | c.551_552insGATTAA | p.Leu184_Gly185insIleLys | p.L184_G185insIK | P05026 | protein_coding | TCGA-AM-5820-01 | Colorectum | colon adenocarcinoma | Female | <65 | I/II | Unknown | Unknown | SD | ||
| ATP1B1 | insertion | In_Frame_Ins | novel | c.752_753insTCACTATGT | p.Gln251delinsHisHisTyrVal | p.Q251delinsHHYV | P05026 | protein_coding | TCGA-AM-5820-01 | Colorectum | colon adenocarcinoma | Female | <65 | I/II | Unknown | Unknown | SD | ||
| ATP1B1 | SNV | Missense_Mutation | novel | c.4G>A | p.Ala2Thr | p.A2T | P05026 | protein_coding | deleterious(0.05) | probably_damaging(0.947) | TCGA-A5-A1OF-01 | Endometrium | uterine corpus endometrioid carcinoma | Female | <65 | I/II | Unknown | Unknown | SD |
| Page: 1 2 3 4 |
Top |
Related drugs of malignant transformation related genes |
| Identification of chemicals and drugs interact with genes involved in malignant transfromation |
| (DGIdb 4.0) |
| Entrez ID | Symbol | Category | Interaction Types | Drug Claim Name | Drug Name | PMIDs |
| 481 | ATP1B1 | DRUGGABLE GENOME, TRANSPORTER, ENZYME | inhibitor | CHEMBL1751 | DIGOXIN | |
| 481 | ATP1B1 | DRUGGABLE GENOME, TRANSPORTER, ENZYME | inhibitor | CHEMBL3545057 | ACETYLDIGITOXIN | |
| 481 | ATP1B1 | DRUGGABLE GENOME, TRANSPORTER, ENZYME | inhibitor | CHEMBL1614 | DESLANOSIDE | |
| 481 | ATP1B1 | DRUGGABLE GENOME, TRANSPORTER, ENZYME | inhibitor | CHEMBL254219 | DIGITOXIN |
| Page: 1 |

Copyright 2023-Present -The University of Texas Health Science Center at Houston |