
|
|||||
|
 | |
| |
| |
| |
| |
| |
|
Gene: ABHD3 |
Gene summary for ABHD3 |
| Gene information | Species | Human | Gene symbol | ABHD3 | Gene ID | 171586 |
| Gene name | abhydrolase domain containing 3, phospholipase | |
| Gene Alias | LABH3 | |
| Cytomap | 18q11.2 | |
| Gene Type | protein-coding | GO ID | GO:0006082 | UniProtAcc | J3KTE1 |
Top |
Malignant transformation analysis |
| Identification of the aberrant gene expression in precancerous and cancerous lesions by comparing the gene expression of stem-like cells in diseased tissues with normal stem cells |
| Entrez ID | Symbol | Replicates | Species | Organ | Tissue | Adj P-value | Log2FC | Malignancy |
| 171586 | ABHD3 | CCI_1 | Human | Cervix | CC | 4.92e-05 | 9.10e-01 | 0.528 |
| 171586 | ABHD3 | CCI_3 | Human | Cervix | CC | 1.76e-05 | 6.00e-01 | 0.516 |
| 171586 | ABHD3 | T1 | Human | Cervix | CC | 1.06e-05 | 3.96e-01 | 0.0918 |
| 171586 | ABHD3 | HTA11_2487_2000001011 | Human | Colorectum | SER | 9.73e-04 | 4.19e-01 | -0.1808 |
| 171586 | ABHD3 | HTA11_1938_2000001011 | Human | Colorectum | AD | 2.06e-04 | 6.12e-01 | -0.0811 |
| 171586 | ABHD3 | HTA11_347_2000001011 | Human | Colorectum | AD | 4.19e-10 | 4.92e-01 | -0.1954 |
| 171586 | ABHD3 | HTA11_411_2000001011 | Human | Colorectum | SER | 1.20e-03 | 9.44e-01 | -0.2602 |
| 171586 | ABHD3 | HTA11_1391_2000001011 | Human | Colorectum | AD | 4.80e-02 | 4.38e-01 | -0.059 |
| 171586 | ABHD3 | HTA11_99999971662_82457 | Human | Colorectum | MSS | 7.54e-11 | -5.00e-01 | 0.3859 |
| 171586 | ABHD3 | HTA11_99999974143_84620 | Human | Colorectum | MSS | 3.21e-15 | -5.42e-01 | 0.3005 |
| 171586 | ABHD3 | A002-C-010 | Human | Colorectum | FAP | 1.30e-03 | 2.50e-01 | 0.242 |
| 171586 | ABHD3 | A015-C-203 | Human | Colorectum | FAP | 1.09e-15 | -3.32e-01 | -0.1294 |
| 171586 | ABHD3 | A015-C-204 | Human | Colorectum | FAP | 1.54e-02 | -2.89e-01 | -0.0228 |
| 171586 | ABHD3 | A002-C-201 | Human | Colorectum | FAP | 2.46e-05 | -1.90e-01 | 0.0324 |
| 171586 | ABHD3 | A001-C-119 | Human | Colorectum | FAP | 6.01e-07 | -4.83e-01 | -0.1557 |
| 171586 | ABHD3 | A001-C-108 | Human | Colorectum | FAP | 3.70e-10 | -2.52e-01 | -0.0272 |
| 171586 | ABHD3 | A002-C-205 | Human | Colorectum | FAP | 1.41e-13 | -4.72e-01 | -0.1236 |
| 171586 | ABHD3 | A015-C-006 | Human | Colorectum | FAP | 9.81e-11 | -5.49e-01 | -0.0994 |
| 171586 | ABHD3 | A015-C-106 | Human | Colorectum | FAP | 2.10e-06 | -2.82e-01 | -0.0511 |
| 171586 | ABHD3 | A002-C-114 | Human | Colorectum | FAP | 3.40e-08 | -3.20e-01 | -0.1561 |
| Page: 1 2 3 4 5 6 7 8 |
| Tissue | Expression Dynamics | Abbreviation |
| Cervix |  | CC: Cervix cancer |
| HSIL_HPV: HPV-infected high-grade squamous intraepithelial lesions | ||
| N_HPV: HPV-infected normal cervix | ||
| Colorectum (GSE201348) | 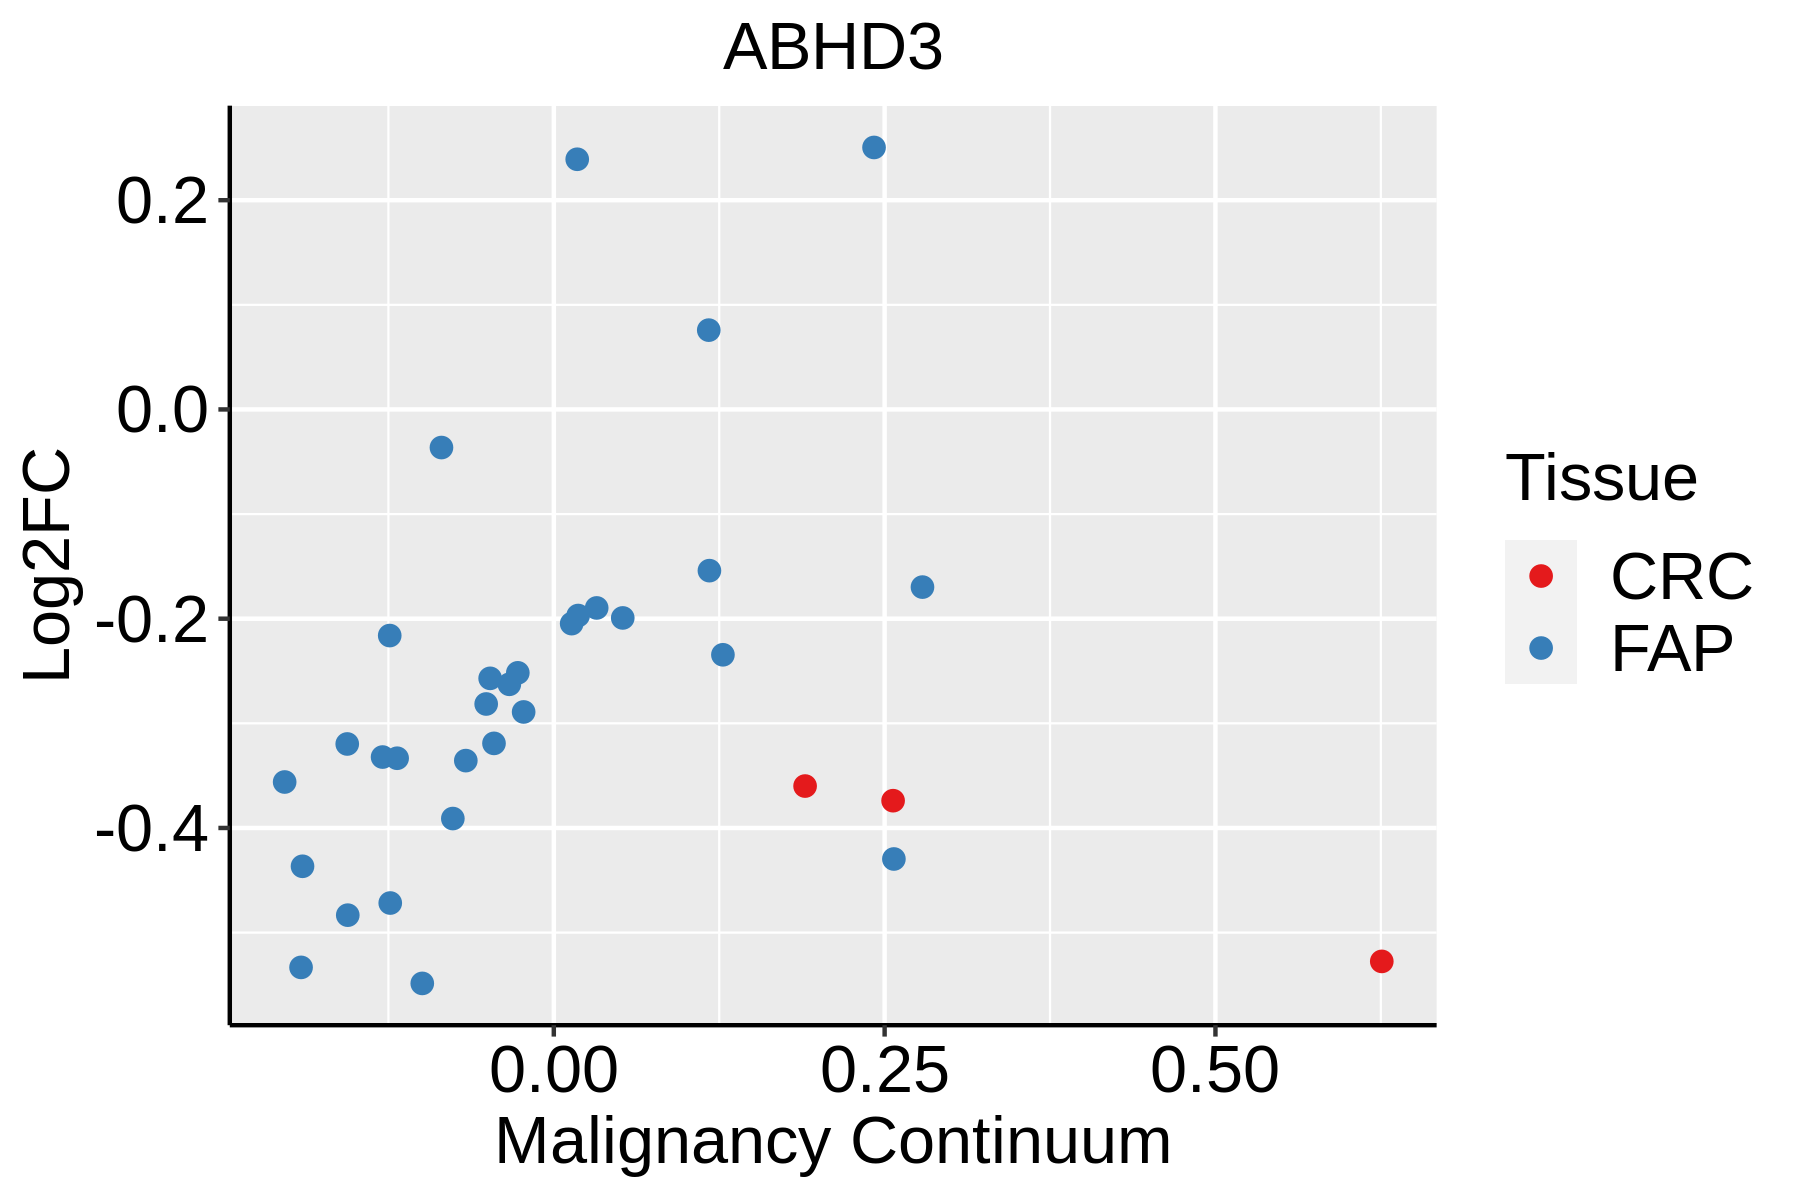 | FAP: Familial adenomatous polyposis |
| CRC: Colorectal cancer | ||
| Colorectum (HTA11) |  | AD: Adenomas |
| SER: Sessile serrated lesions | ||
| MSI-H: Microsatellite-high colorectal cancer | ||
| MSS: Microsatellite stable colorectal cancer | ||
| Esophagus | 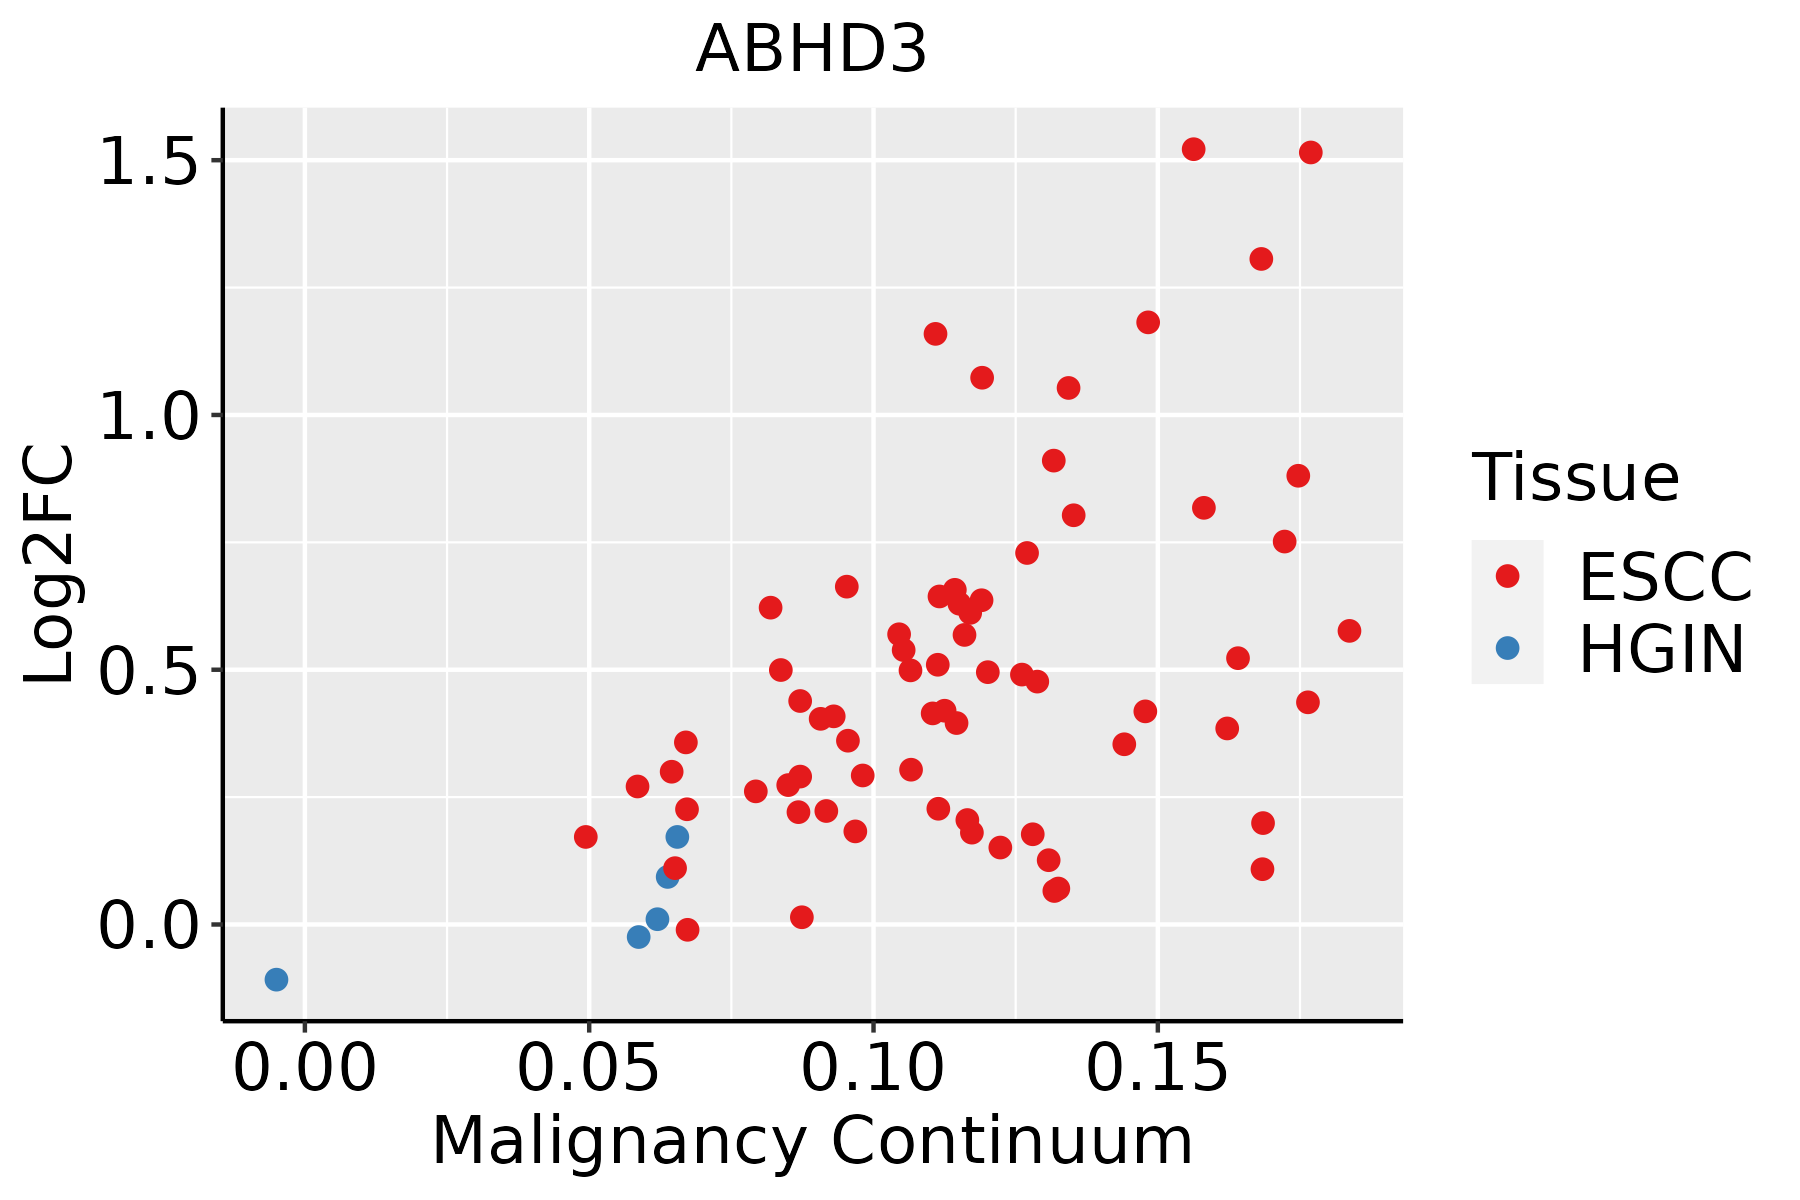 | ESCC: Esophageal squamous cell carcinoma |
| HGIN: High-grade intraepithelial neoplasias | ||
| LGIN: Low-grade intraepithelial neoplasias | ||
| GC | 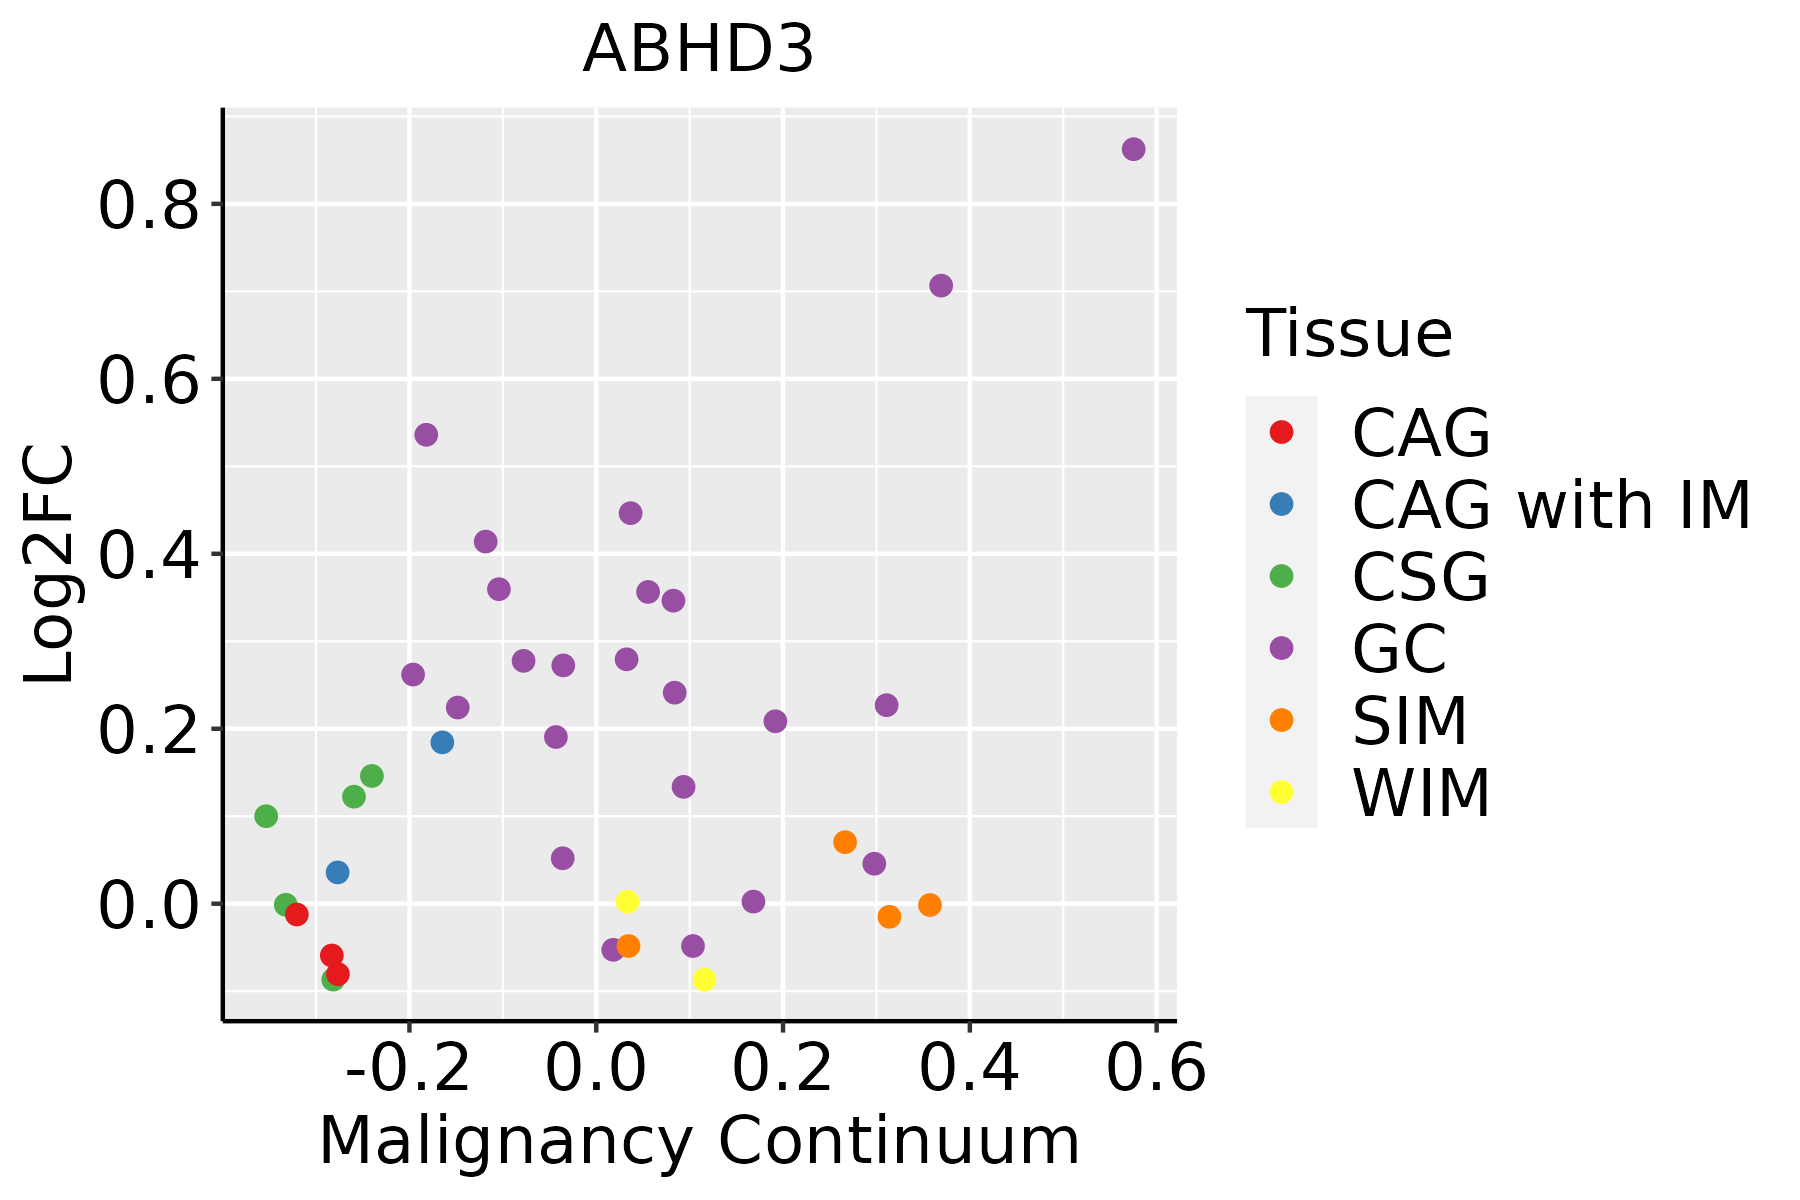 | CAG: Chronic atrophic gastritis |
| CAG with IM: Chronic atrophic gastritis with intestinal metaplasia | ||
| CSG: Chronic superficial gastritis | ||
| GC: Gastric cancer | ||
| SIM: Severe intestinal metaplasia | ||
| WIM: Wild intestinal metaplasia | ||
| Liver | 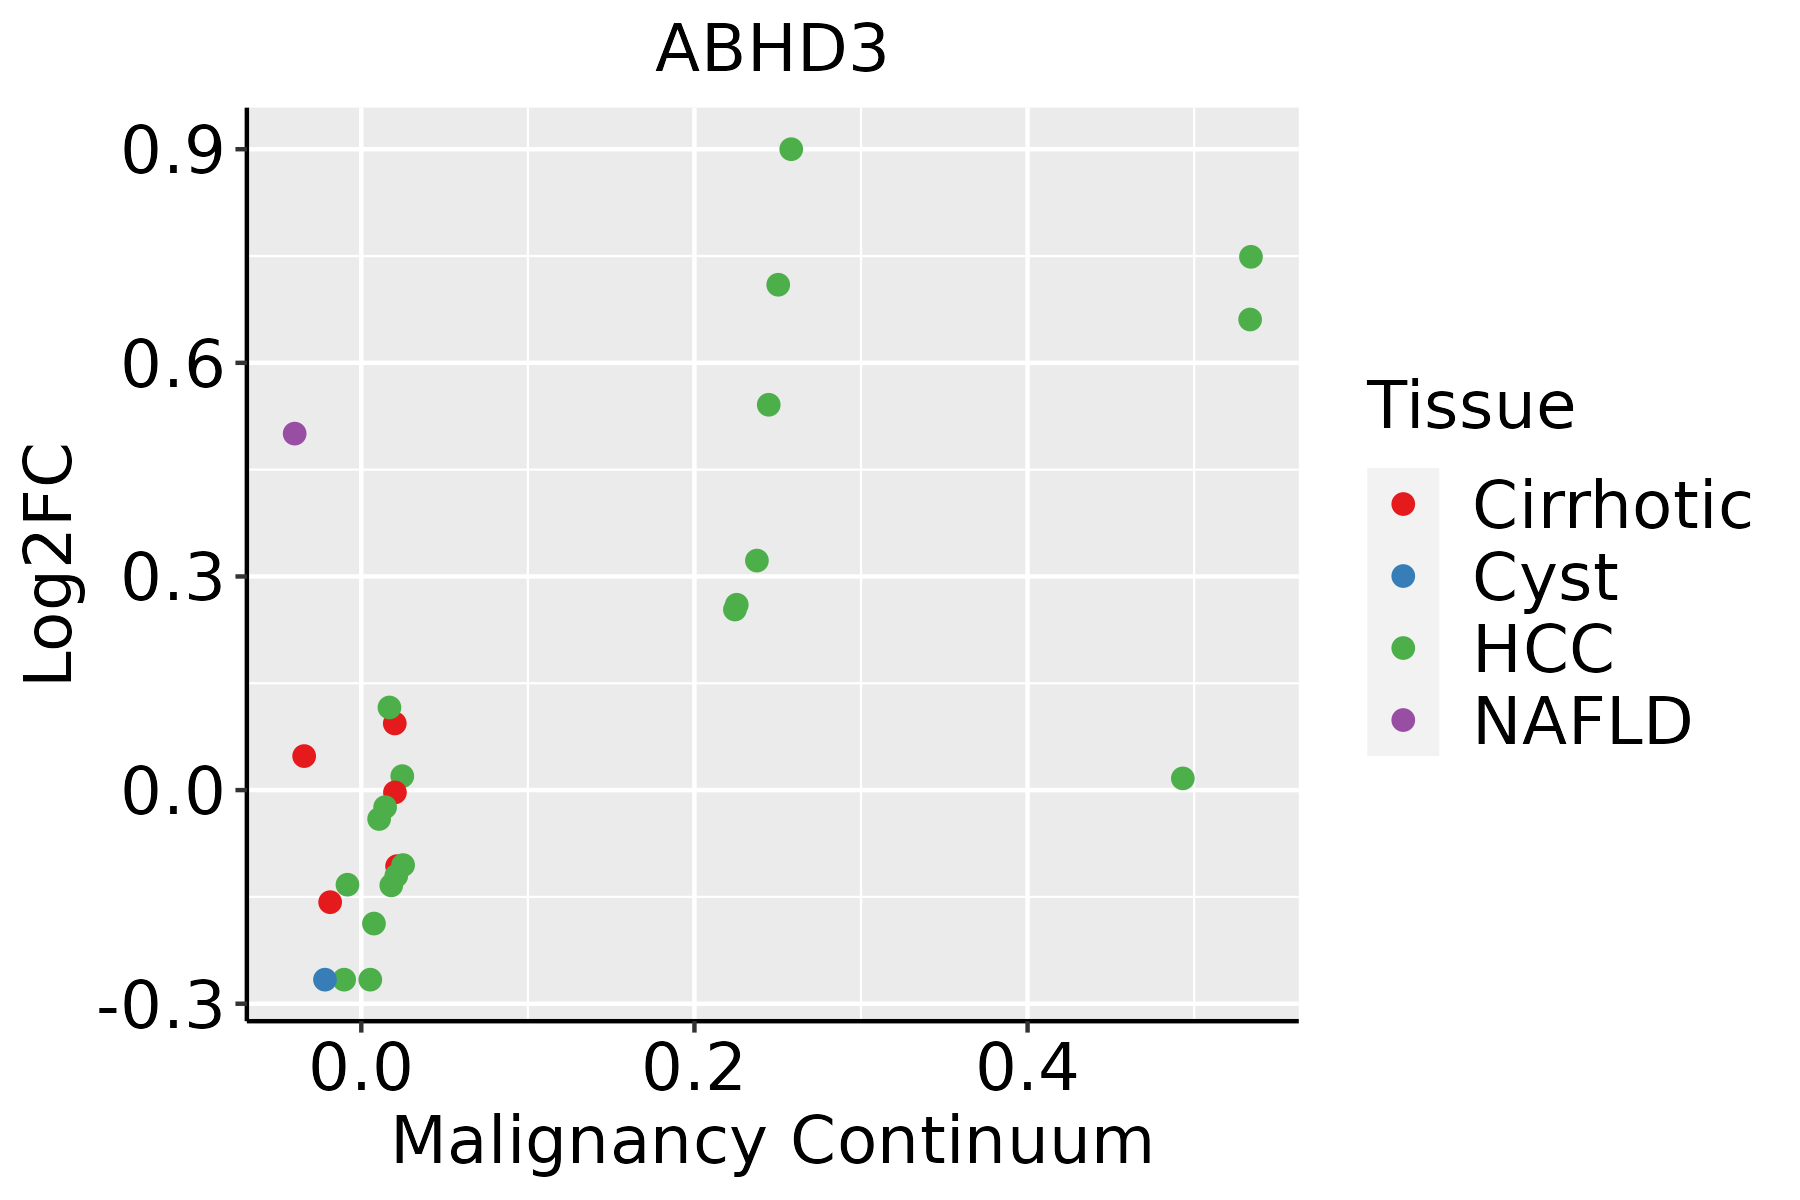 | HCC: Hepatocellular carcinoma |
| NAFLD: Non-alcoholic fatty liver disease | ||
| Lung |  | AAH: Atypical adenomatous hyperplasia |
| AIS: Adenocarcinoma in situ | ||
| IAC: Invasive lung adenocarcinoma | ||
| MIA: Minimally invasive adenocarcinoma | ||
| Oral Cavity | 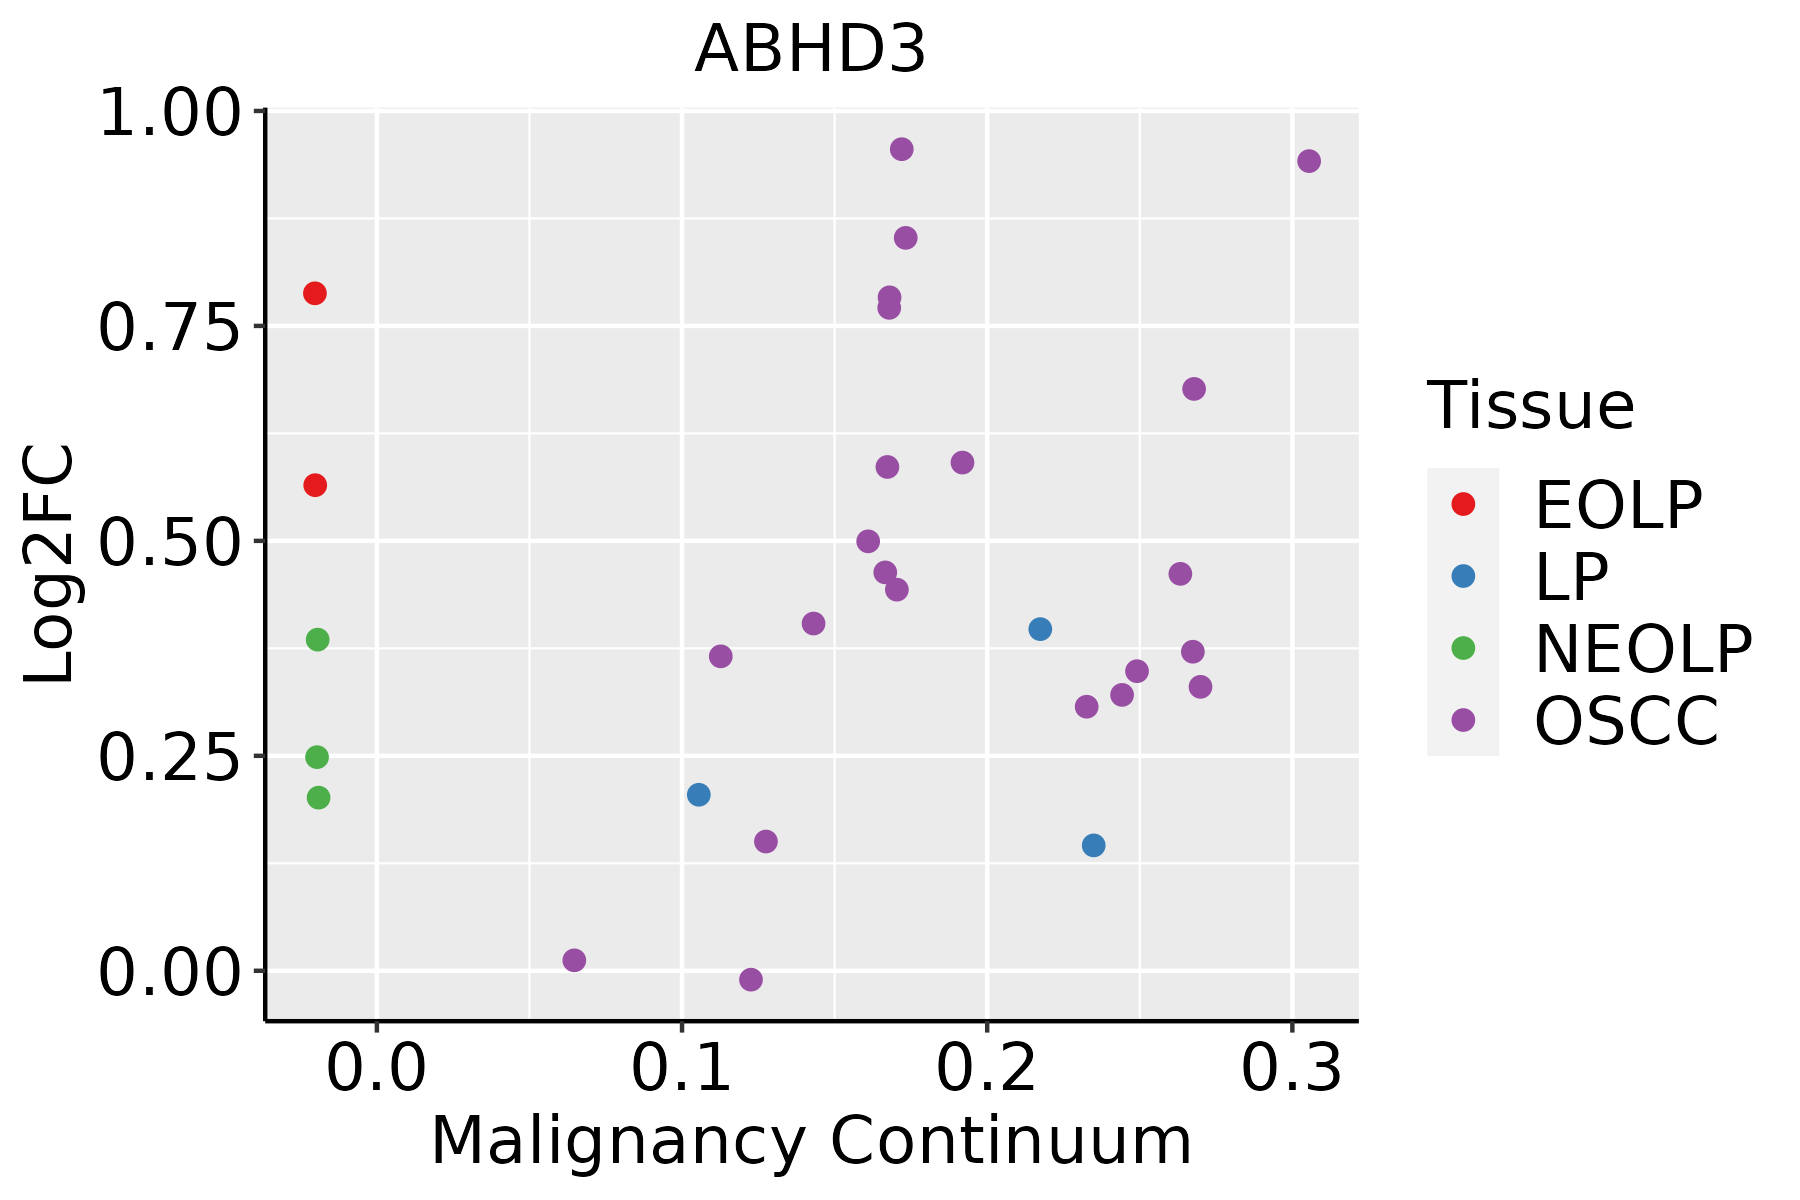 | EOLP: Erosive Oral lichen planus |
| LP: leukoplakia | ||
| NEOLP: Non-erosive oral lichen planus | ||
| OSCC: Oral squamous cell carcinoma | ||
| Skin | 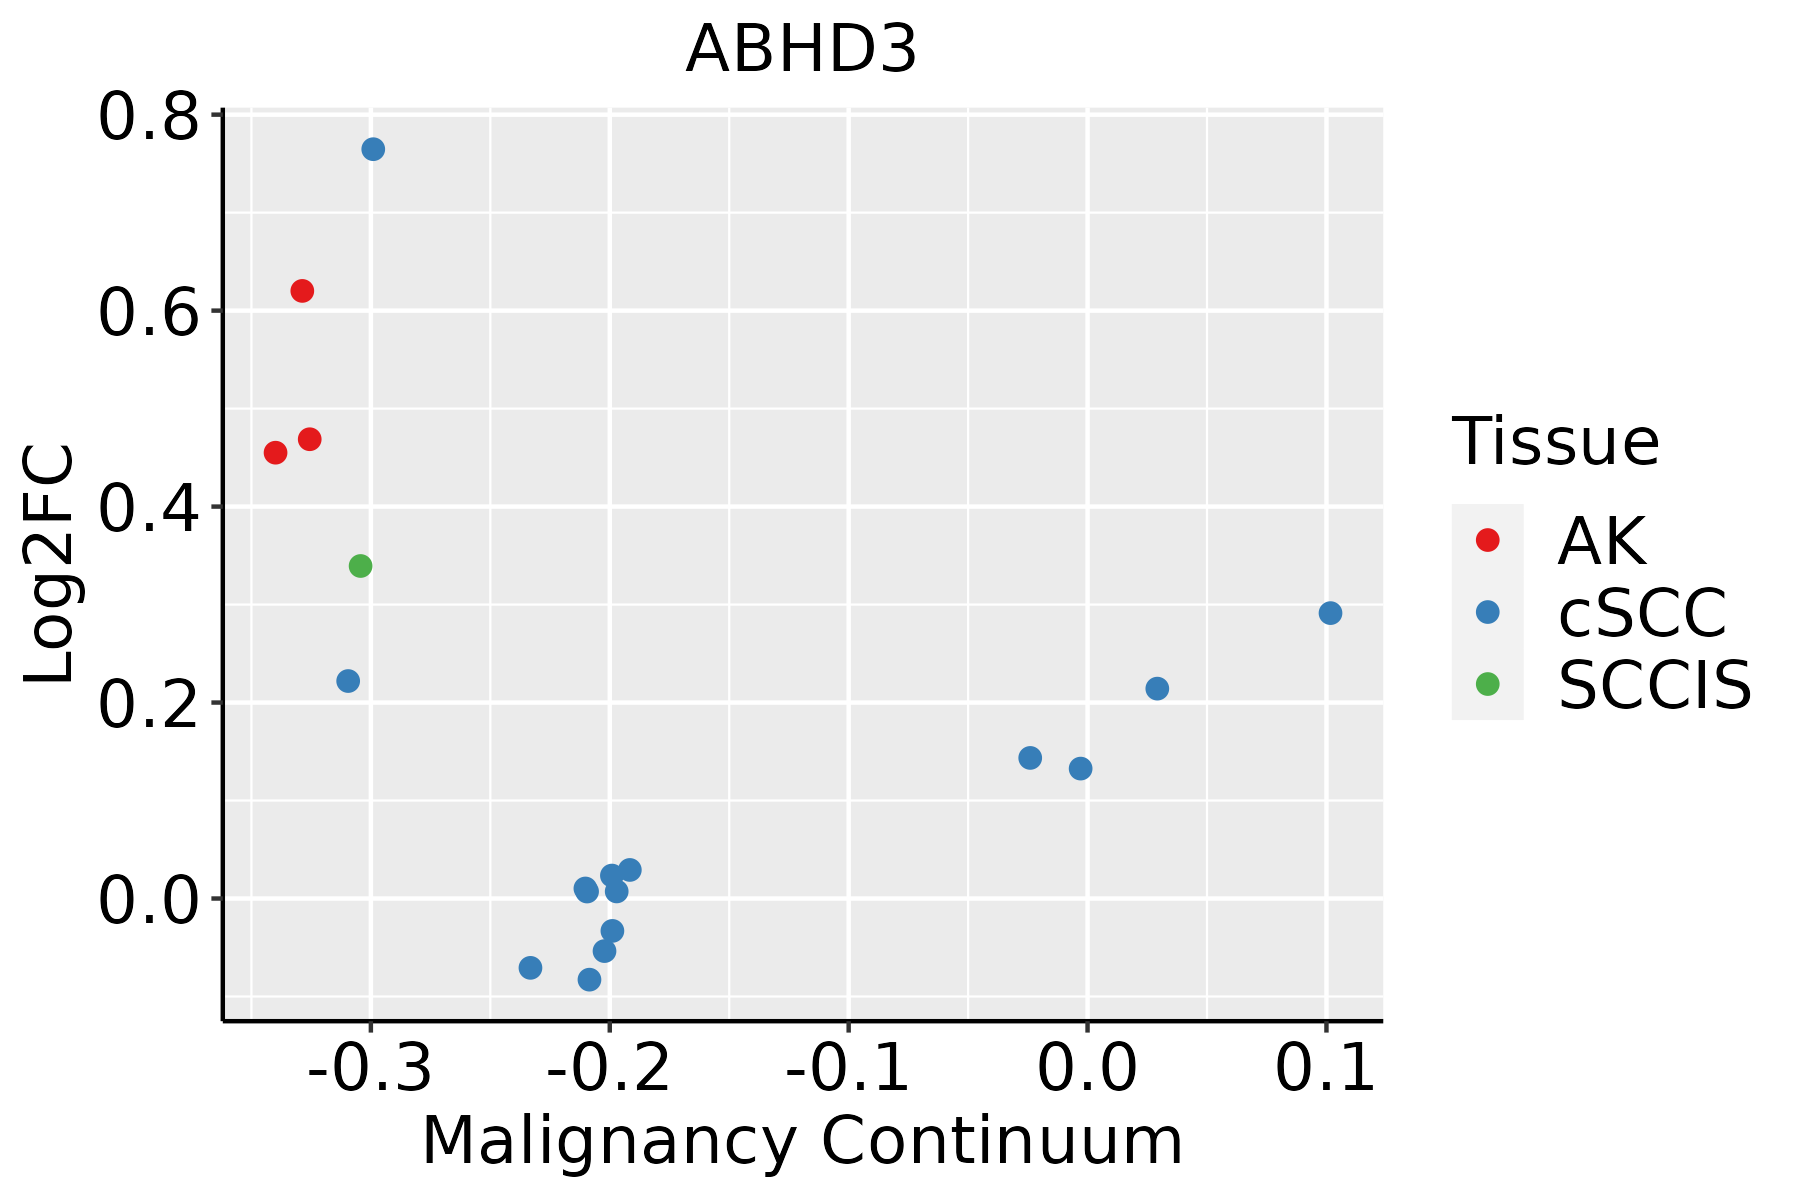 | AK: Actinic keratosis |
| cSCC: Cutaneous squamous cell carcinoma | ||
| SCCIS:squamous cell carcinoma in situ |
| ∗log2FC in expression of this searched gene in stem-like cells from each diseased tissue sample relative to stem-like cells in normal samples in each tissue plotted against the malignancy continuum. Samples are colored based on if they are from different disease stage. |
Top |
Malignant transformation related pathway analysis |
| Find out the enriched GO biological processes and KEGG pathways involved in transition from healthy to precancer to cancer |
| Tissue | Disease Stage | Enriched GO biological Processes |
| Colorectum | AD |  |
| Colorectum | SER |  |
| Colorectum | MSS |  |
| Colorectum | MSI-H |  |
| Colorectum | FAP |  |
| ∗Top 15 enriched GO BP terms are showed in the bar plot of each disease state in each tissue. Each row represents a significant GO biological process which is colored according to the -log10(p.adjust). |
| Page: 1 2 3 4 5 6 7 8 9 |
| GO ID | Tissue | Disease Stage | Description | Gene Ratio | Bg Ratio | pvalue | p.adjust | Count |
| GO:001605311 | Stomach | CAG with IM | organic acid biosynthetic process | 31/1050 | 316/18723 | 1.81e-03 | 1.94e-02 | 31 |
| GO:004424211 | Stomach | CAG with IM | cellular lipid catabolic process | 22/1050 | 214/18723 | 4.51e-03 | 3.77e-02 | 22 |
| GO:00723301 | Stomach | CAG with IM | monocarboxylic acid biosynthetic process | 22/1050 | 214/18723 | 4.51e-03 | 3.77e-02 | 22 |
| GO:000663121 | Stomach | CSG | fatty acid metabolic process | 43/1034 | 390/18723 | 1.25e-05 | 4.20e-04 | 43 |
| GO:00066332 | Stomach | CSG | fatty acid biosynthetic process | 19/1034 | 163/18723 | 1.68e-03 | 1.85e-02 | 19 |
| GO:00463942 | Stomach | CSG | carboxylic acid biosynthetic process | 30/1034 | 314/18723 | 2.52e-03 | 2.46e-02 | 30 |
| GO:00160532 | Stomach | CSG | organic acid biosynthetic process | 30/1034 | 316/18723 | 2.77e-03 | 2.63e-02 | 30 |
| Page: 1 2 3 4 5 6 7 8 |
| Pathway ID | Tissue | Disease Stage | Description | Gene Ratio | Bg Ratio | pvalue | p.adjust | qvalue | Count |
| Page: 1 |
Top |
Cell-cell communication analysis |
| Identification of potential cell-cell interactions between two cell types and their ligand-receptor pairs for different disease states |
| Ligand | Receptor | LRpair | Pathway | Tissue | Disease Stage |
| Page: 1 |
Top |
Single-cell gene regulatory network inference analysis |
| Find out the significant the regulons (TFs) and the target genes of each regulon across cell types for different disease states |
| TF | Cell Type | Tissue | Disease Stage | Target Gene | RSS | Regulon Activity |
| ∗The dot plots of a searched regulon are shown for all cell subpopulations in each disease state of each tissue based on the regulon specific score inferred using pySCENIC and by calculating the average expression. |
| Page: 1 |
Top |
Somatic mutation of malignant transformation related genes |
| Annotation of somatic variants for genes involved in malignant transformation |
| Hugo Symbol | Variant Class | Variant Classification | dbSNP RS | HGVSc | HGVSp | HGVSp Short | SWISSPROT | BIOTYPE | SIFT | PolyPhen | Tumor Sample Barcode | Tissue | Histology | Sex | Age | Stage | Therapy Types | Drugs | Outcome |
| ABHD3 | SNV | Missense_Mutation | c.926N>T | p.Thr309Ile | p.T309I | Q8WU67 | protein_coding | deleterious(0.04) | possibly_damaging(0.702) | TCGA-BH-A0HF-01 | Breast | breast invasive carcinoma | Female | >=65 | I/II | Hormone Therapy | arimidex | SD | |
| ABHD3 | SNV | Missense_Mutation | c.189N>T | p.Glu63Asp | p.E63D | Q8WU67 | protein_coding | tolerated(0.3) | benign(0.001) | TCGA-2W-A8YY-01 | Cervix | cervical & endocervical cancer | Female | <65 | I/II | Chemotherapy | cisplatin | CR | |
| ABHD3 | SNV | Missense_Mutation | c.74N>A | p.Val25Glu | p.V25E | Q8WU67 | protein_coding | tolerated(0.1) | benign(0.007) | TCGA-AF-A56L-01 | Colorectum | rectum adenocarcinoma | Female | <65 | III/IV | Chemotherapy | oxaliplatin | CR | |
| ABHD3 | SNV | Missense_Mutation | c.1073C>T | p.Thr358Ile | p.T358I | Q8WU67 | protein_coding | tolerated(0.12) | benign(0.021) | TCGA-AG-A002-01 | Colorectum | rectum adenocarcinoma | Male | <65 | I/II | Unknown | Unknown | SD | |
| ABHD3 | SNV | Missense_Mutation | c.469A>C | p.Ile157Leu | p.I157L | Q8WU67 | protein_coding | deleterious(0.02) | possibly_damaging(0.53) | TCGA-AG-A002-01 | Colorectum | rectum adenocarcinoma | Male | <65 | I/II | Unknown | Unknown | SD | |
| ABHD3 | SNV | Missense_Mutation | novel | c.448N>A | p.Gly150Arg | p.G150R | Q8WU67 | protein_coding | deleterious(0) | probably_damaging(1) | TCGA-A5-A0G1-01 | Endometrium | uterine corpus endometrioid carcinoma | Female | >=65 | I/II | Unknown | Unknown | SD |
| ABHD3 | SNV | Missense_Mutation | novel | c.448N>A | p.Gly150Arg | p.G150R | Q8WU67 | protein_coding | deleterious(0) | probably_damaging(1) | TCGA-A5-A0GG-01 | Endometrium | uterine corpus endometrioid carcinoma | Female | >=65 | I/II | Unknown | Unknown | SD |
| ABHD3 | SNV | Missense_Mutation | novel | c.662N>C | p.Met221Thr | p.M221T | Q8WU67 | protein_coding | deleterious(0) | possibly_damaging(0.864) | TCGA-A5-A1OF-01 | Endometrium | uterine corpus endometrioid carcinoma | Female | <65 | I/II | Unknown | Unknown | SD |
| ABHD3 | SNV | Missense_Mutation | c.842N>G | p.Lys281Arg | p.K281R | Q8WU67 | protein_coding | tolerated(1) | benign(0.003) | TCGA-AP-A051-01 | Endometrium | uterine corpus endometrioid carcinoma | Female | >=65 | I/II | Unknown | Unknown | SD | |
| ABHD3 | SNV | Missense_Mutation | novel | c.223N>A | p.Val75Met | p.V75M | Q8WU67 | protein_coding | deleterious(0.03) | benign(0.371) | TCGA-AX-A06F-01 | Endometrium | uterine corpus endometrioid carcinoma | Female | <65 | III/IV | Chemotherapy | carboplatin | SD |
| Page: 1 2 3 4 |
Top |
Related drugs of malignant transformation related genes |
| Identification of chemicals and drugs interact with genes involved in malignant transfromation |
| (DGIdb 4.0) |
| Entrez ID | Symbol | Category | Interaction Types | Drug Claim Name | Drug Name | PMIDs |
| Page: 1 |

Copyright 2023-Present -The University of Texas Health Science Center at Houston |