| Tissue | Expression Dynamics | Abbreviation |
| Breast | 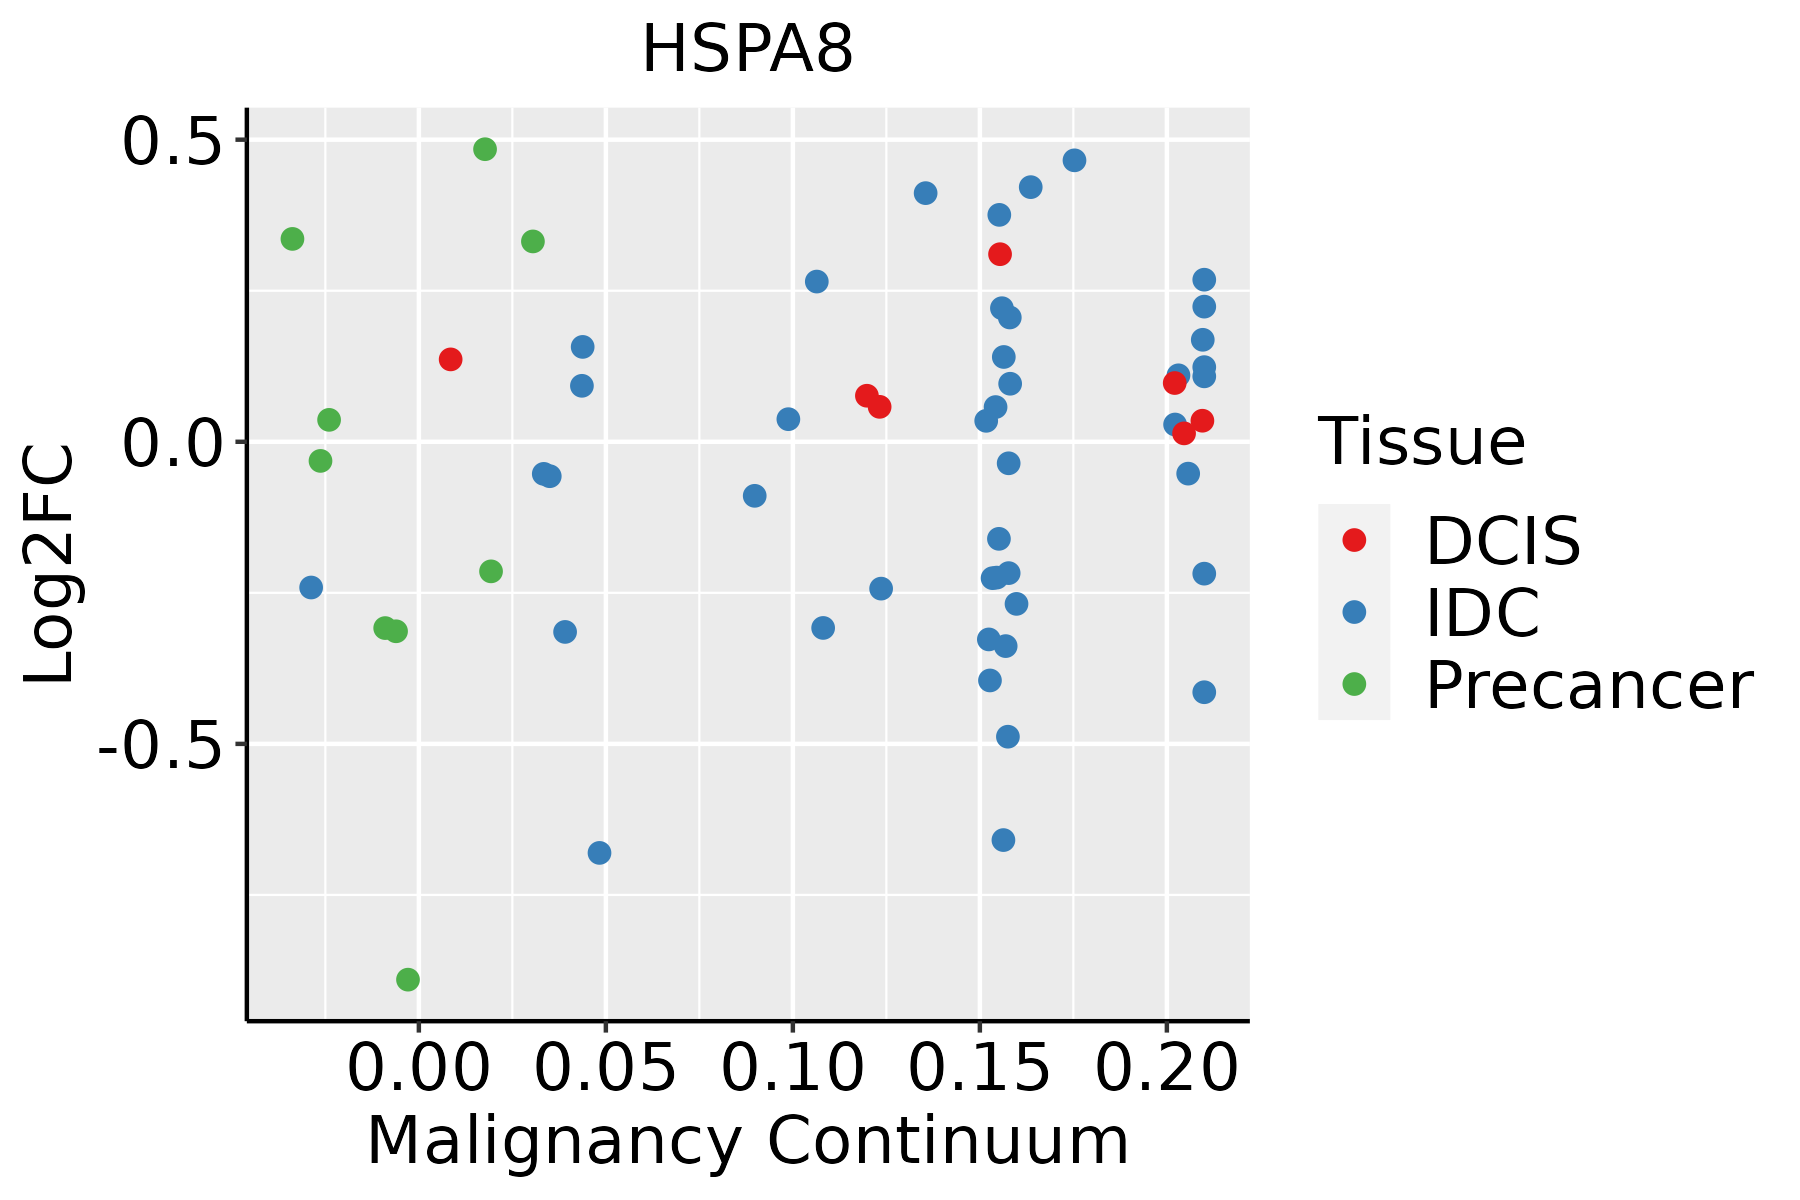 | IDC: Invasive ductal carcinoma |
| DCIS: Ductal carcinoma in situ |
| Precancer(BRCA1-mut): Precancerous lesion from BRCA1 mutation carriers |
| Cervix | 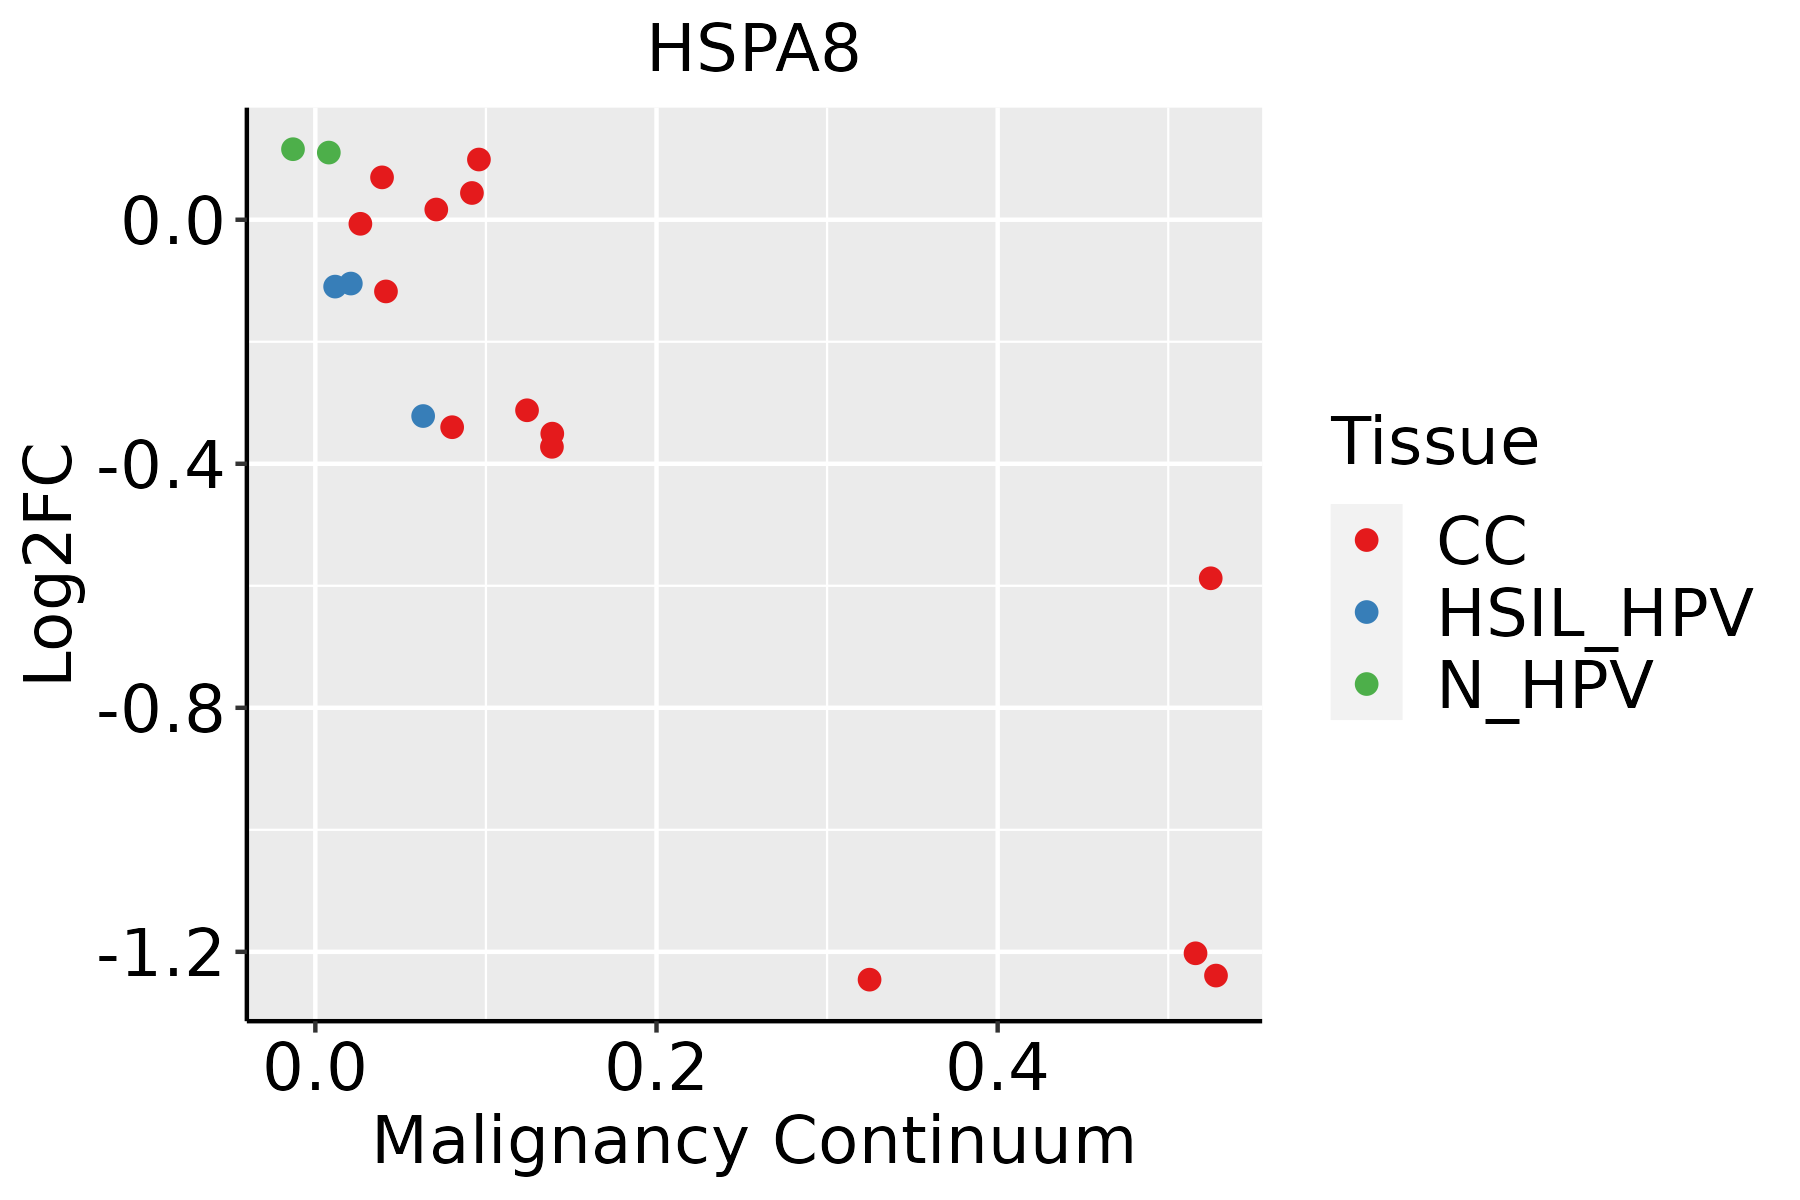 | CC: Cervix cancer |
| HSIL_HPV: HPV-infected high-grade squamous intraepithelial lesions |
| N_HPV: HPV-infected normal cervix |
| Colorectum (GSE201348) |  | FAP: Familial adenomatous polyposis |
| CRC: Colorectal cancer |
| Colorectum (HTA11) |  | AD: Adenomas |
| SER: Sessile serrated lesions |
| MSI-H: Microsatellite-high colorectal cancer |
| MSS: Microsatellite stable colorectal cancer |
| Endometrium | 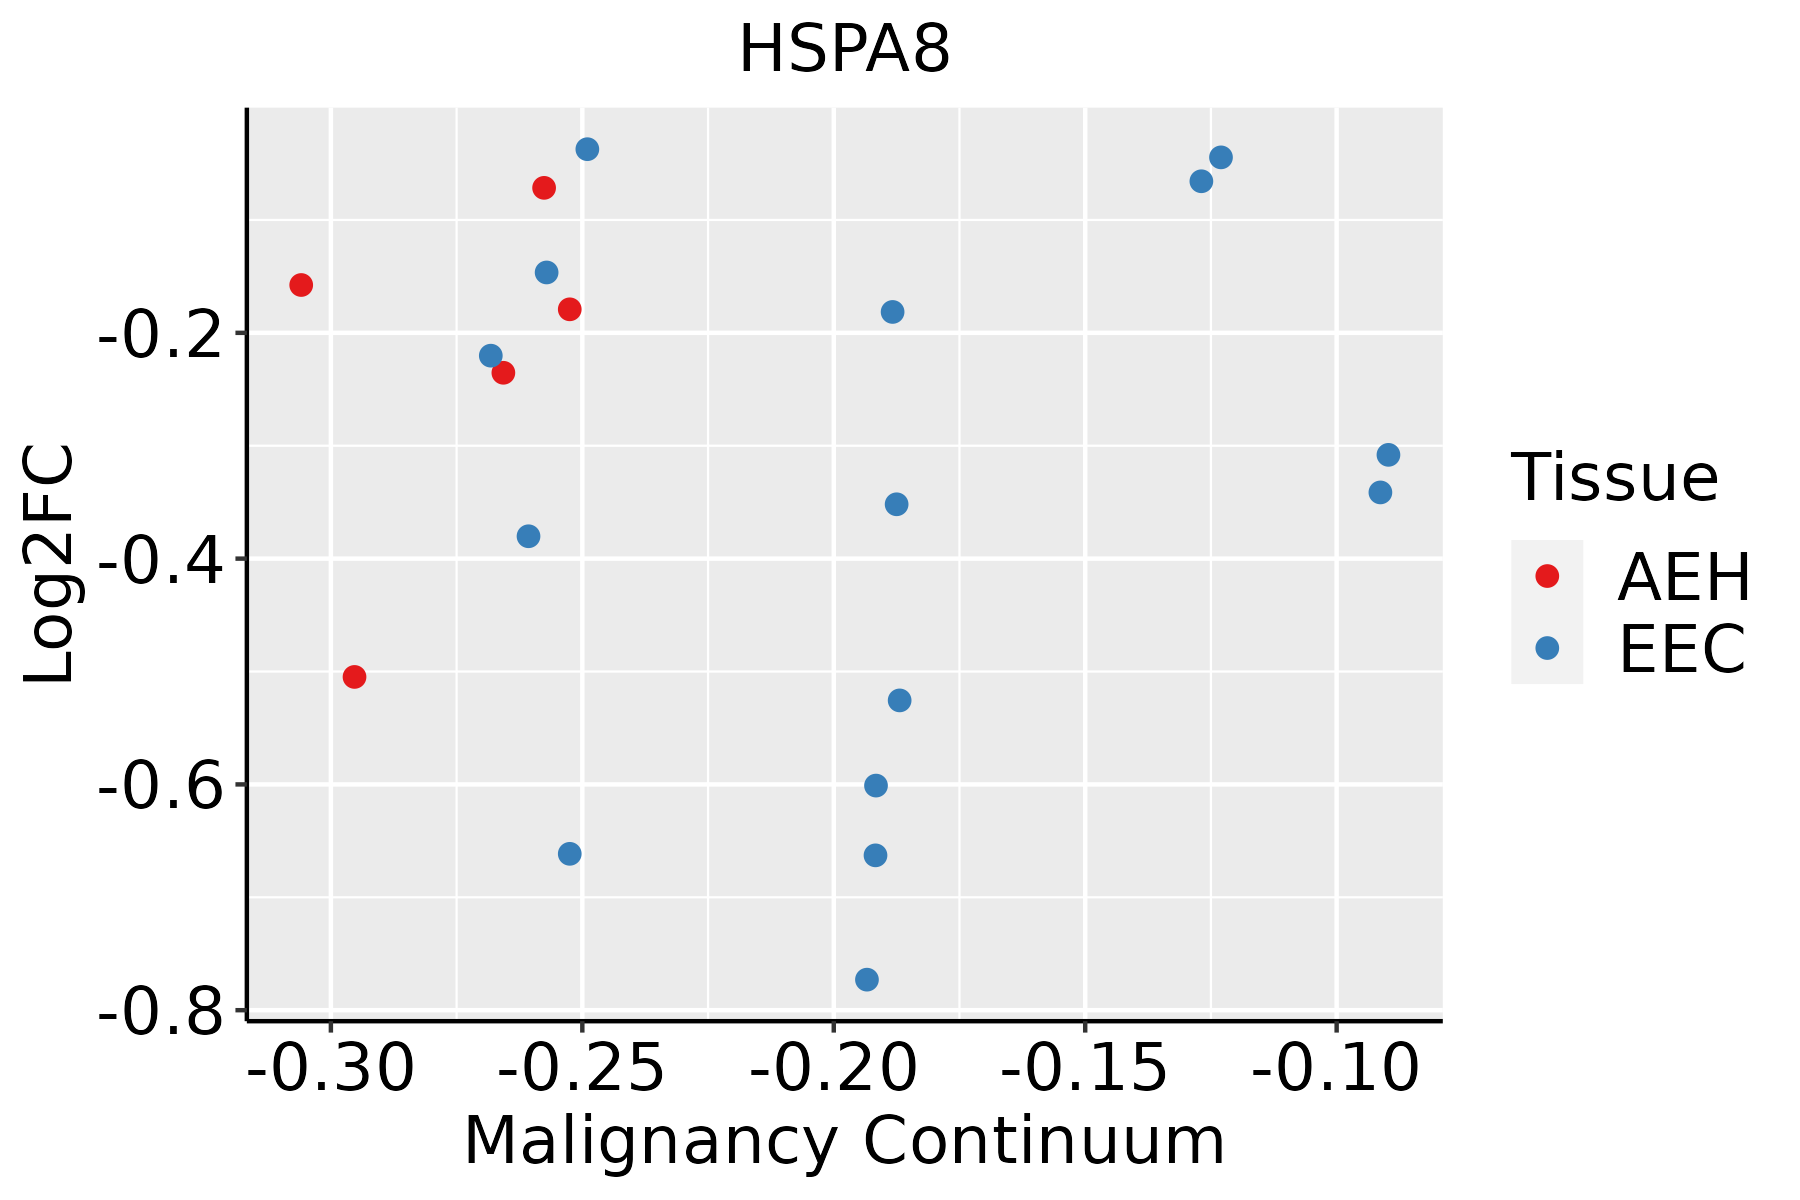 | AEH: Atypical endometrial hyperplasia |
| EEC: Endometrioid Cancer |
| Esophagus |  | ESCC: Esophageal squamous cell carcinoma |
| HGIN: High-grade intraepithelial neoplasias |
| LGIN: Low-grade intraepithelial neoplasias |
| GC | 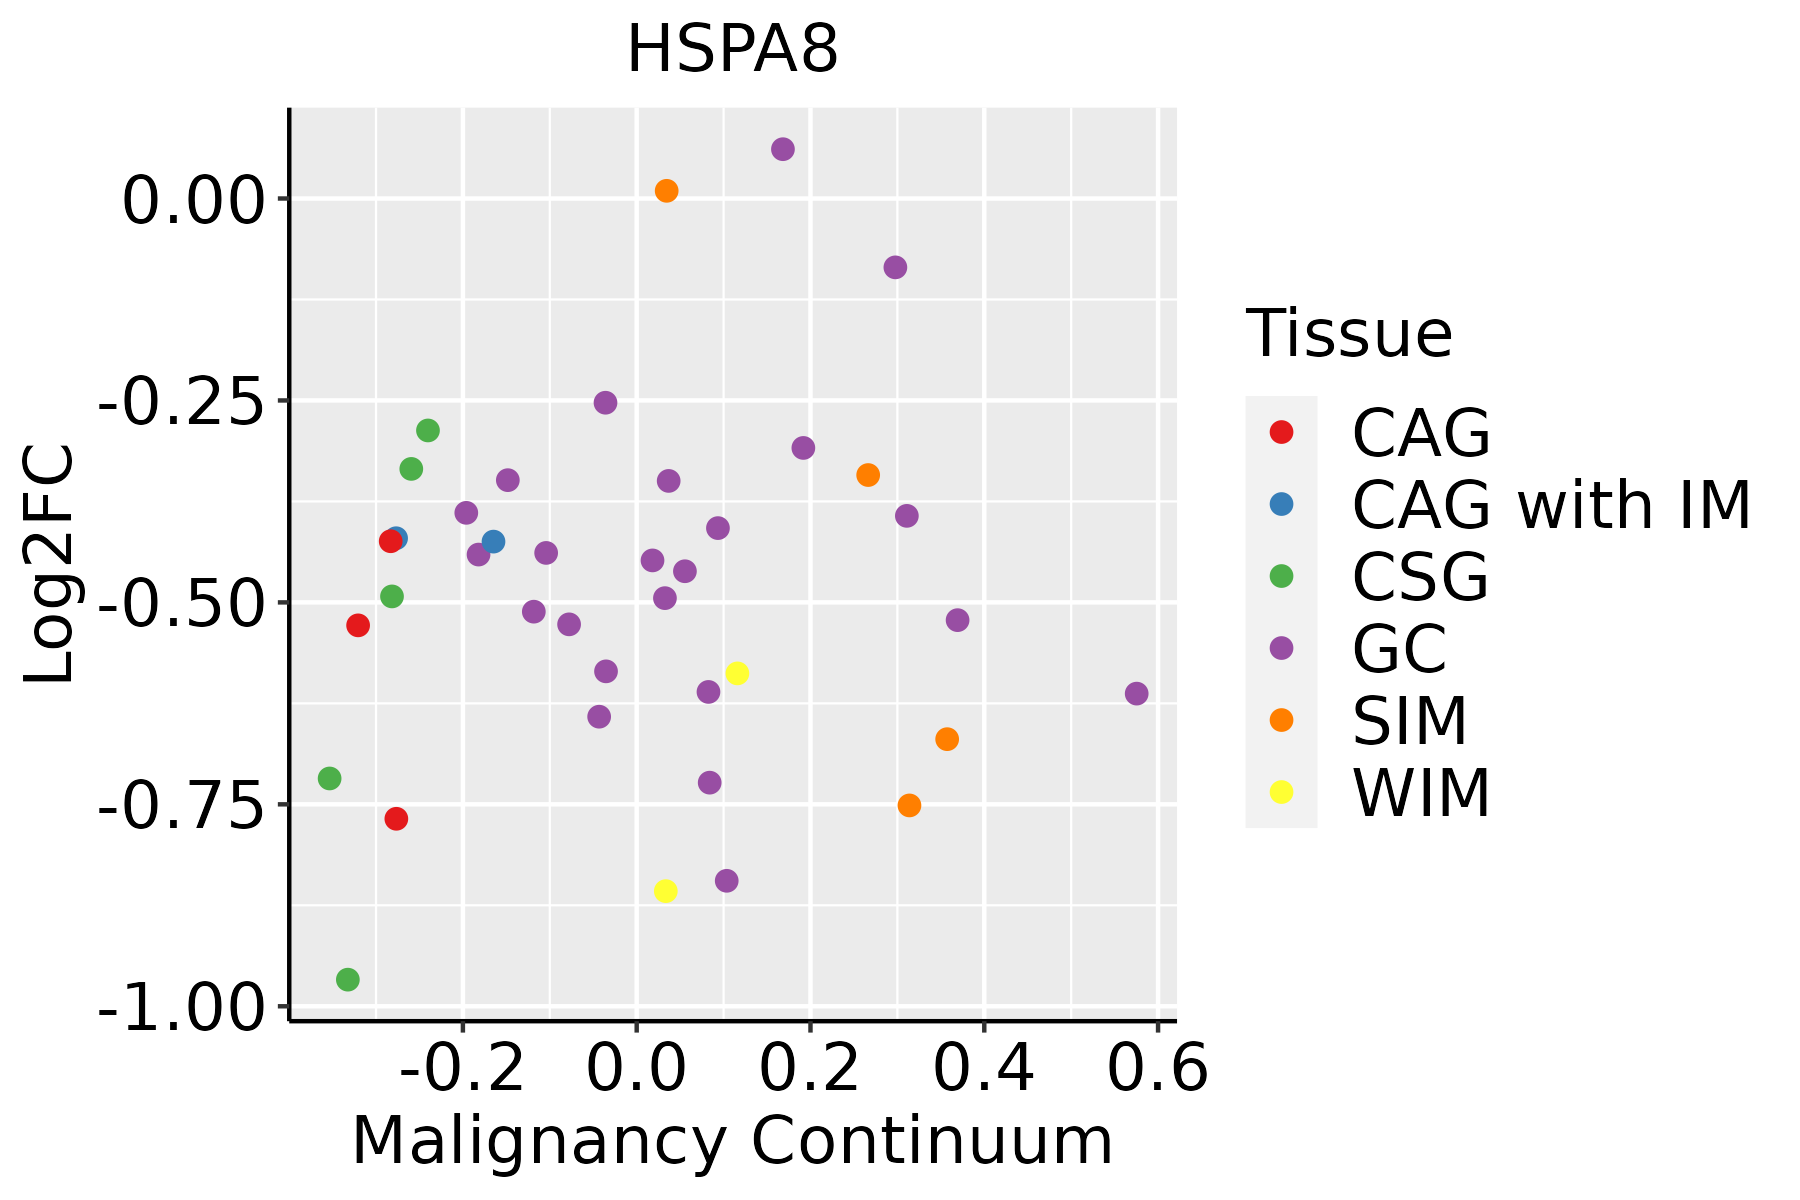 | CAG: Chronic atrophic gastritis |
| CAG with IM: Chronic atrophic gastritis with intestinal metaplasia |
| CSG: Chronic superficial gastritis |
| GC: Gastric cancer |
| SIM: Severe intestinal metaplasia |
| WIM: Wild intestinal metaplasia |
| Liver | 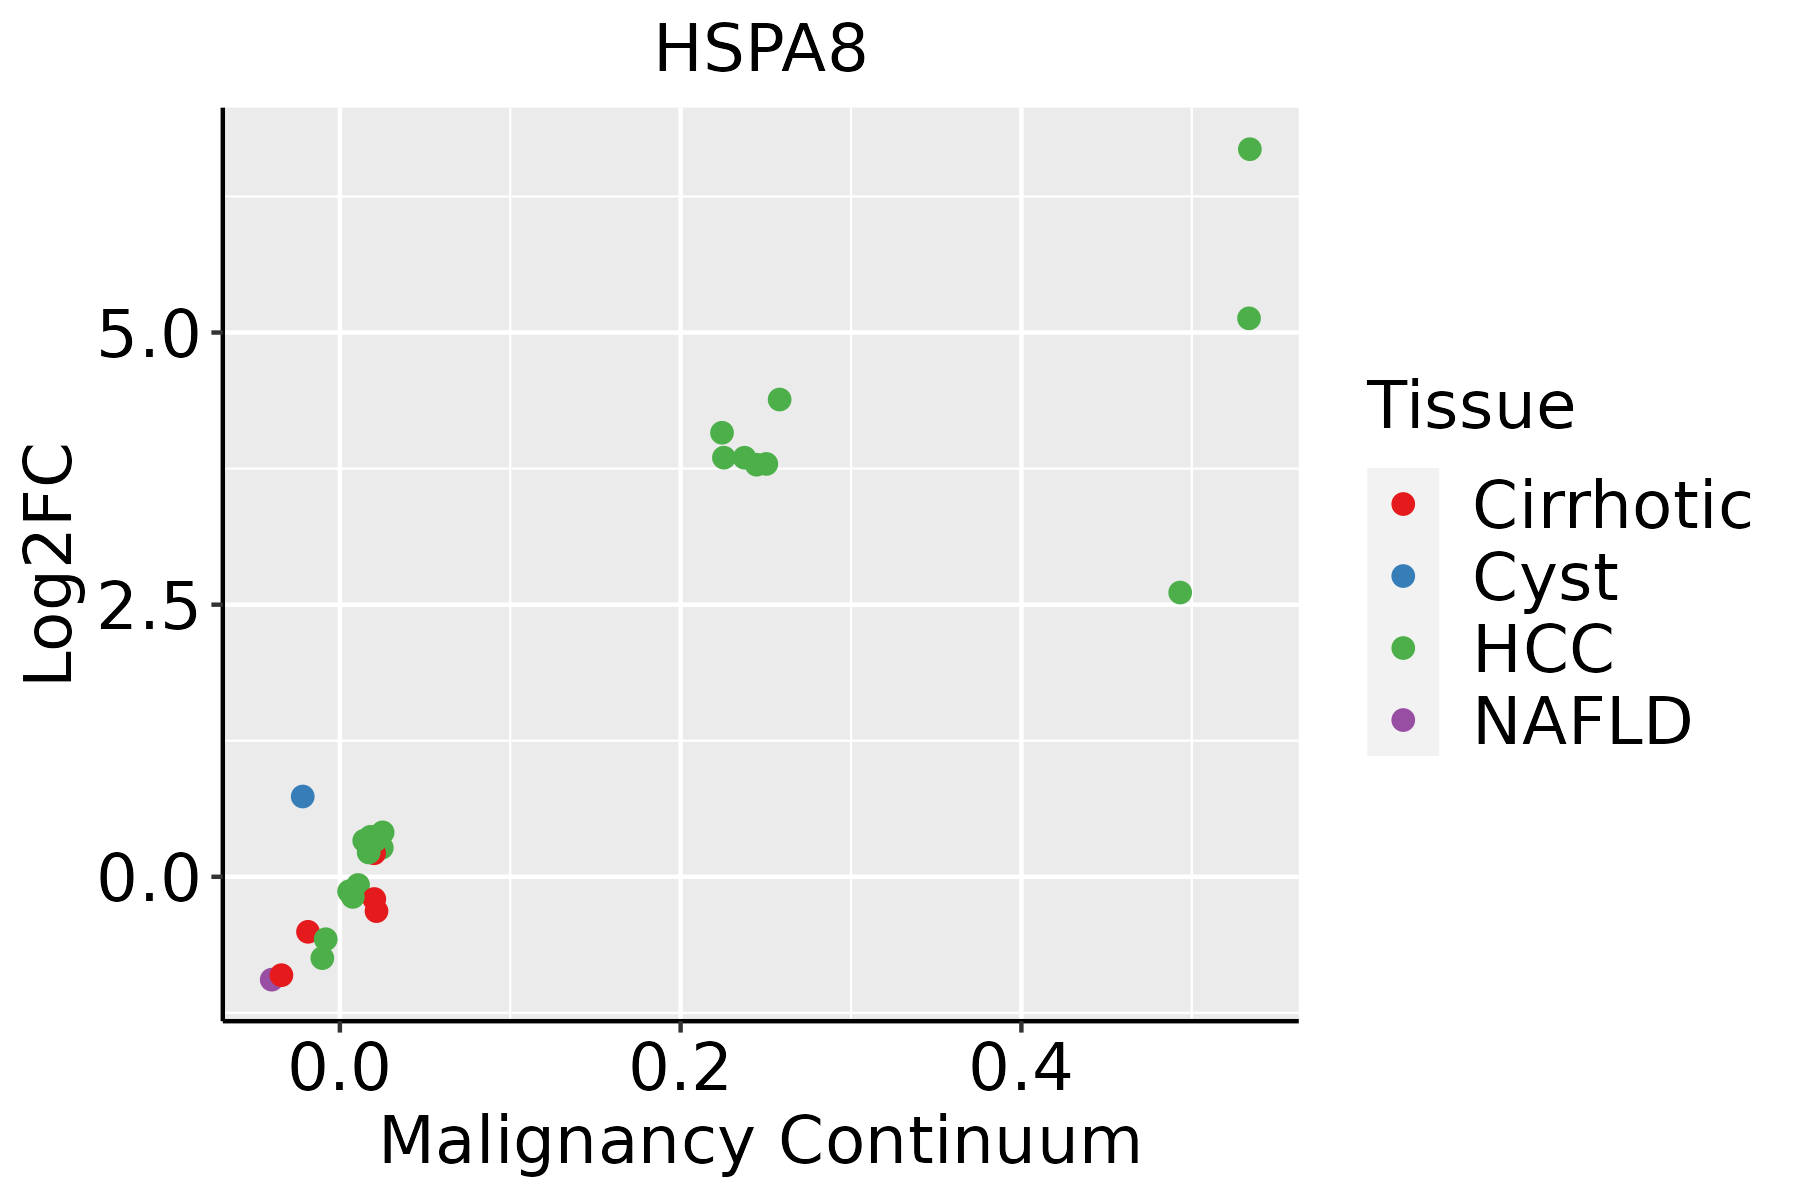 | HCC: Hepatocellular carcinoma |
| NAFLD: Non-alcoholic fatty liver disease |
| Oral Cavity | 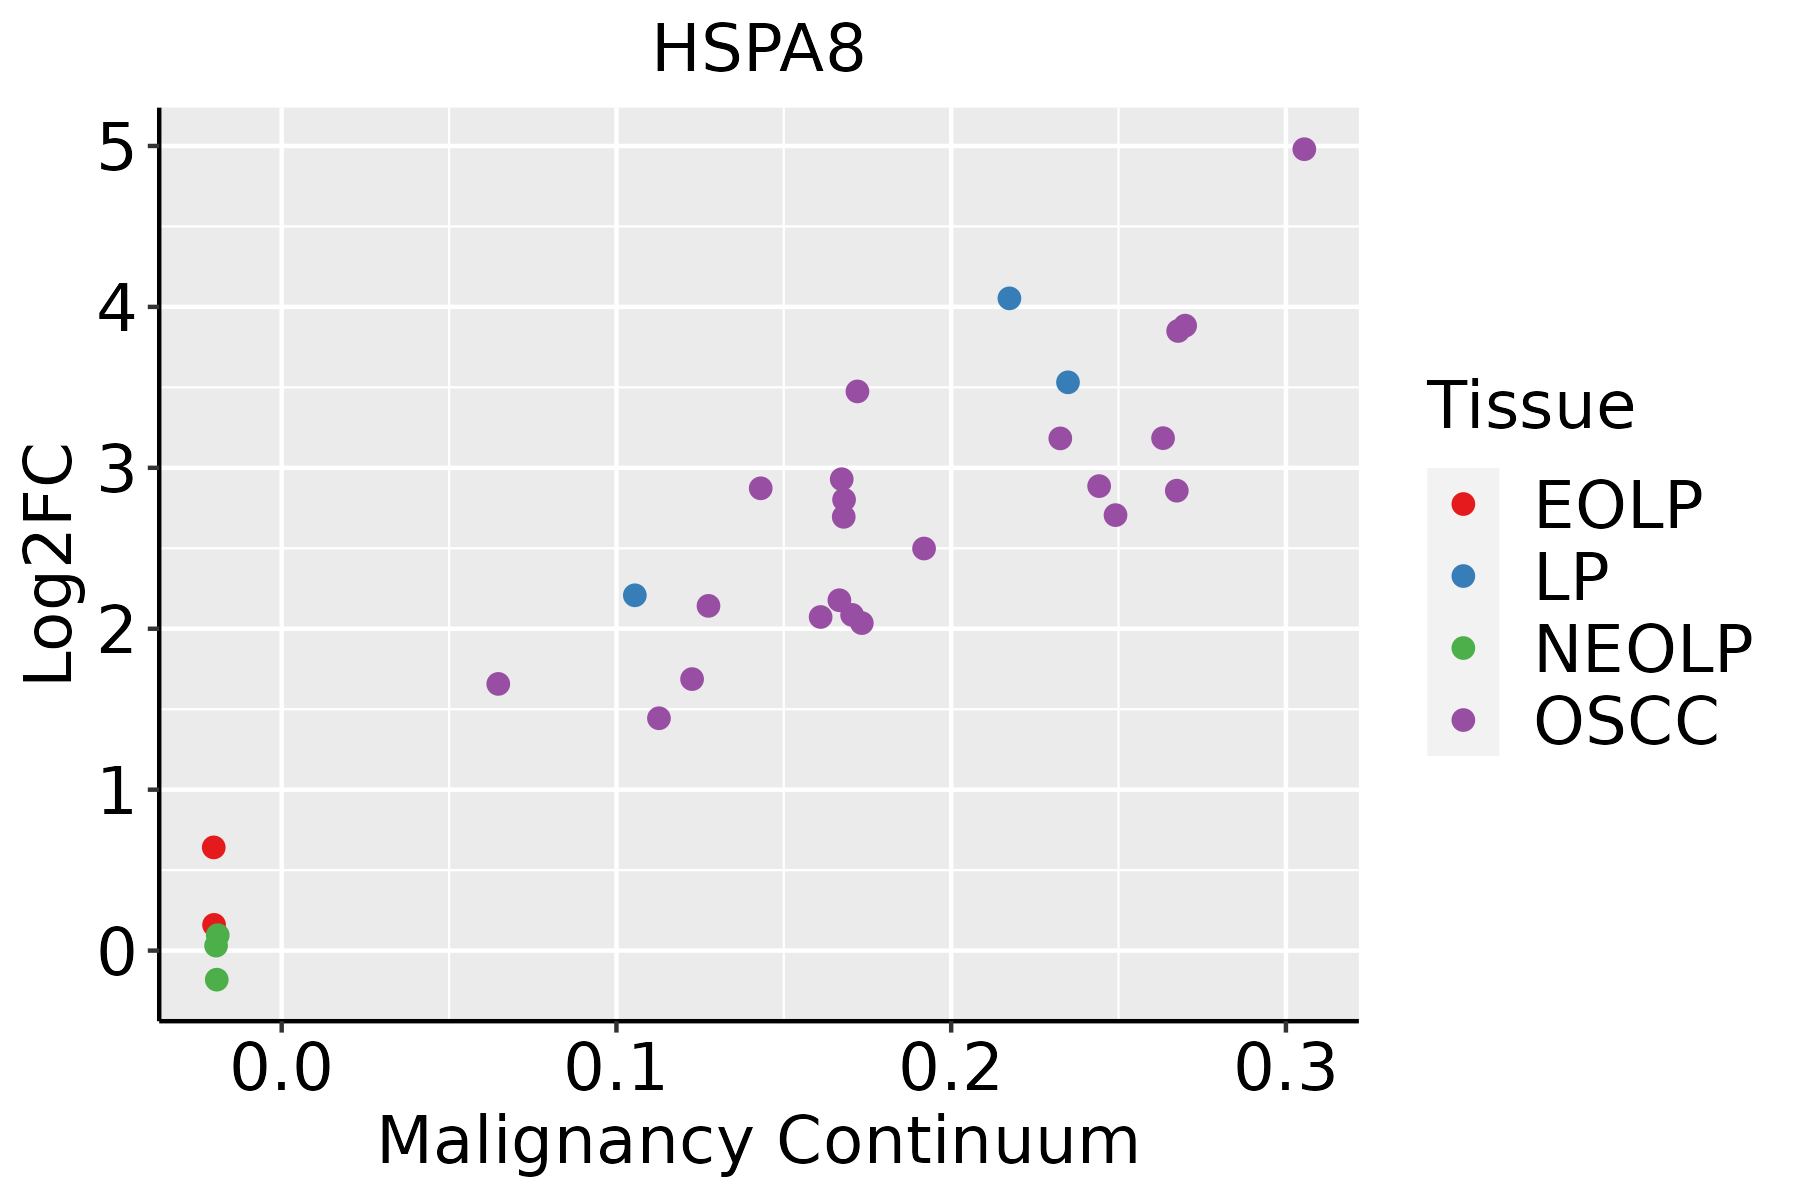 | EOLP: Erosive Oral lichen planus |
| LP: leukoplakia |
| NEOLP: Non-erosive oral lichen planus |
| OSCC: Oral squamous cell carcinoma |
| Prostate | 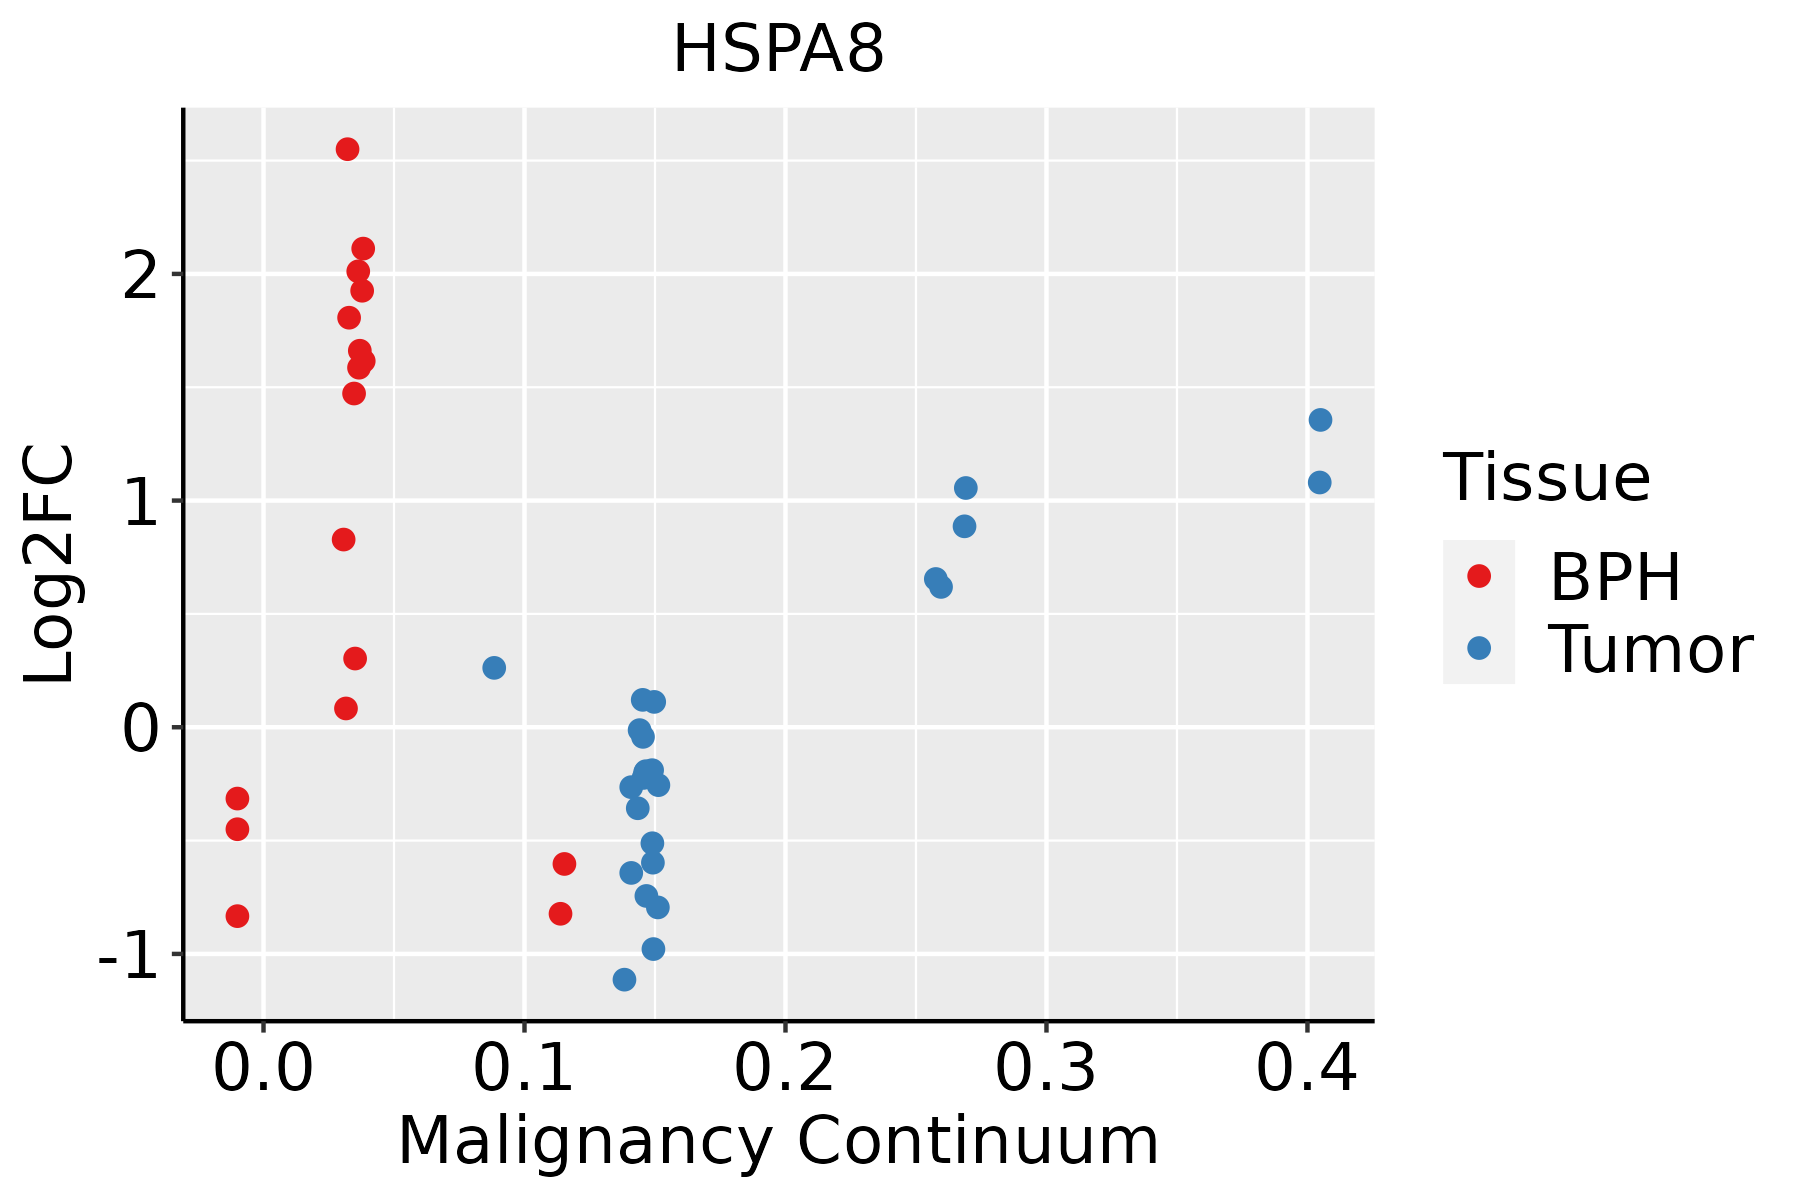 | BPH: Benign Prostatic Hyperplasia |
| Skin |  | AK: Actinic keratosis |
| cSCC: Cutaneous squamous cell carcinoma |
| SCCIS:squamous cell carcinoma in situ |
| Thyroid | 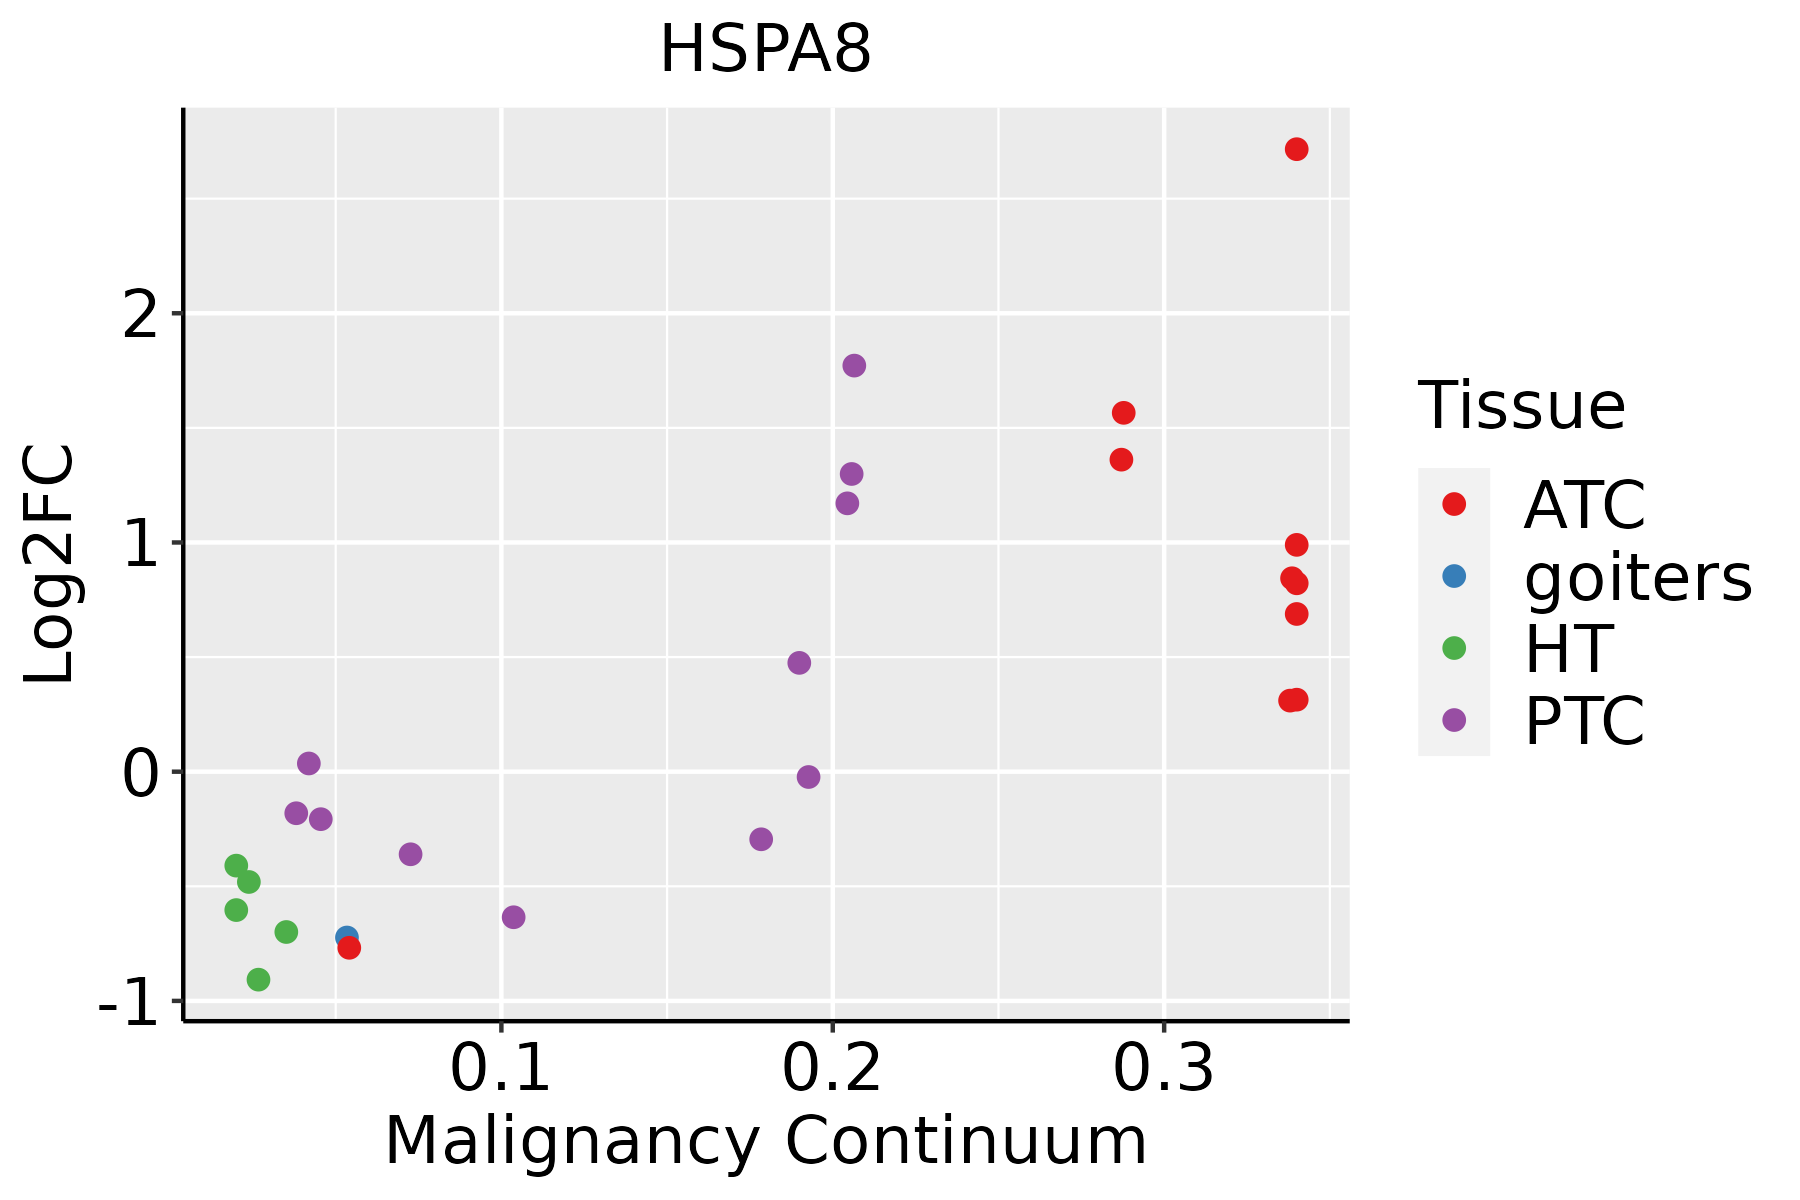 | ATC: Anaplastic thyroid cancer |
| HT: Hashimoto's thyroiditis |
| PTC: Papillary thyroid cancer |
| GO ID | Tissue | Disease Stage | Description | Gene Ratio | Bg Ratio | pvalue | p.adjust | Count |
| GO:004259424 | Thyroid | ATC | response to starvation | 103/6293 | 197/18723 | 4.59e-08 | 8.31e-07 | 103 |
| GO:000926724 | Thyroid | ATC | cellular response to starvation | 85/6293 | 156/18723 | 6.14e-08 | 1.09e-06 | 85 |
| GO:005181721 | Thyroid | ATC | modulation of process of other organism involved in symbiotic interaction | 50/6293 | 81/18723 | 2.01e-07 | 3.17e-06 | 50 |
| GO:0031667210 | Thyroid | ATC | response to nutrient levels | 212/6293 | 474/18723 | 2.37e-07 | 3.70e-06 | 212 |
| GO:001097022 | Thyroid | ATC | transport along microtubule | 83/6293 | 155/18723 | 2.38e-07 | 3.70e-06 | 83 |
| GO:190458918 | Thyroid | ATC | regulation of protein import | 41/6293 | 63/18723 | 3.19e-07 | 4.76e-06 | 41 |
| GO:000704116 | Thyroid | ATC | lysosomal transport | 63/6293 | 114/18723 | 1.58e-06 | 1.93e-05 | 63 |
| GO:003312033 | Thyroid | ATC | positive regulation of RNA splicing | 26/6293 | 37/18723 | 5.64e-06 | 6.00e-05 | 26 |
| GO:005185121 | Thyroid | ATC | modulation by host of symbiont process | 37/6293 | 60/18723 | 7.87e-06 | 8.04e-05 | 37 |
| GO:005068522 | Thyroid | ATC | positive regulation of mRNA processing | 23/6293 | 32/18723 | 1.09e-05 | 1.07e-04 | 23 |
| GO:000645833 | Thyroid | ATC | 'de novo' protein folding | 28/6293 | 43/18723 | 2.35e-05 | 2.06e-04 | 28 |
| GO:190290426 | Thyroid | ATC | negative regulation of supramolecular fiber organization | 82/6293 | 167/18723 | 2.35e-05 | 2.06e-04 | 82 |
| GO:004362412 | Thyroid | ATC | cellular protein complex disassembly | 69/6293 | 136/18723 | 2.66e-05 | 2.28e-04 | 69 |
| GO:009911112 | Thyroid | ATC | microtubule-based transport | 91/6293 | 190/18723 | 2.97e-05 | 2.48e-04 | 91 |
| GO:005126111 | Thyroid | ATC | protein depolymerization | 59/6293 | 114/18723 | 4.74e-05 | 3.80e-04 | 59 |
| GO:000808822 | Thyroid | ATC | axo-dendritic transport | 42/6293 | 75/18723 | 5.50e-05 | 4.24e-04 | 42 |
| GO:003582121 | Thyroid | ATC | modulation of process of other organism | 55/6293 | 106/18723 | 7.71e-05 | 5.82e-04 | 55 |
| GO:007266523 | Thyroid | ATC | protein localization to vacuole | 38/6293 | 67/18723 | 8.48e-05 | 6.33e-04 | 38 |
| GO:005108433 | Thyroid | ATC | 'de novo' posttranslational protein folding | 25/6293 | 39/18723 | 9.45e-05 | 6.91e-04 | 25 |
| GO:005108533 | Thyroid | ATC | chaperone cofactor-dependent protein refolding | 22/6293 | 34/18723 | 2.03e-04 | 1.35e-03 | 22 |
| Pathway ID | Tissue | Disease Stage | Description | Gene Ratio | Bg Ratio | pvalue | p.adjust | qvalue | Count |
| hsa0502016 | Breast | Precancer | Prion disease | 95/684 | 273/8465 | 1.39e-37 | 1.46e-35 | 1.12e-35 | 95 |
| hsa0513414 | Breast | Precancer | Legionellosis | 19/684 | 57/8465 | 4.62e-08 | 9.12e-07 | 6.98e-07 | 19 |
| hsa030408 | Breast | Precancer | Spliceosome | 39/684 | 217/8465 | 1.44e-06 | 2.27e-05 | 1.74e-05 | 39 |
| hsa0414118 | Breast | Precancer | Protein processing in endoplasmic reticulum | 33/684 | 174/8465 | 2.78e-06 | 3.83e-05 | 2.94e-05 | 33 |
| hsa0491518 | Breast | Precancer | Estrogen signaling pathway | 28/684 | 138/8465 | 4.10e-06 | 5.39e-05 | 4.13e-05 | 28 |
| hsa0541718 | Breast | Precancer | Lipid and atherosclerosis | 37/684 | 215/8465 | 7.64e-06 | 9.29e-05 | 7.12e-05 | 37 |
| hsa0461218 | Breast | Precancer | Antigen processing and presentation | 19/684 | 78/8465 | 9.61e-06 | 1.12e-04 | 8.62e-05 | 19 |
| hsa0502017 | Breast | Precancer | Prion disease | 95/684 | 273/8465 | 1.39e-37 | 1.46e-35 | 1.12e-35 | 95 |
| hsa0513415 | Breast | Precancer | Legionellosis | 19/684 | 57/8465 | 4.62e-08 | 9.12e-07 | 6.98e-07 | 19 |
| hsa0304013 | Breast | Precancer | Spliceosome | 39/684 | 217/8465 | 1.44e-06 | 2.27e-05 | 1.74e-05 | 39 |
| hsa0414119 | Breast | Precancer | Protein processing in endoplasmic reticulum | 33/684 | 174/8465 | 2.78e-06 | 3.83e-05 | 2.94e-05 | 33 |
| hsa0491519 | Breast | Precancer | Estrogen signaling pathway | 28/684 | 138/8465 | 4.10e-06 | 5.39e-05 | 4.13e-05 | 28 |
| hsa0541719 | Breast | Precancer | Lipid and atherosclerosis | 37/684 | 215/8465 | 7.64e-06 | 9.29e-05 | 7.12e-05 | 37 |
| hsa0461219 | Breast | Precancer | Antigen processing and presentation | 19/684 | 78/8465 | 9.61e-06 | 1.12e-04 | 8.62e-05 | 19 |
| hsa0502023 | Breast | IDC | Prion disease | 102/867 | 273/8465 | 3.70e-34 | 4.01e-32 | 3.00e-32 | 102 |
| hsa0491523 | Breast | IDC | Estrogen signaling pathway | 35/867 | 138/8465 | 2.55e-07 | 5.18e-06 | 3.88e-06 | 35 |
| hsa0461223 | Breast | IDC | Antigen processing and presentation | 24/867 | 78/8465 | 4.61e-07 | 8.33e-06 | 6.23e-06 | 24 |
| hsa0513422 | Breast | IDC | Legionellosis | 19/867 | 57/8465 | 1.89e-06 | 3.07e-05 | 2.29e-05 | 19 |
| hsa0414124 | Breast | IDC | Protein processing in endoplasmic reticulum | 36/867 | 174/8465 | 2.73e-05 | 2.86e-04 | 2.14e-04 | 36 |
| hsa0304023 | Breast | IDC | Spliceosome | 40/867 | 217/8465 | 1.53e-04 | 1.42e-03 | 1.06e-03 | 40 |
| Hugo Symbol | Variant Class | Variant Classification | dbSNP RS | HGVSc | HGVSp | HGVSp Short | SWISSPROT | BIOTYPE | SIFT | PolyPhen | Tumor Sample Barcode | Tissue | Histology | Sex | Age | Stage | Therapy Types | Drugs | Outcome |
| HSPA8 | SNV | Missense_Mutation | | c.696T>G | p.Asp232Glu | p.D232E | P11142 | protein_coding | deleterious_low_confidence(0.02) | benign(0.036) | TCGA-A2-A0EV-01 | Breast | breast invasive carcinoma | Female | >=65 | I/II | Unknown | Unknown | SD |
| HSPA8 | SNV | Missense_Mutation | | c.71G>A | p.Gly24Glu | p.G24E | P11142 | protein_coding | deleterious_low_confidence(0.02) | probably_damaging(0.957) | TCGA-AC-A23H-01 | Breast | breast invasive carcinoma | Female | >=65 | I/II | Unknown | Unknown | PD |
| HSPA8 | SNV | Missense_Mutation | | c.1419N>C | p.Gln473His | p.Q473H | P11142 | protein_coding | deleterious_low_confidence(0) | probably_damaging(0.957) | TCGA-AO-A0J6-01 | Breast | breast invasive carcinoma | Female | <65 | I/II | Chemotherapy | doxorubicin | SD |
| HSPA8 | SNV | Missense_Mutation | novel | c.1392N>G | p.Ile464Met | p.I464M | P11142 | protein_coding | deleterious_low_confidence(0.01) | probably_damaging(0.978) | TCGA-BH-A18G-01 | Breast | breast invasive carcinoma | Female | >=65 | I/II | Unknown | Unknown | SD |
| HSPA8 | SNV | Missense_Mutation | novel | c.172N>G | p.Gln58Glu | p.Q58E | P11142 | protein_coding | deleterious_low_confidence(0) | probably_damaging(0.958) | TCGA-PE-A5DE-01 | Breast | breast invasive carcinoma | Female | <65 | I/II | Chemotherapy | taxotere | CR |
| HSPA8 | insertion | Frame_Shift_Ins | novel | c.1635_1636insT | p.Ala546CysfsTer9 | p.A546Cfs*9 | P11142 | protein_coding | | | TCGA-B6-A0I6-01 | Breast | breast invasive carcinoma | Female | <65 | I/II | Unknown | Unknown | PD |
| HSPA8 | insertion | Nonsense_Mutation | novel | c.1633_1634insCCCTCTGGTGGTGCTTCCTCAGGGCCCACCATTGAAGAGGTTG | p.Tyr545SerfsTer12 | p.Y545Sfs*12 | P11142 | protein_coding | | | TCGA-B6-A0I6-01 | Breast | breast invasive carcinoma | Female | <65 | I/II | Unknown | Unknown | PD |
| HSPA8 | SNV | Missense_Mutation | novel | c.112N>G | p.Thr38Ala | p.T38A | P11142 | protein_coding | deleterious_low_confidence(0.01) | benign(0.135) | TCGA-2W-A8YY-01 | Cervix | cervical & endocervical cancer | Female | <65 | I/II | Chemotherapy | cisplatin | CR |
| HSPA8 | SNV | Missense_Mutation | | c.261N>A | p.Met87Ile | p.M87I | P11142 | protein_coding | tolerated_low_confidence(0.16) | benign(0.012) | TCGA-EK-A2PG-01 | Cervix | cervical & endocervical cancer | Female | >=65 | I/II | Unknown | Unknown | SD |
| HSPA8 | SNV | Missense_Mutation | | c.1936N>C | p.Asp646His | p.D646H | P11142 | protein_coding | deleterious_low_confidence(0) | probably_damaging(0.969) | TCGA-EK-A2R8-01 | Cervix | cervical & endocervical cancer | Female | <65 | I/II | Unknown | Unknown | SD |


