
|
|||||
|
 | |
| |
| |
| |
| |
| |
|
Gene: FOXO3 |
Gene summary for FOXO3 |
| Gene information | Species | Human | Gene symbol | FOXO3 | Gene ID | 2309 |
| Gene name | forkhead box O3 | |
| Gene Alias | AF6q21 | |
| Cytomap | 6q21 | |
| Gene Type | protein-coding | GO ID | GO:0000003 | UniProtAcc | O43524 |
Top |
Malignant transformation analysis |
| Identification of the aberrant gene expression in precancerous and cancerous lesions by comparing the gene expression of stem-like cells in diseased tissues with normal stem cells |
| Entrez ID | Symbol | Replicates | Species | Organ | Tissue | Adj P-value | Log2FC | Malignancy |
| 2309 | FOXO3 | HTA11_411_2000001011 | Human | Colorectum | SER | 1.80e-05 | 9.34e-01 | -0.2602 |
| 2309 | FOXO3 | HTA11_2112_2000001011 | Human | Colorectum | SER | 5.40e-03 | 6.94e-01 | -0.2196 |
| 2309 | FOXO3 | HTA11_866_3004761011 | Human | Colorectum | AD | 7.41e-04 | 4.19e-01 | 0.096 |
| 2309 | FOXO3 | HTA11_6818_2000001021 | Human | Colorectum | AD | 3.33e-03 | 5.23e-01 | 0.0588 |
| 2309 | FOXO3 | HTA11_99999965062_69753 | Human | Colorectum | MSI-H | 1.08e-07 | 1.02e+00 | 0.3487 |
| 2309 | FOXO3 | HTA11_99999965104_69814 | Human | Colorectum | MSS | 1.36e-15 | 1.39e+00 | 0.281 |
| 2309 | FOXO3 | HTA11_99999971662_82457 | Human | Colorectum | MSS | 1.45e-04 | 6.84e-01 | 0.3859 |
| 2309 | FOXO3 | HTA11_99999973899_84307 | Human | Colorectum | MSS | 9.73e-03 | 6.51e-01 | 0.2585 |
| 2309 | FOXO3 | A015-C-203 | Human | Colorectum | FAP | 2.14e-18 | -3.99e-01 | -0.1294 |
| 2309 | FOXO3 | A015-C-204 | Human | Colorectum | FAP | 1.07e-02 | -2.31e-01 | -0.0228 |
| 2309 | FOXO3 | A002-C-201 | Human | Colorectum | FAP | 2.95e-10 | -3.14e-01 | 0.0324 |
| 2309 | FOXO3 | A001-C-119 | Human | Colorectum | FAP | 2.31e-03 | -4.22e-01 | -0.1557 |
| 2309 | FOXO3 | A001-C-108 | Human | Colorectum | FAP | 3.74e-12 | -3.41e-01 | -0.0272 |
| 2309 | FOXO3 | A002-C-205 | Human | Colorectum | FAP | 1.11e-21 | -5.67e-01 | -0.1236 |
| 2309 | FOXO3 | A015-C-006 | Human | Colorectum | FAP | 4.24e-13 | -5.63e-01 | -0.0994 |
| 2309 | FOXO3 | A015-C-106 | Human | Colorectum | FAP | 5.24e-07 | -2.61e-01 | -0.0511 |
| 2309 | FOXO3 | A002-C-114 | Human | Colorectum | FAP | 6.17e-15 | -4.01e-01 | -0.1561 |
| 2309 | FOXO3 | A015-C-104 | Human | Colorectum | FAP | 4.55e-24 | -4.70e-01 | -0.1899 |
| 2309 | FOXO3 | A001-C-014 | Human | Colorectum | FAP | 1.79e-10 | -2.60e-01 | 0.0135 |
| 2309 | FOXO3 | A002-C-016 | Human | Colorectum | FAP | 2.17e-13 | -2.34e-01 | 0.0521 |
| Page: 1 2 3 4 5 6 7 8 9 10 11 |
| Tissue | Expression Dynamics | Abbreviation |
| Colorectum (GSE201348) |  | FAP: Familial adenomatous polyposis |
| CRC: Colorectal cancer | ||
| Colorectum (HTA11) |  | AD: Adenomas |
| SER: Sessile serrated lesions | ||
| MSI-H: Microsatellite-high colorectal cancer | ||
| MSS: Microsatellite stable colorectal cancer | ||
| Endometrium | 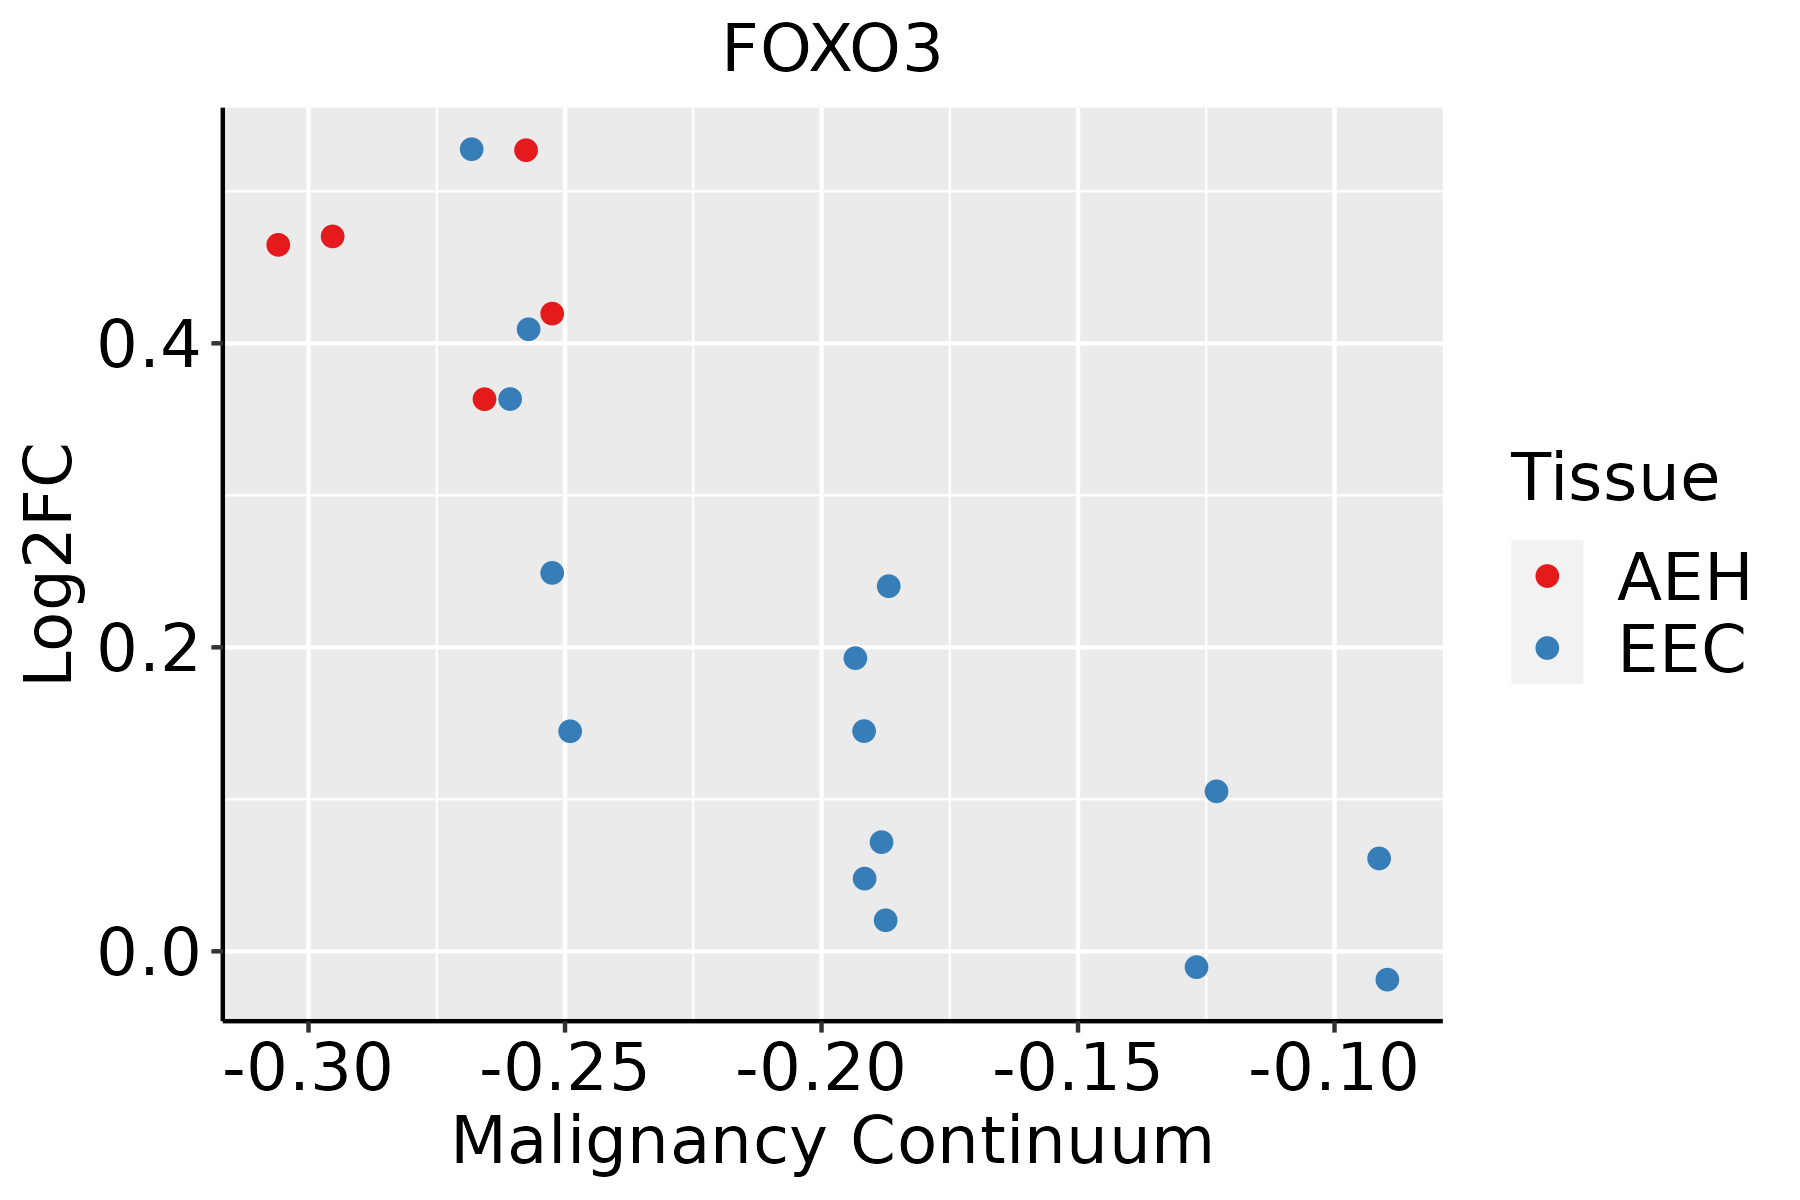 | AEH: Atypical endometrial hyperplasia |
| EEC: Endometrioid Cancer | ||
| Esophagus |  | ESCC: Esophageal squamous cell carcinoma |
| HGIN: High-grade intraepithelial neoplasias | ||
| LGIN: Low-grade intraepithelial neoplasias | ||
| GC | 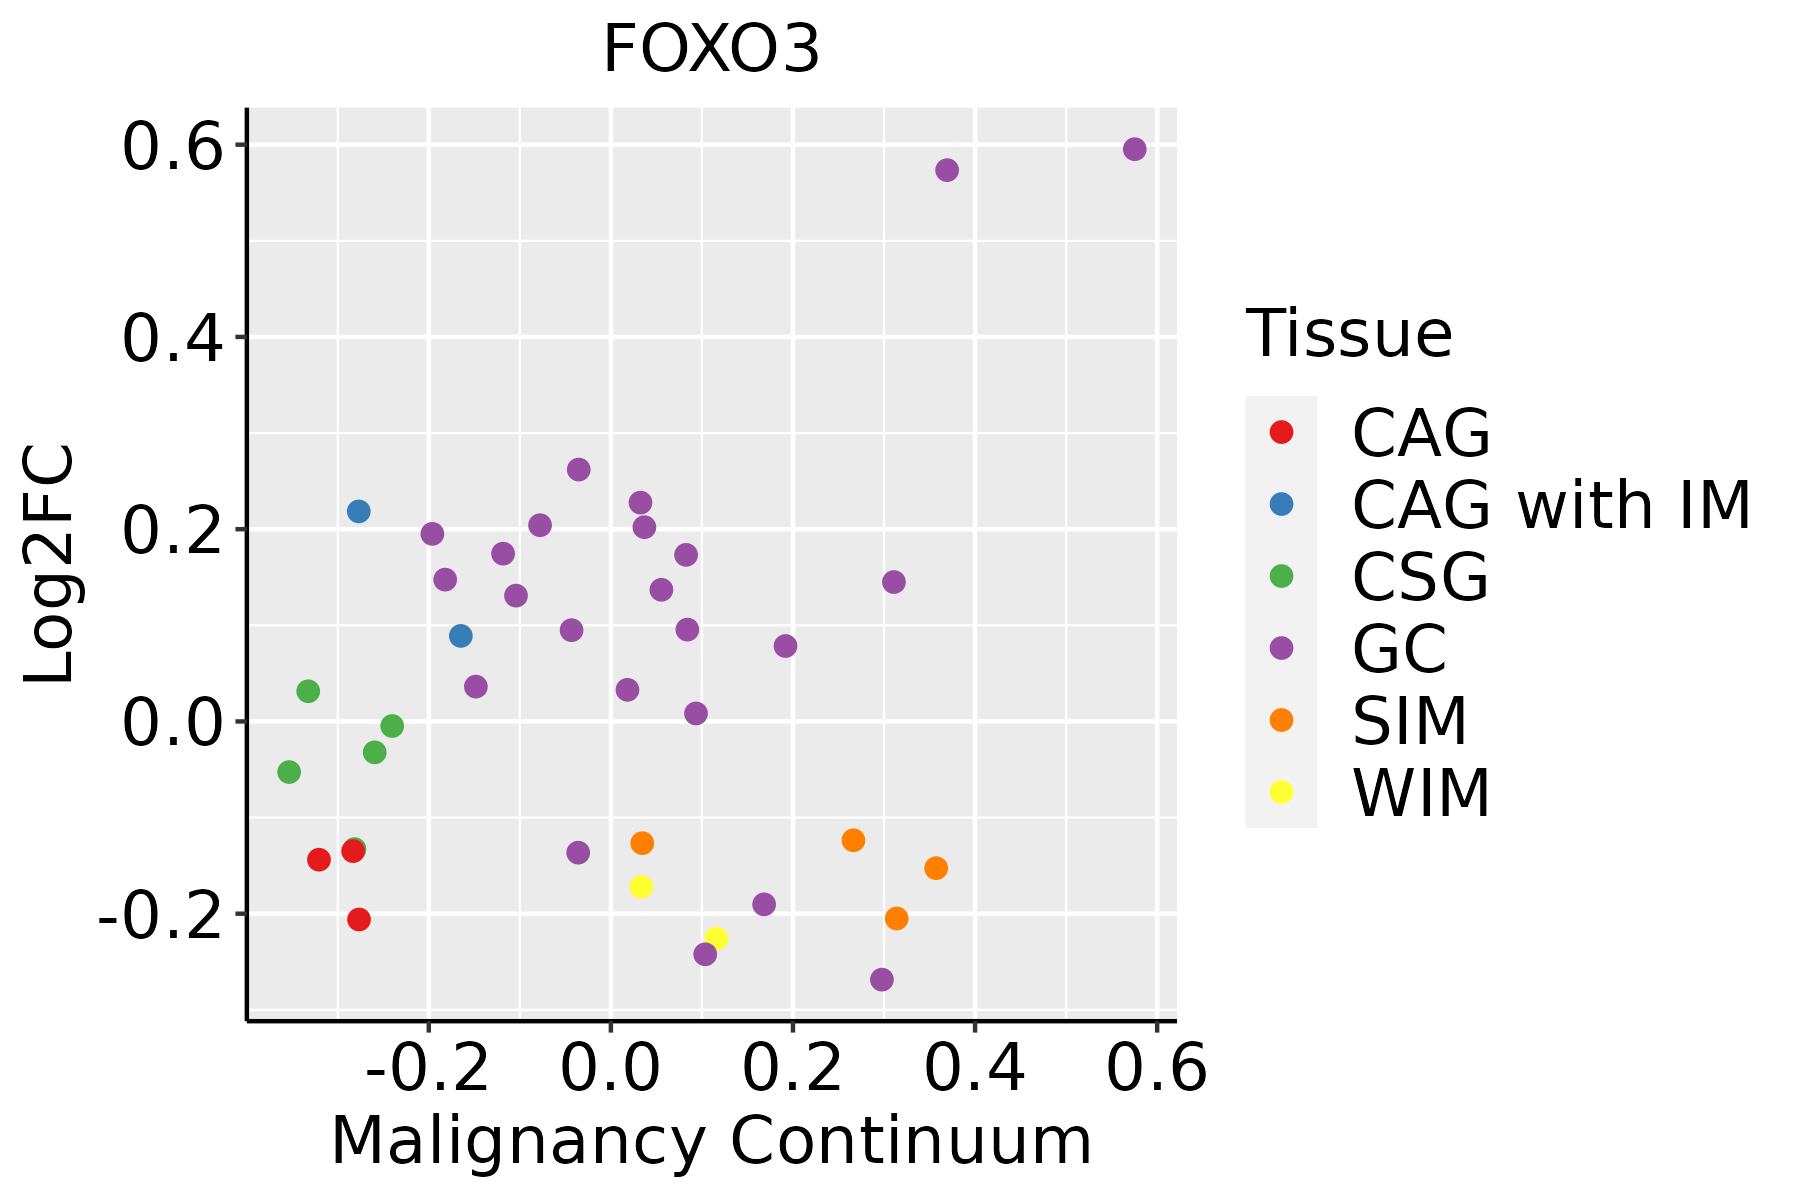 | CAG: Chronic atrophic gastritis |
| CAG with IM: Chronic atrophic gastritis with intestinal metaplasia | ||
| CSG: Chronic superficial gastritis | ||
| GC: Gastric cancer | ||
| SIM: Severe intestinal metaplasia | ||
| WIM: Wild intestinal metaplasia | ||
| Liver | 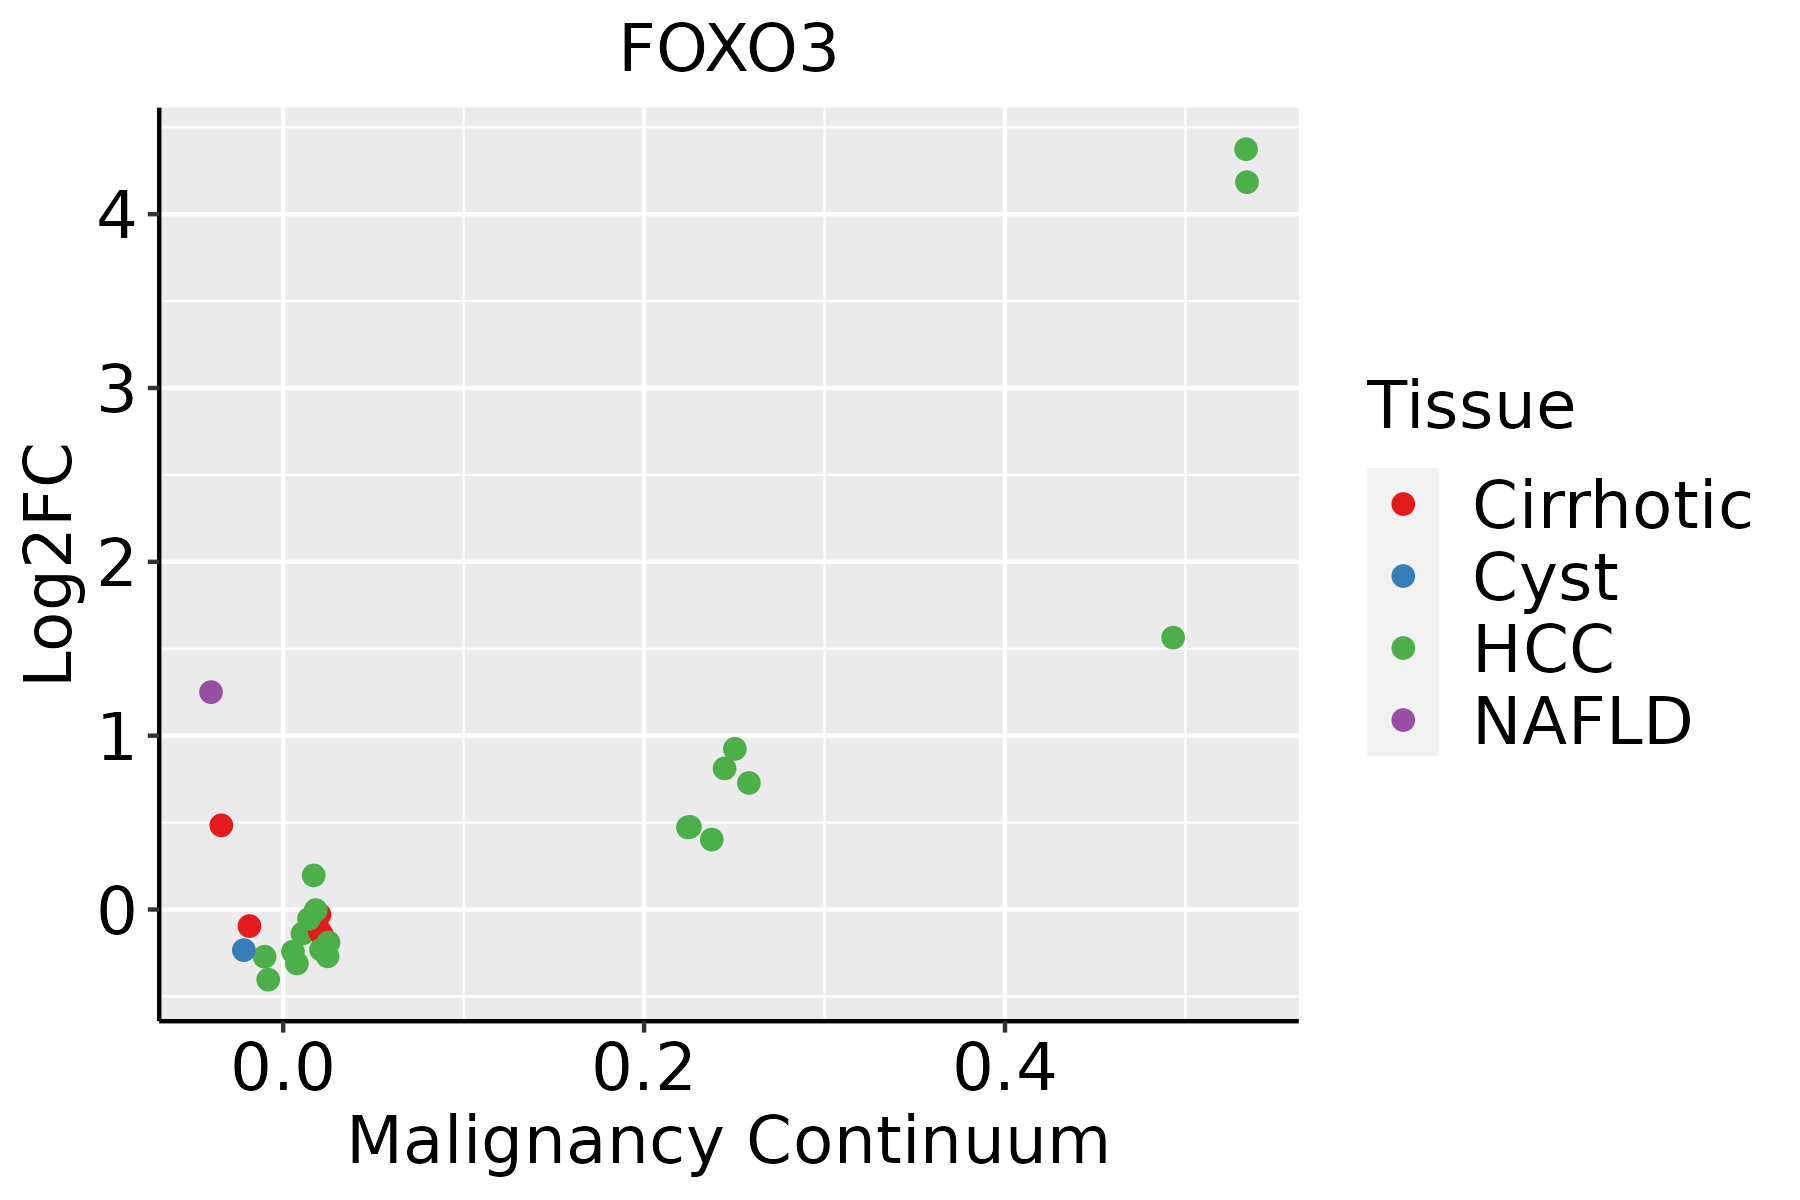 | HCC: Hepatocellular carcinoma |
| NAFLD: Non-alcoholic fatty liver disease | ||
| Lung |  | AAH: Atypical adenomatous hyperplasia |
| AIS: Adenocarcinoma in situ | ||
| IAC: Invasive lung adenocarcinoma | ||
| MIA: Minimally invasive adenocarcinoma | ||
| Oral Cavity | 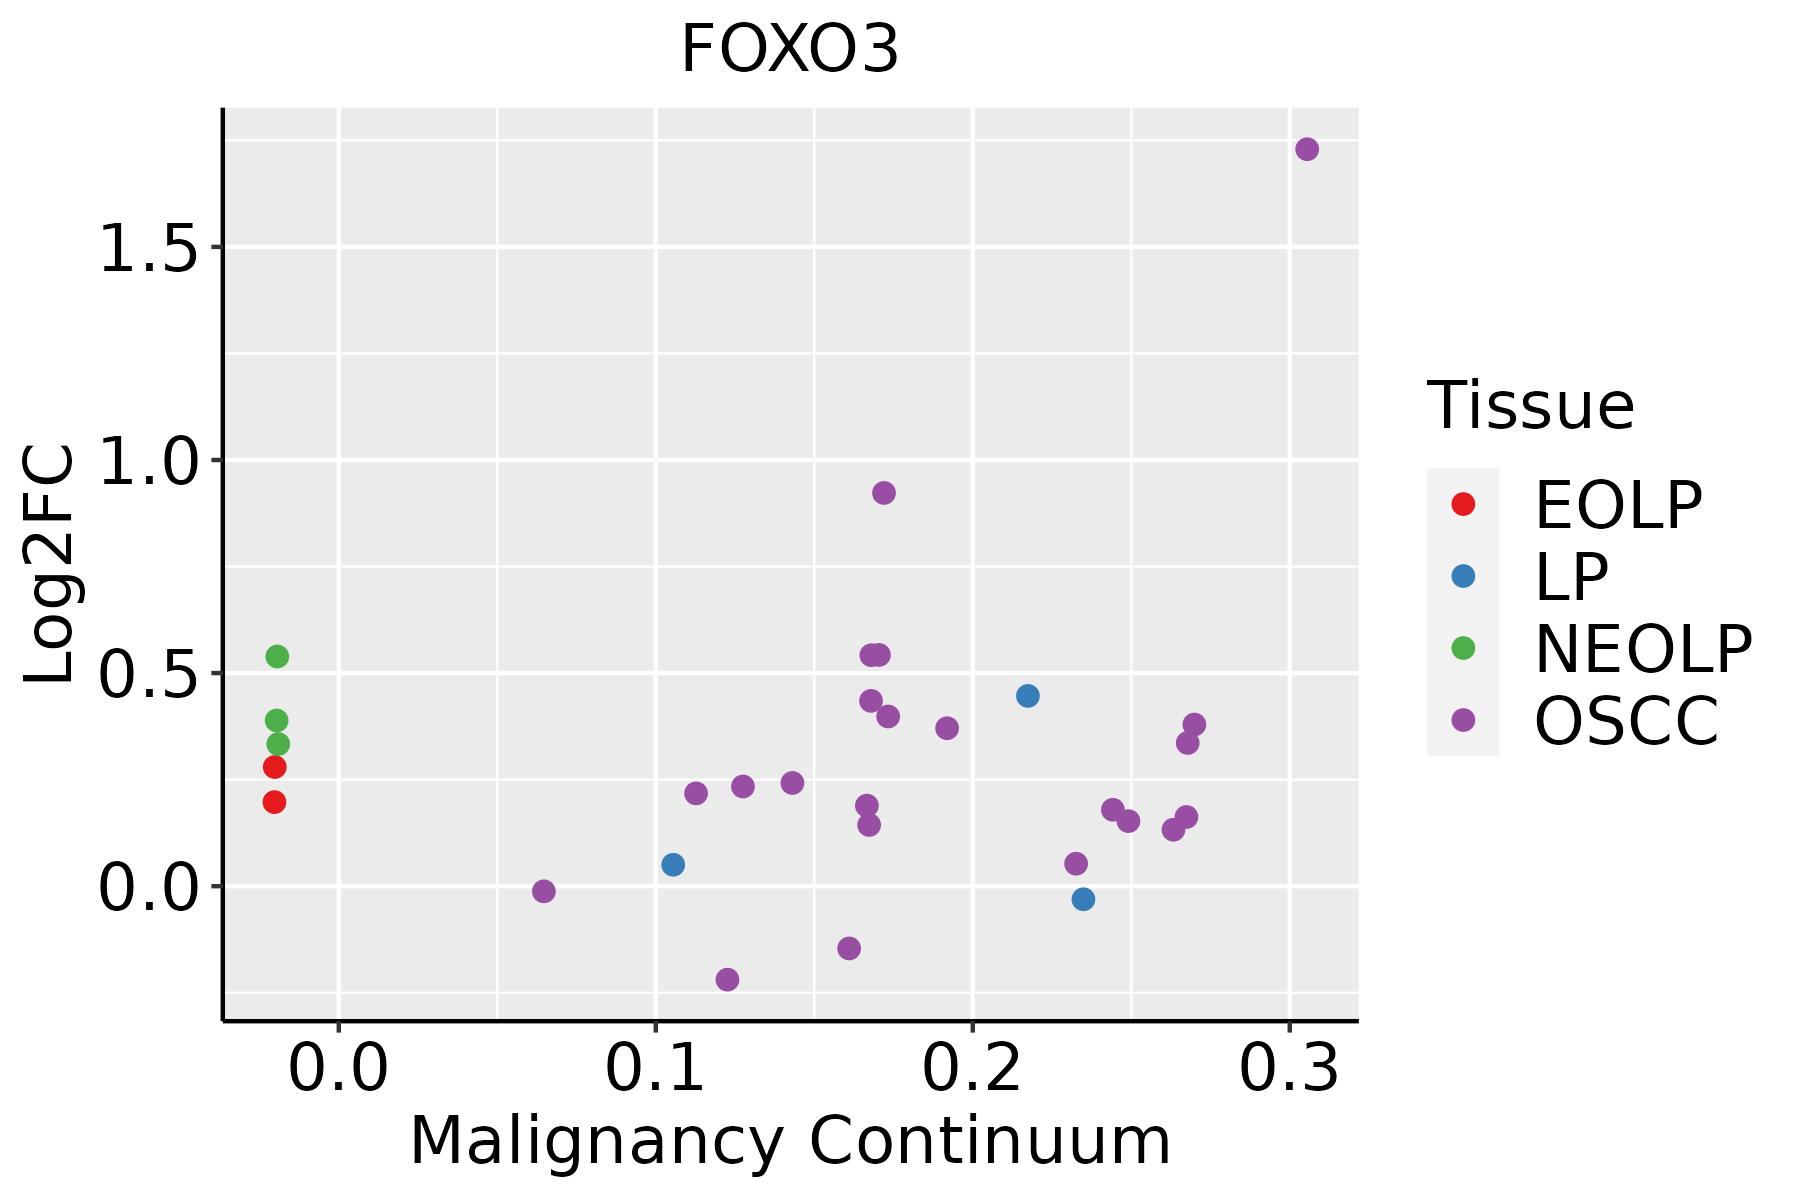 | EOLP: Erosive Oral lichen planus |
| LP: leukoplakia | ||
| NEOLP: Non-erosive oral lichen planus | ||
| OSCC: Oral squamous cell carcinoma | ||
| Prostate | 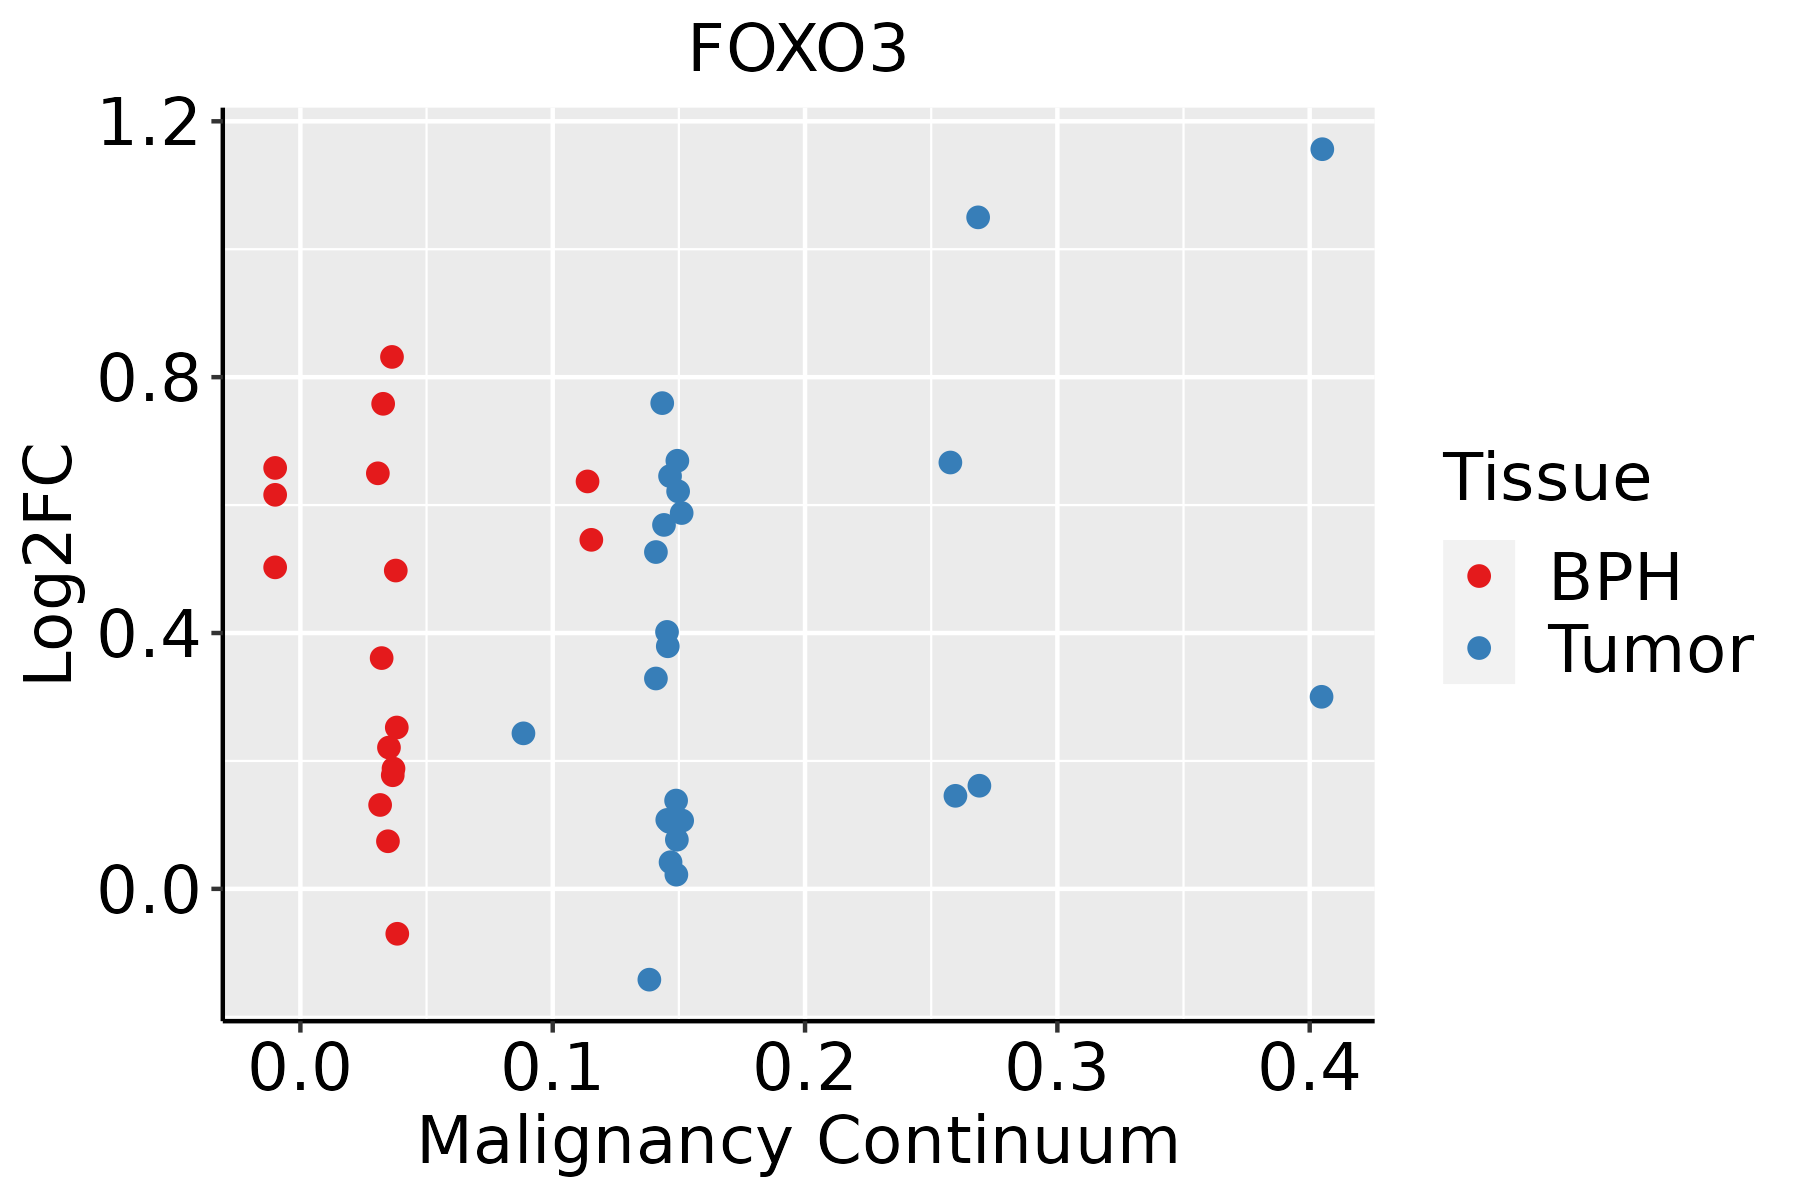 | BPH: Benign Prostatic Hyperplasia |
| Thyroid | 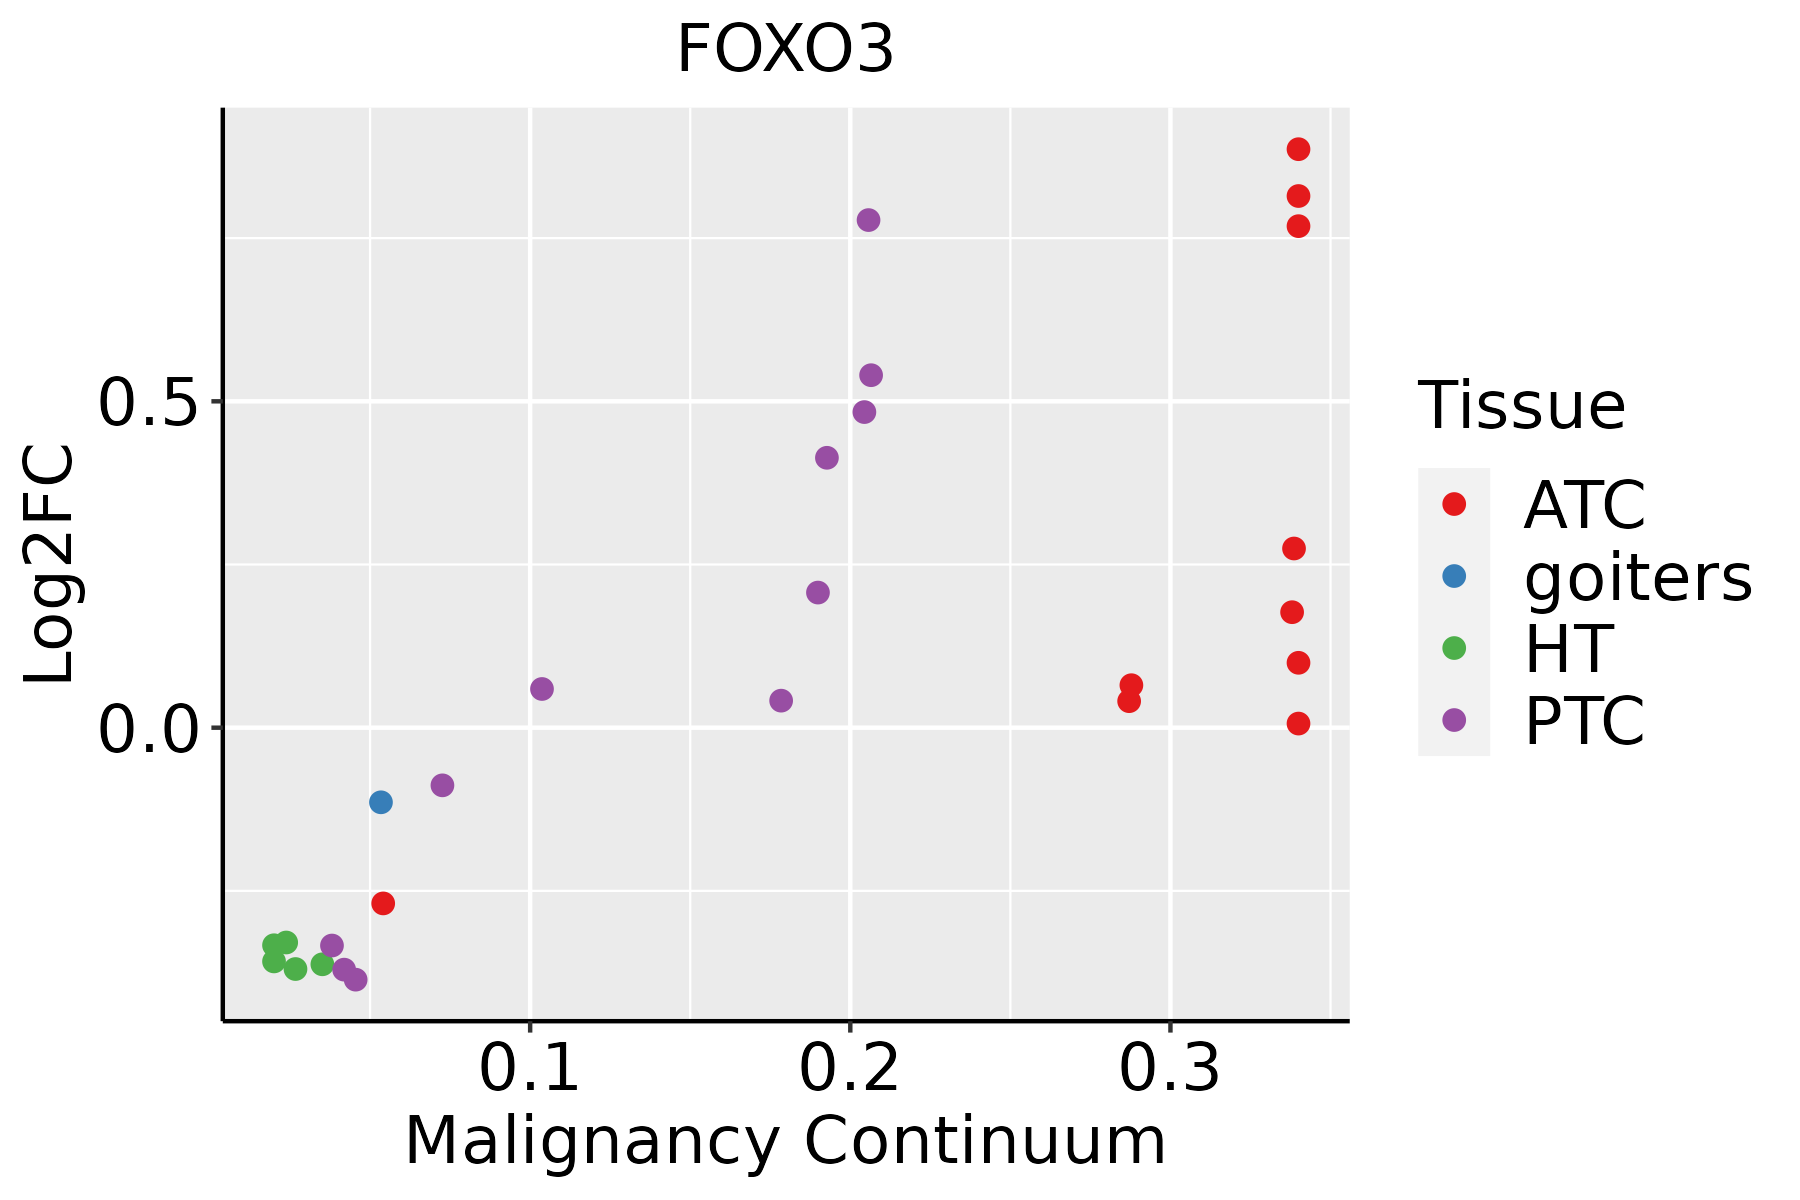 | ATC: Anaplastic thyroid cancer |
| HT: Hashimoto's thyroiditis | ||
| PTC: Papillary thyroid cancer |
| ∗log2FC in expression of this searched gene in stem-like cells from each diseased tissue sample relative to stem-like cells in normal samples in each tissue plotted against the malignancy continuum. Samples are colored based on if they are from different disease stage. |
Top |
Malignant transformation related pathway analysis |
| Find out the enriched GO biological processes and KEGG pathways involved in transition from healthy to precancer to cancer |
| Tissue | Disease Stage | Enriched GO biological Processes |
| Colorectum | AD |  |
| Colorectum | SER |  |
| Colorectum | MSS |  |
| Colorectum | MSI-H |  |
| Colorectum | FAP |  |
| ∗Top 15 enriched GO BP terms are showed in the bar plot of each disease state in each tissue. Each row represents a significant GO biological process which is colored according to the -log10(p.adjust). |
| Page: 1 2 3 4 5 6 7 8 9 |
| GO ID | Tissue | Disease Stage | Description | Gene Ratio | Bg Ratio | pvalue | p.adjust | Count |
| GO:190165512 | Prostate | Tumor | cellular response to ketone | 33/3246 | 96/18723 | 4.19e-05 | 4.76e-04 | 33 |
| GO:004350211 | Prostate | Tumor | regulation of muscle adaptation | 33/3246 | 98/18723 | 6.69e-05 | 7.18e-04 | 33 |
| GO:007030114 | Prostate | Tumor | cellular response to hydrogen peroxide | 33/3246 | 98/18723 | 6.69e-05 | 7.18e-04 | 33 |
| GO:199008914 | Prostate | Tumor | response to nerve growth factor | 22/3246 | 56/18723 | 8.33e-05 | 8.38e-04 | 22 |
| GO:003647318 | Prostate | Tumor | cell death in response to oxidative stress | 32/3246 | 95/18723 | 8.50e-05 | 8.48e-04 | 32 |
| GO:001050814 | Prostate | Tumor | positive regulation of autophagy | 39/3246 | 124/18723 | 8.56e-05 | 8.53e-04 | 39 |
| GO:009730518 | Prostate | Tumor | response to alcohol | 68/3246 | 253/18723 | 9.02e-05 | 8.88e-04 | 68 |
| GO:005127114 | Prostate | Tumor | negative regulation of cellular component movement | 92/3246 | 367/18723 | 1.03e-04 | 9.99e-04 | 92 |
| GO:199009013 | Prostate | Tumor | cellular response to nerve growth factor stimulus | 21/3246 | 53/18723 | 1.04e-04 | 1.00e-03 | 21 |
| GO:007145614 | Prostate | Tumor | cellular response to hypoxia | 45/3246 | 151/18723 | 1.08e-04 | 1.03e-03 | 45 |
| GO:190040717 | Prostate | Tumor | regulation of cellular response to oxidative stress | 30/3246 | 89/18723 | 1.38e-04 | 1.27e-03 | 30 |
| GO:000840612 | Prostate | Tumor | gonad development | 60/3246 | 221/18723 | 1.68e-04 | 1.50e-03 | 60 |
| GO:004277012 | Prostate | Tumor | signal transduction in response to DNA damage | 49/3246 | 172/18723 | 1.87e-04 | 1.65e-03 | 49 |
| GO:200014614 | Prostate | Tumor | negative regulation of cell motility | 89/3246 | 359/18723 | 1.99e-04 | 1.74e-03 | 89 |
| GO:000941017 | Prostate | Tumor | response to xenobiotic stimulus | 110/3246 | 462/18723 | 2.13e-04 | 1.84e-03 | 110 |
| GO:009025713 | Prostate | Tumor | regulation of muscle system process | 66/3246 | 252/18723 | 2.54e-04 | 2.13e-03 | 66 |
| GO:000754811 | Prostate | Tumor | sex differentiation | 71/3246 | 276/18723 | 2.70e-04 | 2.24e-03 | 71 |
| GO:003428419 | Prostate | Tumor | response to monosaccharide | 60/3246 | 225/18723 | 2.84e-04 | 2.31e-03 | 60 |
| GO:003461217 | Prostate | Tumor | response to tumor necrosis factor | 66/3246 | 253/18723 | 2.87e-04 | 2.32e-03 | 66 |
| GO:007259315 | Prostate | Tumor | reactive oxygen species metabolic process | 63/3246 | 239/18723 | 2.87e-04 | 2.32e-03 | 63 |
| Page: 1 2 3 4 5 6 7 8 9 10 11 12 13 14 15 16 17 18 19 20 21 22 23 24 25 26 27 28 29 30 31 32 33 34 35 36 37 38 39 40 41 42 43 44 45 46 47 48 49 50 51 52 53 54 55 56 57 58 59 60 61 62 63 64 65 66 67 68 69 70 71 72 73 74 75 76 77 78 79 80 81 82 83 84 85 86 87 88 89 90 91 92 93 94 95 96 97 98 99 100 101 102 103 104 105 106 |
| Pathway ID | Tissue | Disease Stage | Description | Gene Ratio | Bg Ratio | pvalue | p.adjust | qvalue | Count |
| hsa05213 | Colorectum | AD | Endometrial cancer | 29/2092 | 58/8465 | 2.69e-05 | 2.57e-04 | 1.64e-04 | 29 |
| hsa04218 | Colorectum | AD | Cellular senescence | 53/2092 | 156/8465 | 5.55e-03 | 2.48e-02 | 1.58e-02 | 53 |
| hsa052131 | Colorectum | AD | Endometrial cancer | 29/2092 | 58/8465 | 2.69e-05 | 2.57e-04 | 1.64e-04 | 29 |
| hsa042181 | Colorectum | AD | Cellular senescence | 53/2092 | 156/8465 | 5.55e-03 | 2.48e-02 | 1.58e-02 | 53 |
| hsa052082 | Colorectum | SER | Chemical carcinogenesis - reactive oxygen species | 103/1580 | 223/8465 | 1.60e-21 | 7.57e-20 | 5.50e-20 | 103 |
| hsa051312 | Colorectum | SER | Shigellosis | 87/1580 | 247/8465 | 3.07e-10 | 7.27e-09 | 5.28e-09 | 87 |
| hsa047222 | Colorectum | SER | Neurotrophin signaling pathway | 35/1580 | 119/8465 | 2.80e-03 | 2.02e-02 | 1.47e-02 | 35 |
| hsa052132 | Colorectum | SER | Endometrial cancer | 20/1580 | 58/8465 | 3.05e-03 | 2.11e-02 | 1.53e-02 | 20 |
| hsa042132 | Colorectum | SER | Longevity regulating pathway - multiple species | 20/1580 | 62/8465 | 7.15e-03 | 3.77e-02 | 2.74e-02 | 20 |
| hsa041372 | Colorectum | SER | Mitophagy - animal | 22/1580 | 72/8465 | 9.93e-03 | 4.78e-02 | 3.47e-02 | 22 |
| hsa052083 | Colorectum | SER | Chemical carcinogenesis - reactive oxygen species | 103/1580 | 223/8465 | 1.60e-21 | 7.57e-20 | 5.50e-20 | 103 |
| hsa051313 | Colorectum | SER | Shigellosis | 87/1580 | 247/8465 | 3.07e-10 | 7.27e-09 | 5.28e-09 | 87 |
| hsa047223 | Colorectum | SER | Neurotrophin signaling pathway | 35/1580 | 119/8465 | 2.80e-03 | 2.02e-02 | 1.47e-02 | 35 |
| hsa052133 | Colorectum | SER | Endometrial cancer | 20/1580 | 58/8465 | 3.05e-03 | 2.11e-02 | 1.53e-02 | 20 |
| hsa042133 | Colorectum | SER | Longevity regulating pathway - multiple species | 20/1580 | 62/8465 | 7.15e-03 | 3.77e-02 | 2.74e-02 | 20 |
| hsa041373 | Colorectum | SER | Mitophagy - animal | 22/1580 | 72/8465 | 9.93e-03 | 4.78e-02 | 3.47e-02 | 22 |
| hsa052084 | Colorectum | MSS | Chemical carcinogenesis - reactive oxygen species | 118/1875 | 223/8465 | 2.71e-24 | 4.54e-22 | 2.78e-22 | 118 |
| hsa051314 | Colorectum | MSS | Shigellosis | 94/1875 | 247/8465 | 6.82e-09 | 1.34e-07 | 8.23e-08 | 94 |
| hsa052134 | Colorectum | MSS | Endometrial cancer | 27/1875 | 58/8465 | 3.18e-05 | 3.23e-04 | 1.98e-04 | 27 |
| hsa047224 | Colorectum | MSS | Neurotrophin signaling pathway | 45/1875 | 119/8465 | 7.04e-05 | 6.55e-04 | 4.02e-04 | 45 |
| Page: 1 2 3 4 5 6 7 8 9 10 11 12 13 14 15 16 17 |
Top |
Cell-cell communication analysis |
| Identification of potential cell-cell interactions between two cell types and their ligand-receptor pairs for different disease states |
| Ligand | Receptor | LRpair | Pathway | Tissue | Disease Stage |
| Page: 1 |
Top |
Single-cell gene regulatory network inference analysis |
| Find out the significant the regulons (TFs) and the target genes of each regulon across cell types for different disease states |
| TF | Cell Type | Tissue | Disease Stage | Target Gene | RSS | Regulon Activity |
| FOXO3 | MYOEPI | Breast | Healthy | TES,SLC38A1,ARID5B, etc. | 4.39e-01 |  |
| FOXO3 | INMON | Breast | Healthy | THBS1,ACSL1,CYP1B1, etc. | 1.71e-01 | |
| FOXO3 | MON | Breast | Healthy | THBS1,ACSL1,CYP1B1, etc. | 1.00e-01 | |
| FOXO3 | INMON | Breast | Precancer | THBS1,ACSL1,CYP1B1, etc. | 2.93e-01 |  |
| FOXO3 | CFIB | Colorectum | ADJ | MAPK10,XIST,FOXO1, etc. | 4.36e-01 |  |
| FOXO3 | AT2L | Lung | MIAC | ZBTB16,ALCAM,FAM13A, etc. | 6.22e-01 |  |
| FOXO3 | INMON | Lung | AAH | EREG,GLG1,PRAG1, etc. | 1.13e-01 |  |
| FOXO3 | INMON | Prostate | Healthy | ITSN1,UBE2R2,SLC4A7, etc. | 1.20e-01 |  |
| ∗The dot plots of a searched regulon are shown for all cell subpopulations in each disease state of each tissue based on the regulon specific score inferred using pySCENIC and by calculating the average expression. |
| Page: 1 |
Top |
Somatic mutation of malignant transformation related genes |
| Annotation of somatic variants for genes involved in malignant transformation |
| Hugo Symbol | Variant Class | Variant Classification | dbSNP RS | HGVSc | HGVSp | HGVSp Short | SWISSPROT | BIOTYPE | SIFT | PolyPhen | Tumor Sample Barcode | Tissue | Histology | Sex | Age | Stage | Therapy Types | Drugs | Outcome |
| FOXO3 | SNV | Missense_Mutation | novel | c.1165G>A | p.Asp389Asn | p.D389N | O43524 | protein_coding | tolerated(0.2) | possibly_damaging(0.644) | TCGA-AN-A046-01 | Breast | breast invasive carcinoma | Female | >=65 | I/II | Unknown | Unknown | SD |
| FOXO3 | SNV | Missense_Mutation | novel | c.1327N>A | p.Leu443Ile | p.L443I | O43524 | protein_coding | deleterious(0.01) | possibly_damaging(0.637) | TCGA-AQ-A04J-01 | Breast | breast invasive carcinoma | Female | <65 | I/II | Chemotherapy | cytoxan | SD |
| FOXO3 | SNV | Missense_Mutation | novel | c.1873N>C | p.Glu625Gln | p.E625Q | O43524 | protein_coding | deleterious(0.01) | possibly_damaging(0.616) | TCGA-AR-A0TT-01 | Breast | breast invasive carcinoma | Female | <65 | III/IV | Chemotherapy | doxorubicin | SD |
| FOXO3 | insertion | Frame_Shift_Ins | novel | c.1325_1326insTGGTT | p.Leu443GlyfsTer45 | p.L443Gfs*45 | O43524 | protein_coding | TCGA-AQ-A04J-01 | Breast | breast invasive carcinoma | Female | <65 | I/II | Chemotherapy | cytoxan | SD | ||
| FOXO3 | SNV | Missense_Mutation | novel | c.907C>A | p.Leu303Met | p.L303M | O43524 | protein_coding | tolerated(0.05) | possibly_damaging(0.898) | TCGA-2W-A8YY-01 | Cervix | cervical & endocervical cancer | Female | <65 | I/II | Chemotherapy | cisplatin | CR |
| FOXO3 | SNV | Missense_Mutation | novel | c.1156C>A | p.Leu386Ile | p.L386I | O43524 | protein_coding | tolerated(0.18) | benign(0.232) | TCGA-2W-A8YY-01 | Cervix | cervical & endocervical cancer | Female | <65 | I/II | Chemotherapy | cisplatin | CR |
| FOXO3 | SNV | Missense_Mutation | novel | c.730N>A | p.Gly244Arg | p.G244R | O43524 | protein_coding | deleterious(0) | probably_damaging(0.968) | TCGA-EA-A3HS-01 | Cervix | cervical & endocervical cancer | Female | <65 | I/II | Unknown | Unknown | SD |
| FOXO3 | SNV | Missense_Mutation | c.1103G>A | p.Arg368Gln | p.R368Q | O43524 | protein_coding | deleterious(0.02) | benign(0.066) | TCGA-EA-A410-01 | Cervix | cervical & endocervical cancer | Female | <65 | I/II | Unknown | Unknown | SD | |
| FOXO3 | SNV | Missense_Mutation | c.968N>T | p.Arg323Leu | p.R323L | O43524 | protein_coding | deleterious(0) | possibly_damaging(0.859) | TCGA-MA-AA3X-01 | Cervix | cervical & endocervical cancer | Female | <65 | III/IV | Chemotherapy | cisplatin | CR | |
| FOXO3 | SNV | Missense_Mutation | rs570814853 | c.1330C>T | p.Arg444Cys | p.R444C | O43524 | protein_coding | deleterious(0.04) | benign(0.021) | TCGA-AA-A02R-01 | Colorectum | colon adenocarcinoma | Female | >=65 | I/II | Unknown | Unknown | PD |
| Page: 1 2 3 4 5 6 |
Top |
Related drugs of malignant transformation related genes |
| Identification of chemicals and drugs interact with genes involved in malignant transfromation |
| (DGIdb 4.0) |
| Entrez ID | Symbol | Category | Interaction Types | Drug Claim Name | Drug Name | PMIDs |
| 2309 | FOXO3 | TRANSCRIPTION FACTOR, CLINICALLY ACTIONABLE | RESVERATROL | RESVERATROL | 17513867 | |
| 2309 | FOXO3 | TRANSCRIPTION FACTOR, CLINICALLY ACTIONABLE | SYRINGARESINOL | SYRINGARESINOL | 25479772 |
| Page: 1 |

Copyright 2023-Present -The University of Texas Health Science Center at Houston |