| Tissue | Expression Dynamics | Abbreviation |
| Cervix | 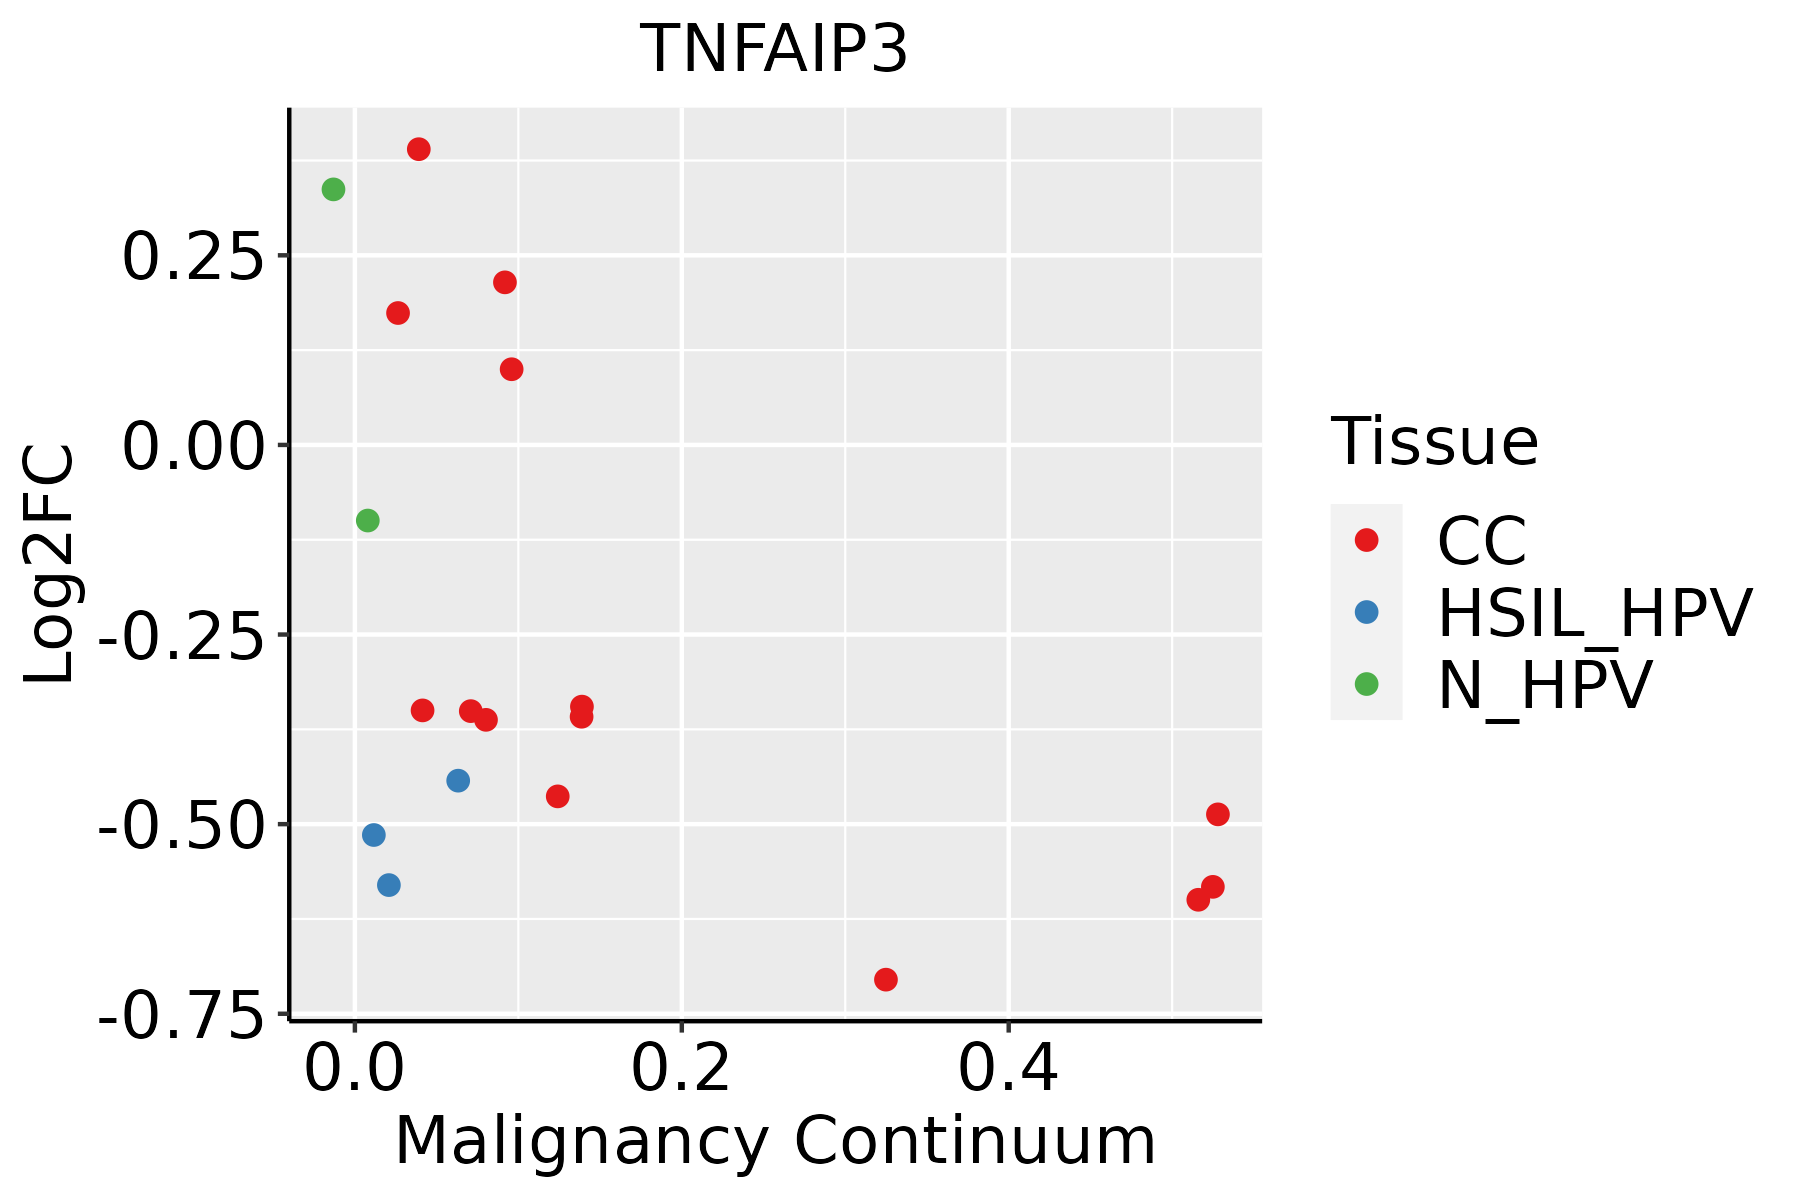 | CC: Cervix cancer |
| HSIL_HPV: HPV-infected high-grade squamous intraepithelial lesions |
| N_HPV: HPV-infected normal cervix |
| Endometrium | 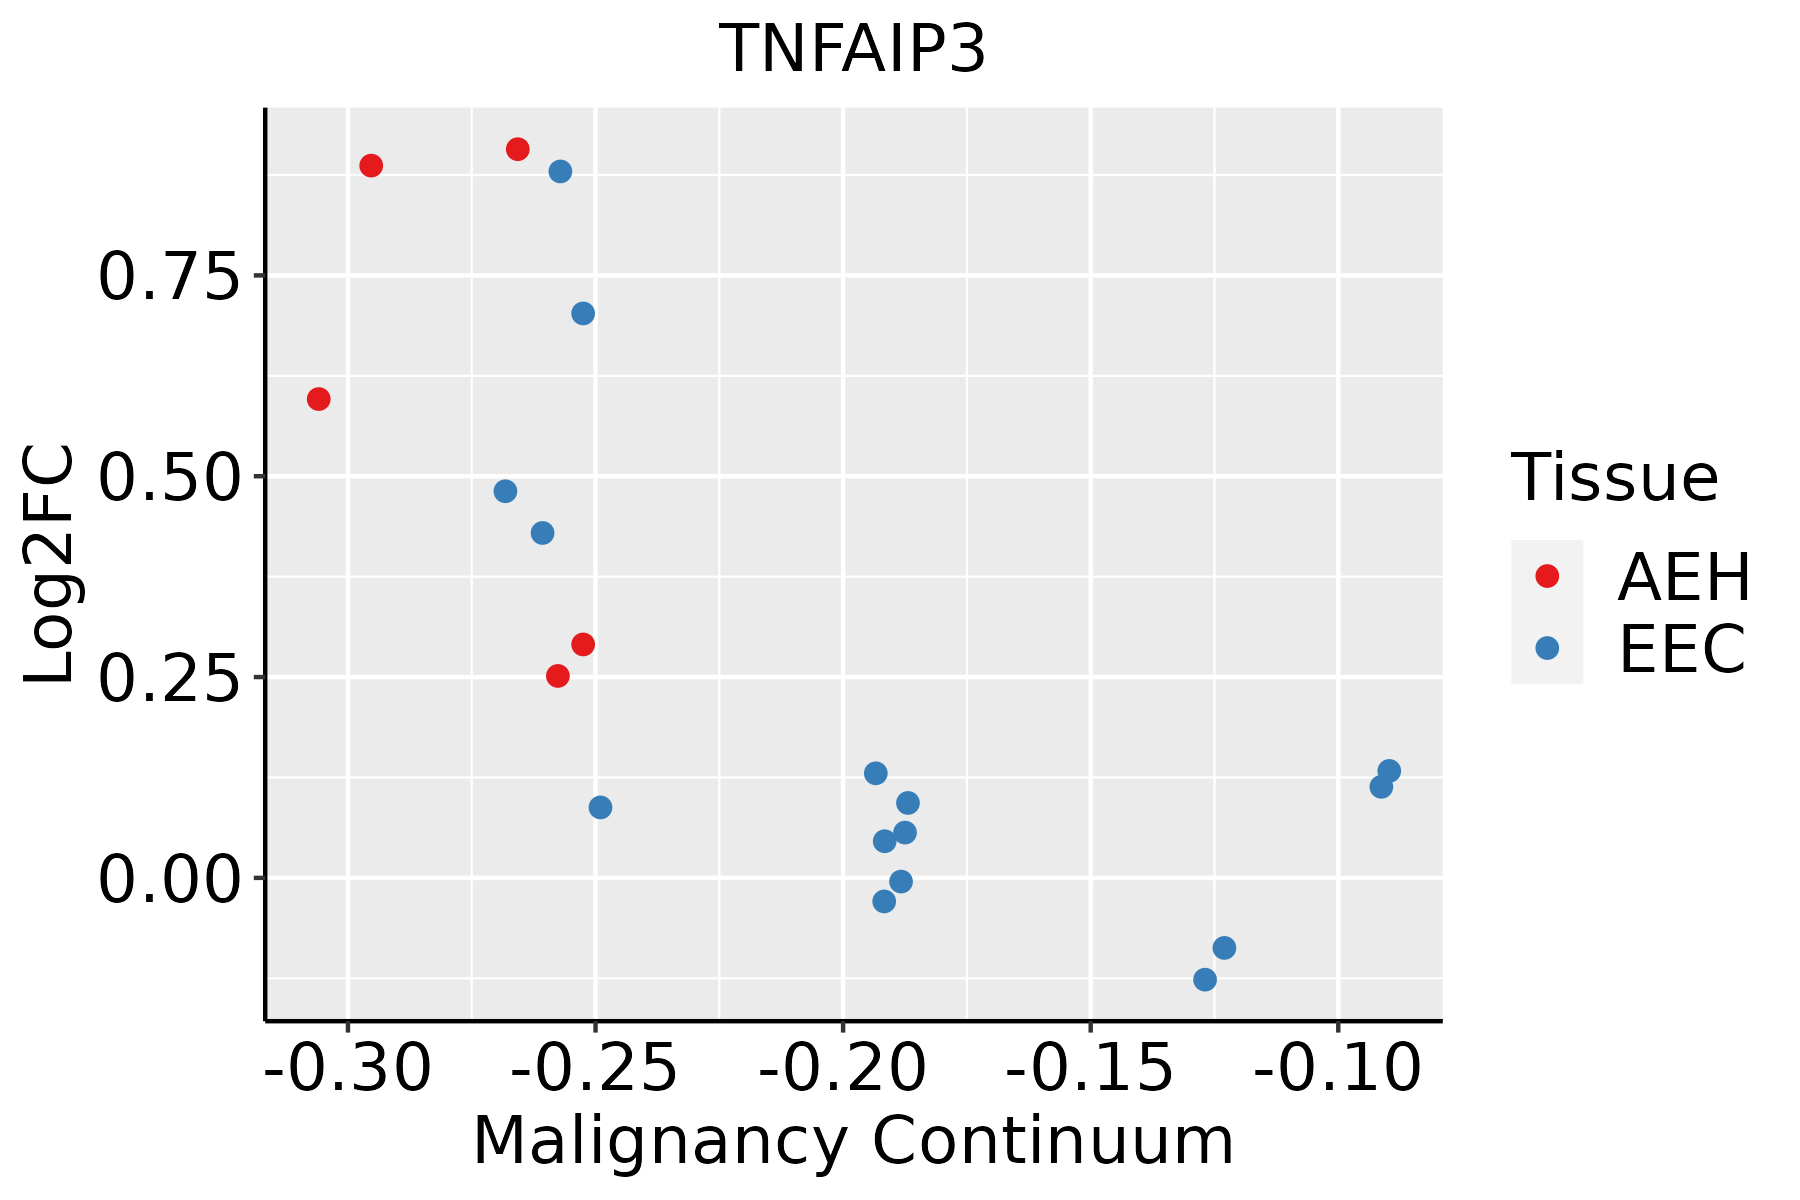 | AEH: Atypical endometrial hyperplasia |
| EEC: Endometrioid Cancer |
| Esophagus |  | ESCC: Esophageal squamous cell carcinoma |
| HGIN: High-grade intraepithelial neoplasias |
| LGIN: Low-grade intraepithelial neoplasias |
| GC | 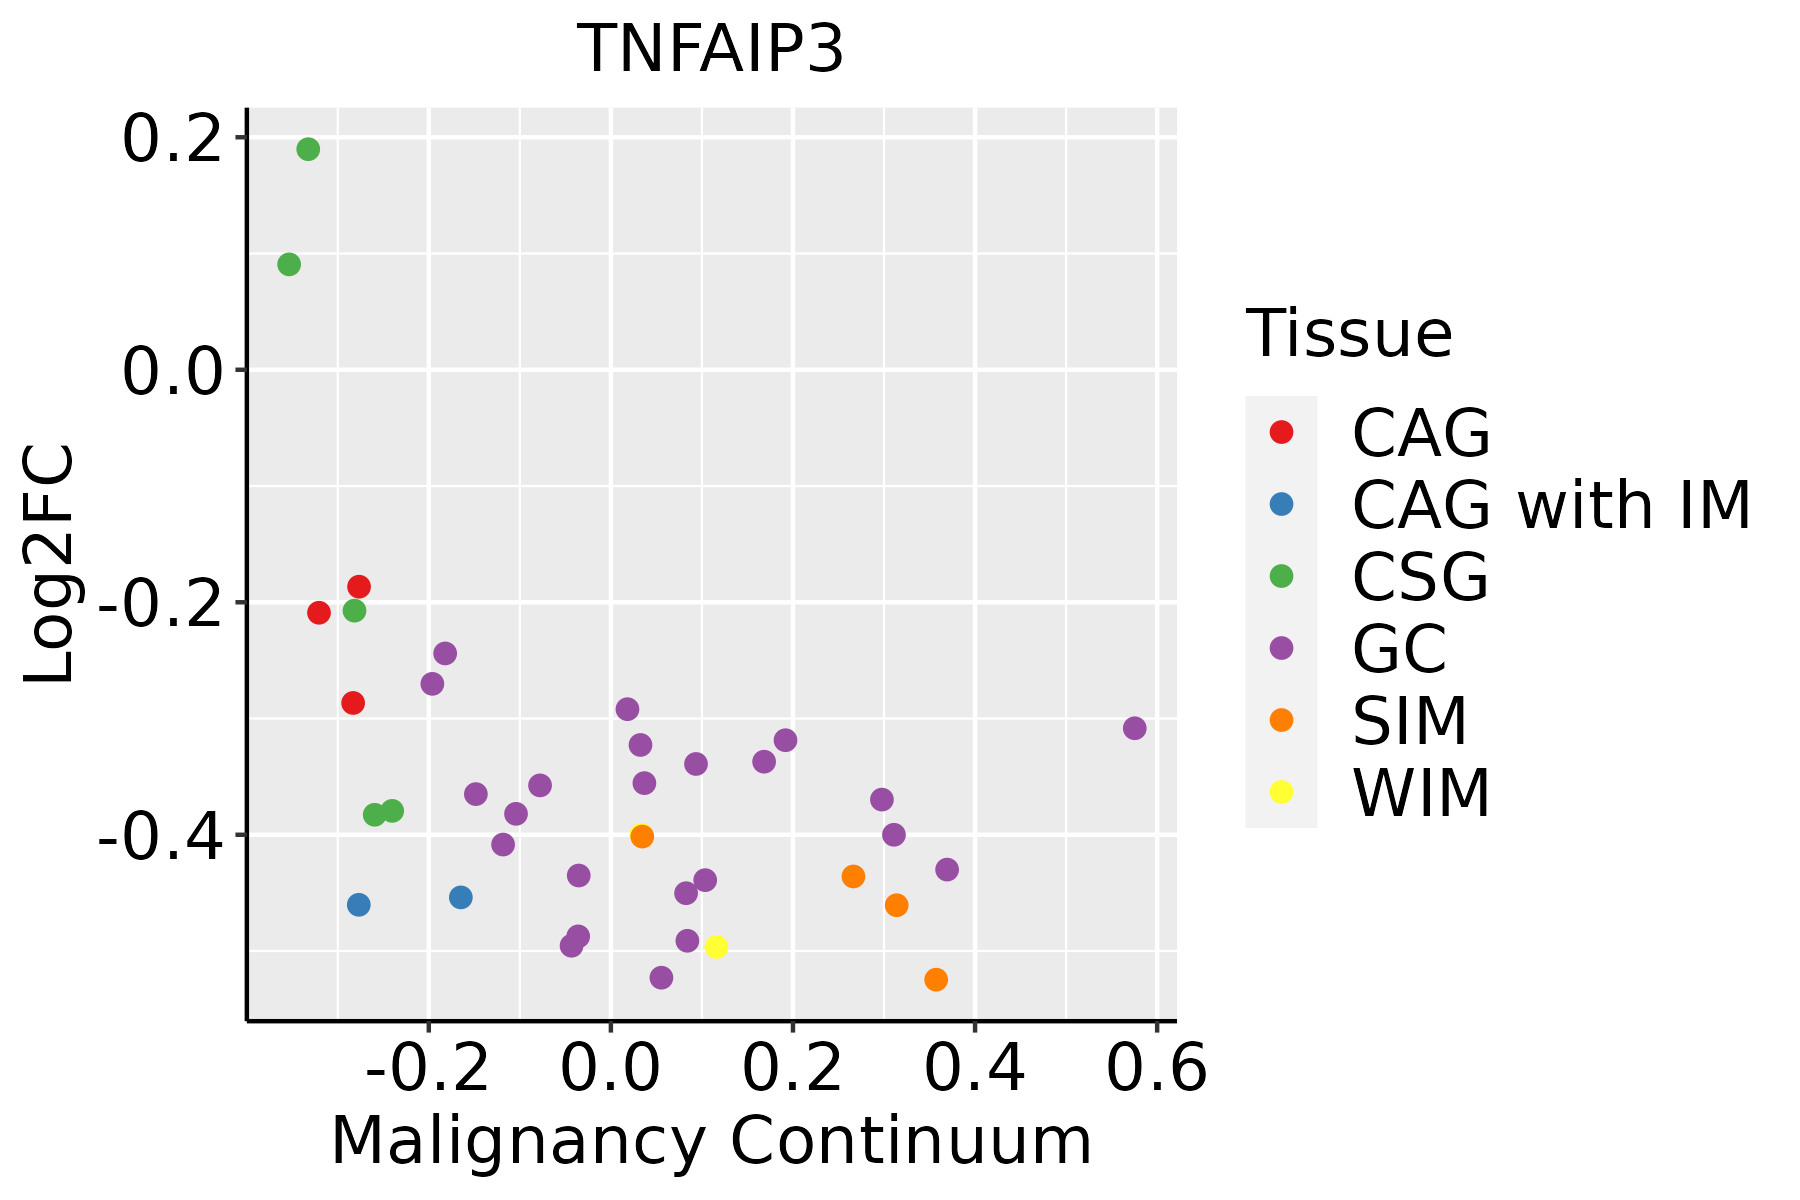 | CAG: Chronic atrophic gastritis |
| CAG with IM: Chronic atrophic gastritis with intestinal metaplasia |
| CSG: Chronic superficial gastritis |
| GC: Gastric cancer |
| SIM: Severe intestinal metaplasia |
| WIM: Wild intestinal metaplasia |
| Liver | 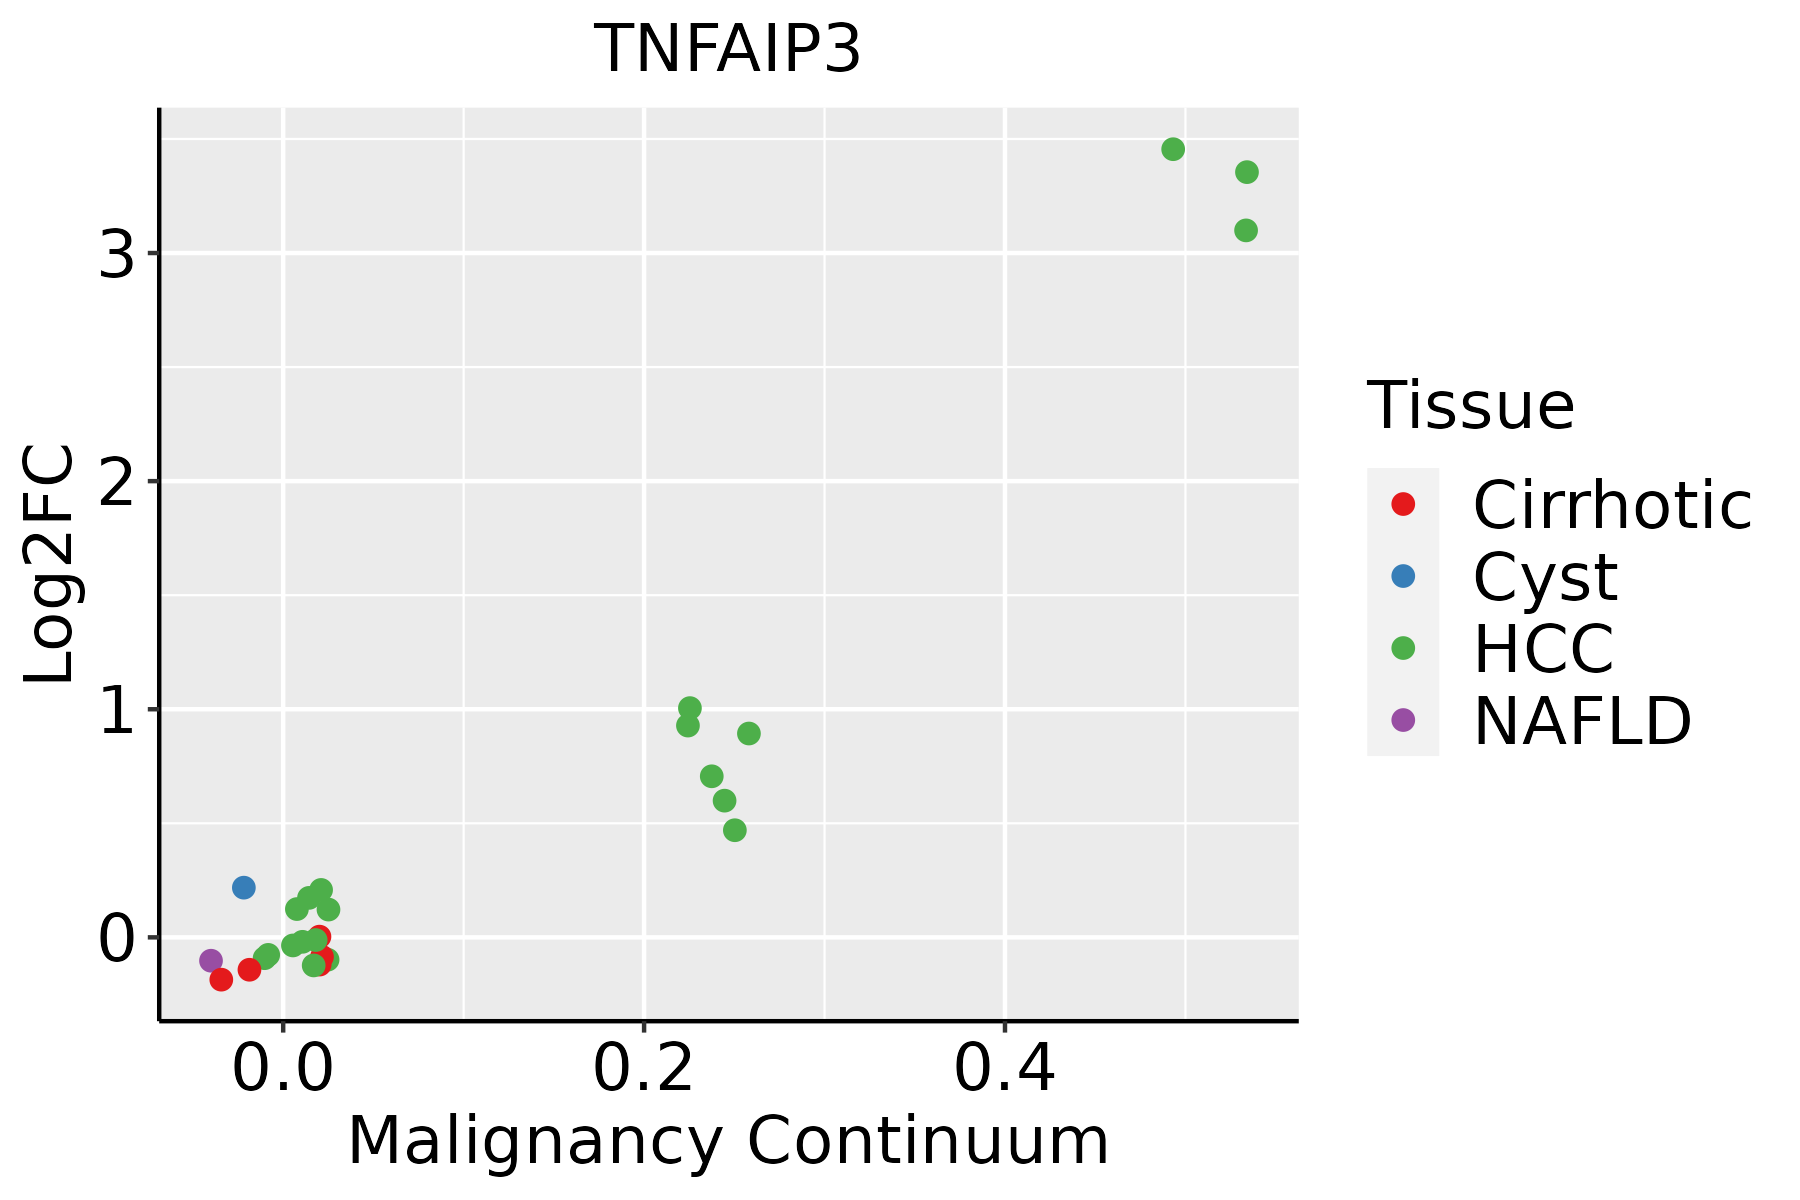 | HCC: Hepatocellular carcinoma |
| NAFLD: Non-alcoholic fatty liver disease |
| Oral Cavity | 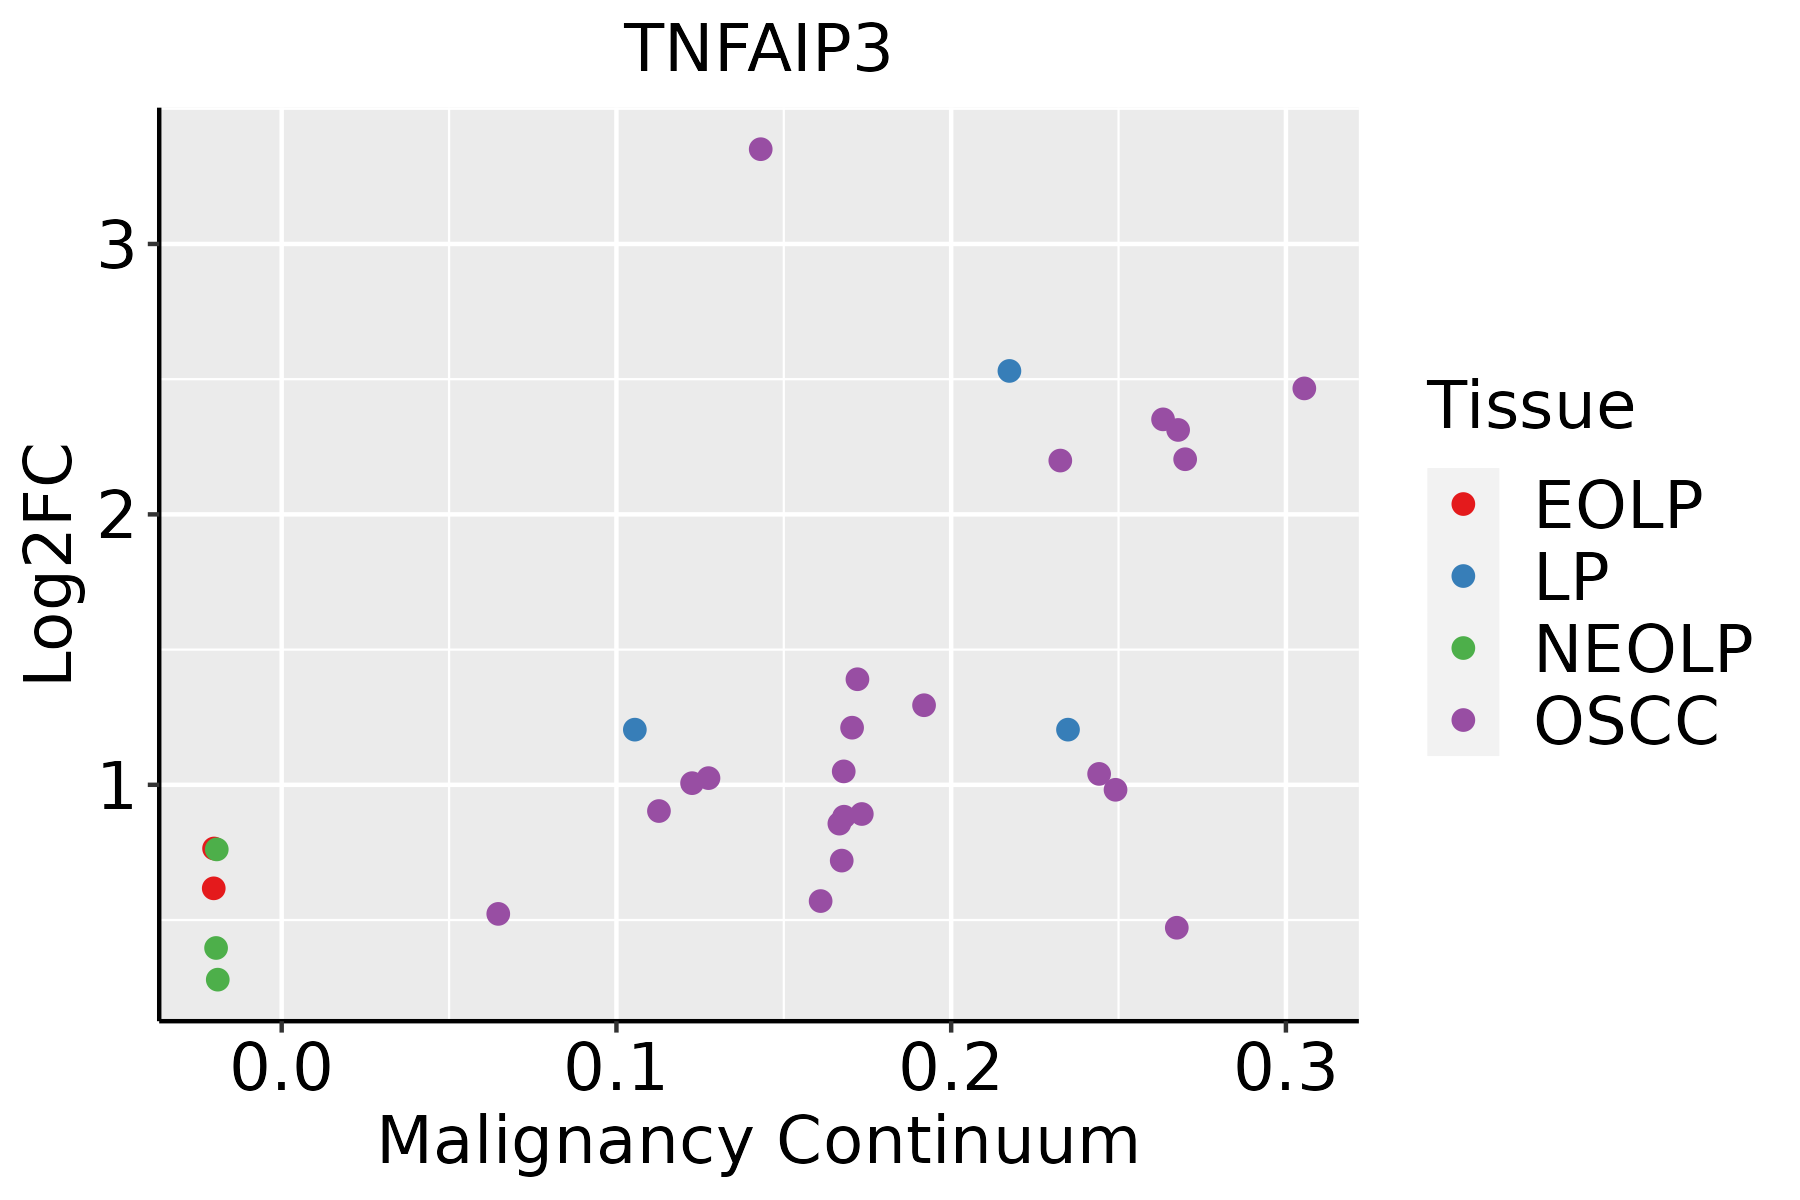 | EOLP: Erosive Oral lichen planus |
| LP: leukoplakia |
| NEOLP: Non-erosive oral lichen planus |
| OSCC: Oral squamous cell carcinoma |
| Prostate | 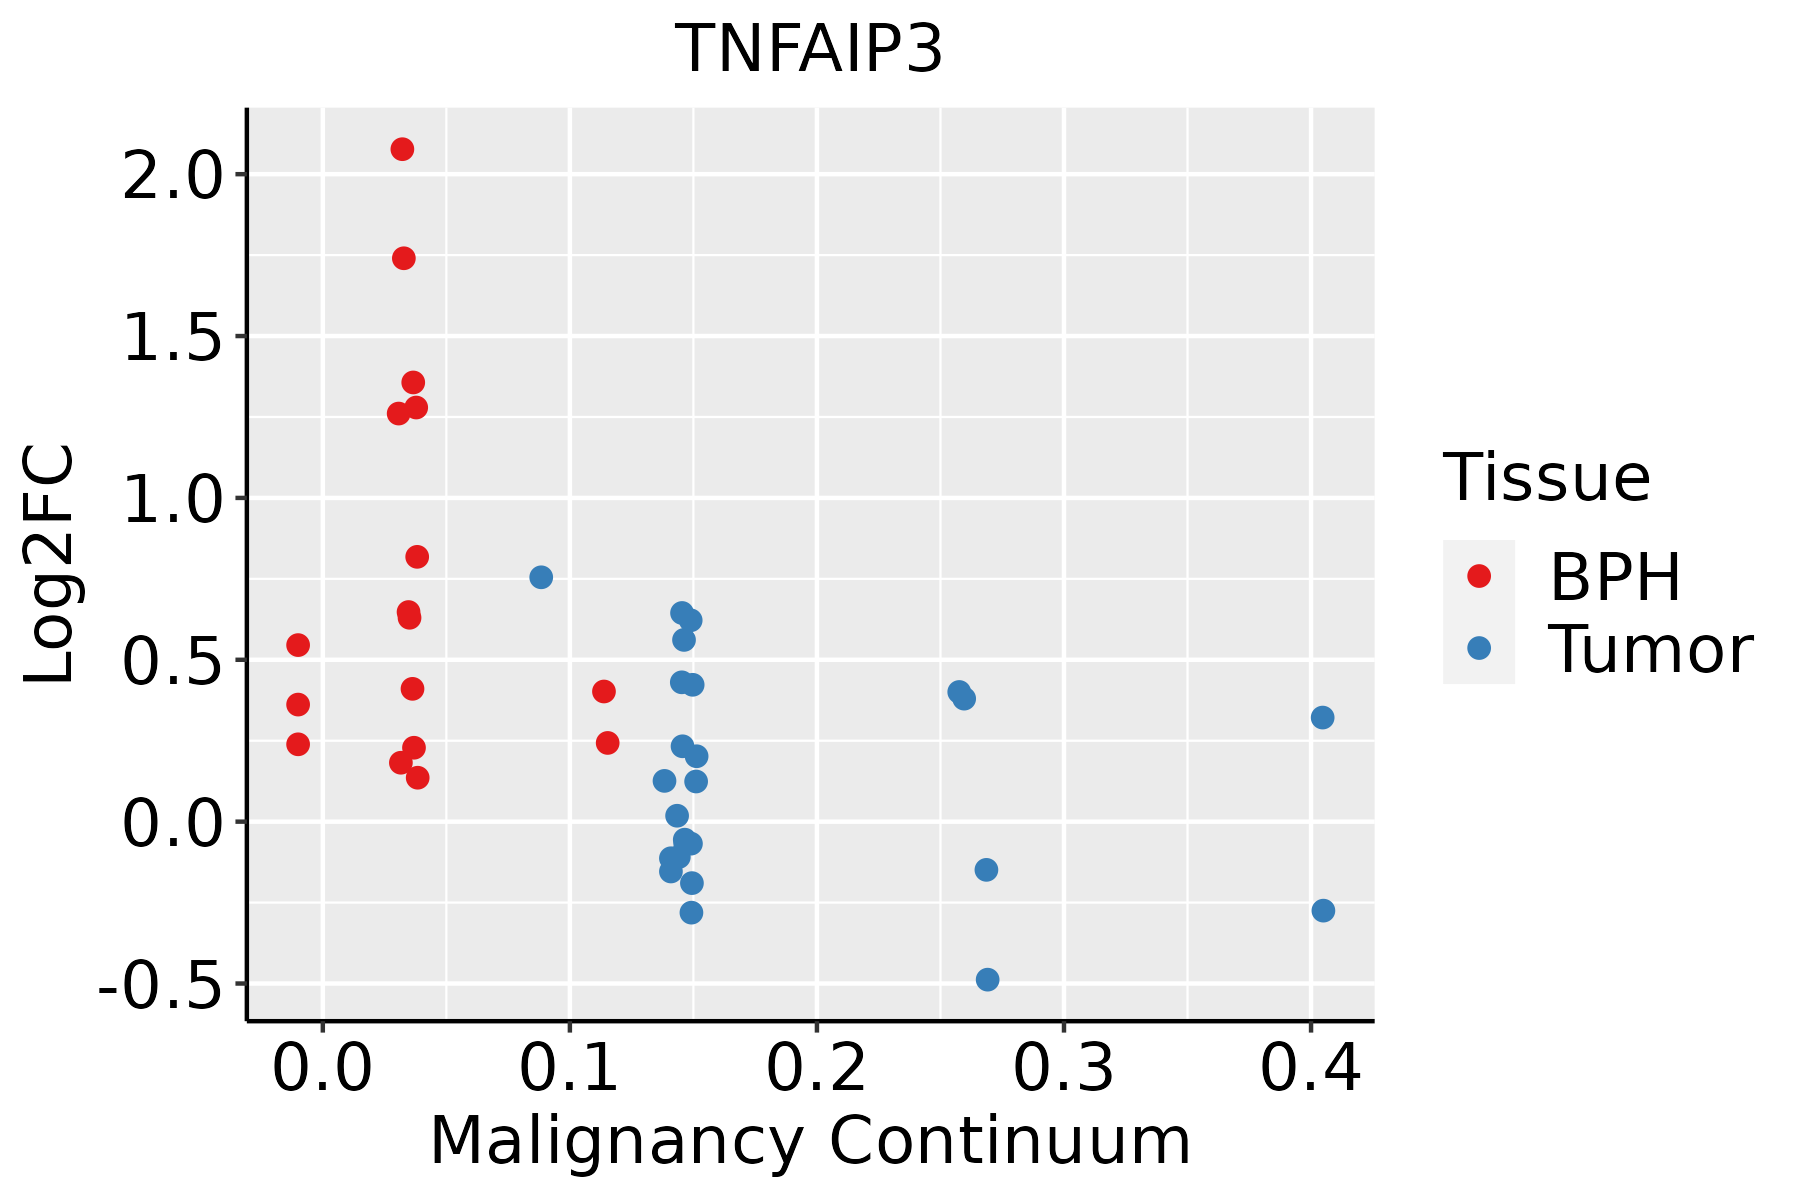 | BPH: Benign Prostatic Hyperplasia |
| Skin | 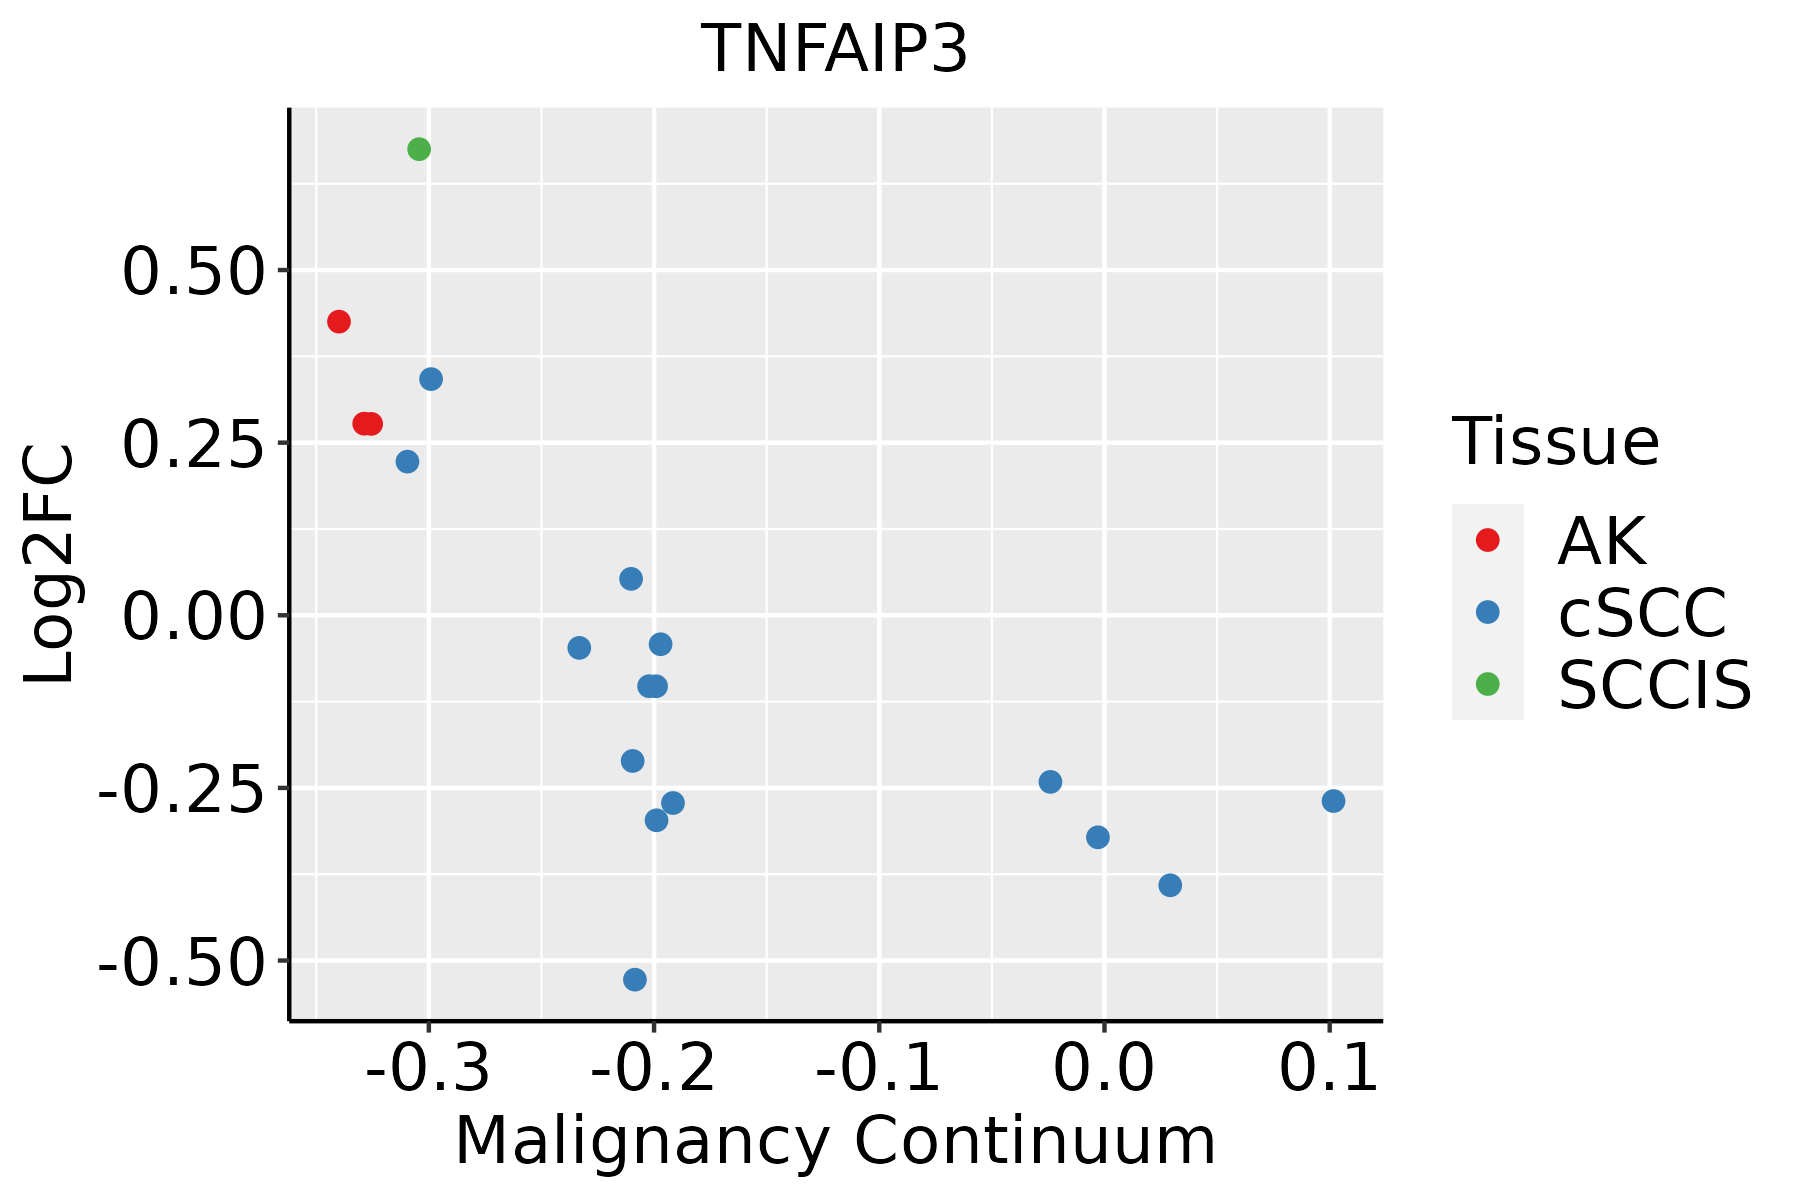 | AK: Actinic keratosis |
| cSCC: Cutaneous squamous cell carcinoma |
| SCCIS:squamous cell carcinoma in situ |
| Thyroid |  | ATC: Anaplastic thyroid cancer |
| HT: Hashimoto's thyroiditis |
| PTC: Papillary thyroid cancer |
| GO ID | Tissue | Disease Stage | Description | Gene Ratio | Bg Ratio | pvalue | p.adjust | Count |
| GO:002261221 | Skin | cSCC | gland morphogenesis | 45/4864 | 118/18723 | 2.43e-03 | 1.39e-02 | 45 |
| GO:007135625 | Skin | cSCC | cellular response to tumor necrosis factor | 79/4864 | 229/18723 | 2.48e-03 | 1.42e-02 | 79 |
| GO:0033673110 | Skin | cSCC | negative regulation of kinase activity | 81/4864 | 237/18723 | 2.95e-03 | 1.64e-02 | 81 |
| GO:200123727 | Skin | cSCC | negative regulation of extrinsic apoptotic signaling pathway | 38/4864 | 97/18723 | 2.95e-03 | 1.64e-02 | 38 |
| GO:00726669 | Skin | cSCC | establishment of protein localization to vacuole | 22/4864 | 49/18723 | 3.18e-03 | 1.74e-02 | 22 |
| GO:004508812 | Skin | cSCC | regulation of innate immune response | 75/4864 | 218/18723 | 3.40e-03 | 1.84e-02 | 75 |
| GO:00607596 | Skin | cSCC | regulation of response to cytokine stimulus | 57/4864 | 162/18723 | 5.77e-03 | 2.85e-02 | 57 |
| GO:00706464 | Skin | cSCC | protein modification by small protein removal | 55/4864 | 157/18723 | 7.29e-03 | 3.46e-02 | 55 |
| GO:00458246 | Skin | cSCC | negative regulation of innate immune response | 28/4864 | 71/18723 | 8.86e-03 | 4.07e-02 | 28 |
| GO:20012336 | Stomach | GC | regulation of apoptotic signaling pathway | 52/1159 | 356/18723 | 6.61e-09 | 7.05e-07 | 52 |
| GO:00018946 | Stomach | GC | tissue homeostasis | 43/1159 | 268/18723 | 8.25e-09 | 8.22e-07 | 43 |
| GO:00069796 | Stomach | GC | response to oxidative stress | 60/1159 | 446/18723 | 1.10e-08 | 1.01e-06 | 60 |
| GO:00602496 | Stomach | GC | anatomical structure homeostasis | 47/1159 | 314/18723 | 1.62e-08 | 1.40e-06 | 47 |
| GO:20012346 | Stomach | GC | negative regulation of apoptotic signaling pathway | 37/1159 | 224/18723 | 4.14e-08 | 2.85e-06 | 37 |
| GO:00971916 | Stomach | GC | extrinsic apoptotic signaling pathway | 34/1159 | 219/18723 | 6.52e-07 | 3.28e-05 | 34 |
| GO:19033216 | Stomach | GC | negative regulation of protein modification by small protein conjugation or removal | 20/1159 | 95/18723 | 1.15e-06 | 5.36e-05 | 20 |
| GO:00420606 | Stomach | GC | wound healing | 52/1159 | 422/18723 | 1.63e-06 | 7.50e-05 | 52 |
| GO:0071356 | Stomach | GC | cellular response to tumor necrosis factor | 34/1159 | 229/18723 | 1.85e-06 | 8.24e-05 | 34 |
| GO:00621976 | Stomach | GC | cellular response to chemical stress | 44/1159 | 337/18723 | 2.24e-06 | 9.73e-05 | 44 |
| GO:00313976 | Stomach | GC | negative regulation of protein ubiquitination | 18/1159 | 83/18723 | 2.50e-06 | 1.07e-04 | 18 |
| Pathway ID | Tissue | Disease Stage | Description | Gene Ratio | Bg Ratio | pvalue | p.adjust | qvalue | Count |
| hsa0516920 | Cervix | CC | Epstein-Barr virus infection | 57/1267 | 202/8465 | 7.30e-07 | 7.39e-06 | 4.37e-06 | 57 |
| hsa0465718 | Cervix | CC | IL-17 signaling pathway | 31/1267 | 94/8465 | 8.71e-06 | 7.43e-05 | 4.39e-05 | 31 |
| hsa046686 | Cervix | CC | TNF signaling pathway | 28/1267 | 114/8465 | 4.60e-03 | 1.62e-02 | 9.59e-03 | 28 |
| hsa046213 | Cervix | CC | NOD-like receptor signaling pathway | 41/1267 | 186/8465 | 5.90e-03 | 1.95e-02 | 1.15e-02 | 41 |
| hsa05169110 | Cervix | CC | Epstein-Barr virus infection | 57/1267 | 202/8465 | 7.30e-07 | 7.39e-06 | 4.37e-06 | 57 |
| hsa0465719 | Cervix | CC | IL-17 signaling pathway | 31/1267 | 94/8465 | 8.71e-06 | 7.43e-05 | 4.39e-05 | 31 |
| hsa0466813 | Cervix | CC | TNF signaling pathway | 28/1267 | 114/8465 | 4.60e-03 | 1.62e-02 | 9.59e-03 | 28 |
| hsa0462112 | Cervix | CC | NOD-like receptor signaling pathway | 41/1267 | 186/8465 | 5.90e-03 | 1.95e-02 | 1.15e-02 | 41 |
| hsa0465722 | Cervix | HSIL_HPV | IL-17 signaling pathway | 15/459 | 94/8465 | 1.45e-04 | 1.74e-03 | 1.40e-03 | 15 |
| hsa0516923 | Cervix | HSIL_HPV | Epstein-Barr virus infection | 22/459 | 202/8465 | 1.35e-03 | 9.68e-03 | 7.82e-03 | 22 |
| hsa0465732 | Cervix | HSIL_HPV | IL-17 signaling pathway | 15/459 | 94/8465 | 1.45e-04 | 1.74e-03 | 1.40e-03 | 15 |
| hsa0516933 | Cervix | HSIL_HPV | Epstein-Barr virus infection | 22/459 | 202/8465 | 1.35e-03 | 9.68e-03 | 7.82e-03 | 22 |
| hsa0516942 | Cervix | N_HPV | Epstein-Barr virus infection | 19/349 | 202/8465 | 6.54e-04 | 4.94e-03 | 3.86e-03 | 19 |
| hsa0516952 | Cervix | N_HPV | Epstein-Barr virus infection | 19/349 | 202/8465 | 6.54e-04 | 4.94e-03 | 3.86e-03 | 19 |
| hsa0516924 | Endometrium | AEH | Epstein-Barr virus infection | 42/1197 | 202/8465 | 5.72e-03 | 3.05e-02 | 2.23e-02 | 42 |
| hsa05169111 | Endometrium | AEH | Epstein-Barr virus infection | 42/1197 | 202/8465 | 5.72e-03 | 3.05e-02 | 2.23e-02 | 42 |
| hsa0516925 | Endometrium | EEC | Epstein-Barr virus infection | 47/1237 | 202/8465 | 6.17e-04 | 4.41e-03 | 3.29e-03 | 47 |
| hsa046687 | Endometrium | EEC | TNF signaling pathway | 27/1237 | 114/8465 | 6.47e-03 | 3.22e-02 | 2.40e-02 | 27 |
| hsa0465720 | Endometrium | EEC | IL-17 signaling pathway | 23/1237 | 94/8465 | 7.61e-03 | 3.63e-02 | 2.71e-02 | 23 |
| hsa0516934 | Endometrium | EEC | Epstein-Barr virus infection | 47/1237 | 202/8465 | 6.17e-04 | 4.41e-03 | 3.29e-03 | 47 |
| Hugo Symbol | Variant Class | Variant Classification | dbSNP RS | HGVSc | HGVSp | HGVSp Short | SWISSPROT | BIOTYPE | SIFT | PolyPhen | Tumor Sample Barcode | Tissue | Histology | Sex | Age | Stage | Therapy Types | Drugs | Outcome |
| TNFAIP3 | SNV | Missense_Mutation | | c.36N>C | p.Leu12Phe | p.L12F | P21580 | protein_coding | tolerated(0.29) | benign(0.2) | TCGA-5L-AAT1-01 | Breast | breast invasive carcinoma | Female | <65 | III/IV | Hormone Therapy | letrozol | SD |
| TNFAIP3 | SNV | Missense_Mutation | | c.1439N>A | p.Ser480Asn | p.S480N | P21580 | protein_coding | deleterious(0.01) | benign(0.003) | TCGA-A2-A04P-01 | Breast | breast invasive carcinoma | Female | <65 | III/IV | Chemotherapy | taxol | PD |
| TNFAIP3 | SNV | Missense_Mutation | | c.979N>T | p.Ala327Ser | p.A327S | P21580 | protein_coding | tolerated(0.07) | benign(0.305) | TCGA-A2-A0YG-01 | Breast | breast invasive carcinoma | Female | <65 | III/IV | Chemotherapy | cytoxan | SD |
| TNFAIP3 | SNV | Missense_Mutation | | c.650N>C | p.Ser217Thr | p.S217T | P21580 | protein_coding | deleterious(0.01) | possibly_damaging(0.79) | TCGA-AO-A1KR-01 | Breast | breast invasive carcinoma | Female | <65 | I/II | Chemotherapy | cyclophosphamide | SD |
| TNFAIP3 | SNV | Missense_Mutation | | c.1711N>A | p.Val571Ile | p.V571I | P21580 | protein_coding | tolerated(0.48) | benign(0) | TCGA-BH-A0H6-01 | Breast | breast invasive carcinoma | Female | >=65 | I/II | Unknown | Unknown | SD |
| TNFAIP3 | deletion | Frame_Shift_Del | novel | c.285_294delNNNNNNNNNN | p.Lys96ValfsTer24 | p.K96Vfs*24 | P21580 | protein_coding | | | TCGA-A2-A25B-01 | Breast | breast invasive carcinoma | Female | <65 | I/II | Chemotherapy | taxotere | PD |
| TNFAIP3 | insertion | Frame_Shift_Ins | novel | c.2184_2185insACATTAGT | p.Ser729ThrfsTer90 | p.S729Tfs*90 | P21580 | protein_coding | | | TCGA-AR-A0TW-01 | Breast | breast invasive carcinoma | Female | <65 | III/IV | Chemotherapy | doxorubicin | PD |
| TNFAIP3 | SNV | Missense_Mutation | rs775850329 | c.259N>G | p.Arg87Gly | p.R87G | P21580 | protein_coding | deleterious(0.03) | benign(0.009) | TCGA-C5-A2M2-01 | Cervix | cervical & endocervical cancer | Female | <65 | I/II | Unknown | Unknown | SD |
| TNFAIP3 | SNV | Missense_Mutation | | c.2193N>T | p.Glu731Asp | p.E731D | P21580 | protein_coding | tolerated(0.67) | benign(0.031) | TCGA-DS-A7WF-01 | Cervix | cervical & endocervical cancer | Female | <65 | I/II | Chemotherapy | cisplatin | PD |
| TNFAIP3 | SNV | Missense_Mutation | novel | c.217N>G | p.Ile73Val | p.I73V | P21580 | protein_coding | tolerated(1) | benign(0) | TCGA-5M-AAT4-01 | Colorectum | colon adenocarcinoma | Male | >=65 | III/IV | Unknown | Unknown | PD |


