
|
|||||
|
 | |
| |
| |
| |
| |
| |
|
Gene: TF |
Gene summary for TF |
| Gene information | Species | Human | Gene symbol | TF | Gene ID | 7018 |
| Gene name | transferrin | |
| Gene Alias | HEL-S-71p | |
| Cytomap | 3q22.1 | |
| Gene Type | protein-coding | GO ID | GO:0000041 | UniProtAcc | A0PJA6 |
Top |
Malignant transformation analysis |
| Identification of the aberrant gene expression in precancerous and cancerous lesions by comparing the gene expression of stem-like cells in diseased tissues with normal stem cells |
| Entrez ID | Symbol | Replicates | Species | Organ | Tissue | Adj P-value | Log2FC | Malignancy |
| 7018 | TF | P8T-E | Human | Esophagus | ESCC | 1.25e-10 | 4.06e-01 | 0.0889 |
| 7018 | TF | P10T-E | Human | Esophagus | ESCC | 1.42e-06 | -5.41e-02 | 0.116 |
| 7018 | TF | P16T-E | Human | Esophagus | ESCC | 1.60e-16 | 2.50e-01 | 0.1153 |
| 7018 | TF | P22T-E | Human | Esophagus | ESCC | 2.40e-03 | -8.78e-02 | 0.1236 |
| 7018 | TF | P57T-E | Human | Esophagus | ESCC | 9.24e-21 | 1.12e+00 | 0.0926 |
| 7018 | TF | P74T-E | Human | Esophagus | ESCC | 2.85e-03 | 1.43e-01 | 0.1479 |
| 7018 | TF | P76T-E | Human | Esophagus | ESCC | 5.67e-12 | 8.38e-01 | 0.1207 |
| 7018 | TF | P128T-E | Human | Esophagus | ESCC | 5.02e-19 | 1.31e+00 | 0.1241 |
| 7018 | TF | NAFLD1 | Human | Liver | NAFLD | 1.33e-14 | 1.52e+00 | -0.04 |
| 7018 | TF | S43 | Human | Liver | Cirrhotic | 1.96e-06 | 4.81e-01 | -0.0187 |
| 7018 | TF | HCC1_Meng | Human | Liver | HCC | 7.28e-77 | 1.16e+00 | 0.0246 |
| 7018 | TF | HCC2_Meng | Human | Liver | HCC | 6.25e-19 | -6.79e-01 | 0.0107 |
| 7018 | TF | cirrhotic1 | Human | Liver | Cirrhotic | 3.69e-15 | -1.70e-01 | 0.0202 |
| 7018 | TF | cirrhotic2 | Human | Liver | Cirrhotic | 1.67e-15 | -1.87e-01 | 0.0201 |
| 7018 | TF | cirrhotic3 | Human | Liver | Cirrhotic | 2.61e-02 | -4.09e-01 | 0.0215 |
| 7018 | TF | HCC1 | Human | Liver | HCC | 7.61e-40 | 8.09e+00 | 0.5336 |
| 7018 | TF | HCC2 | Human | Liver | HCC | 6.48e-53 | 8.08e+00 | 0.5341 |
| 7018 | TF | HCC5 | Human | Liver | HCC | 3.83e-07 | 4.78e+00 | 0.4932 |
| 7018 | TF | Pt13.a | Human | Liver | HCC | 1.44e-27 | 2.57e-01 | 0.021 |
| 7018 | TF | Pt13.b | Human | Liver | HCC | 8.21e-34 | 3.51e-02 | 0.0251 |
| Page: 1 2 |
| Tissue | Expression Dynamics | Abbreviation |
| Esophagus | 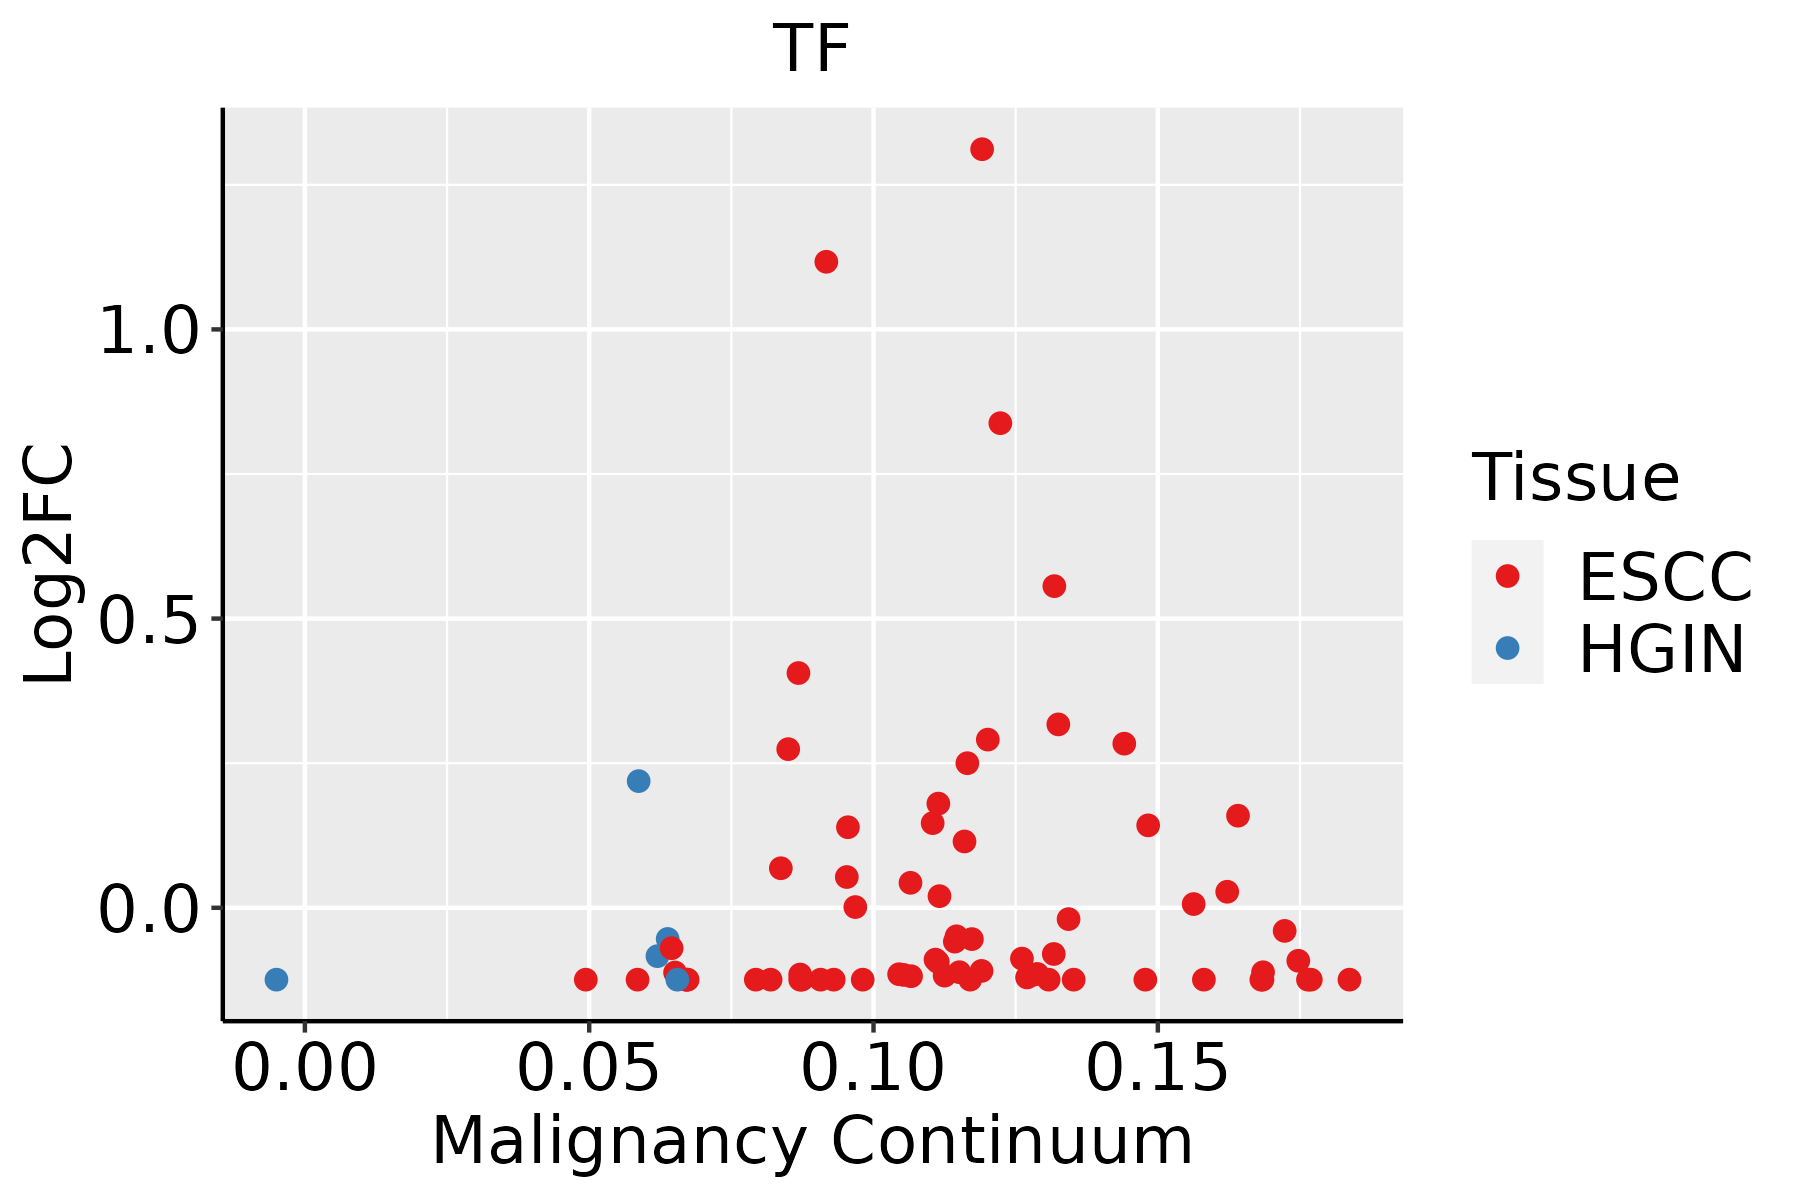 | ESCC: Esophageal squamous cell carcinoma |
| HGIN: High-grade intraepithelial neoplasias | ||
| LGIN: Low-grade intraepithelial neoplasias | ||
| Liver | 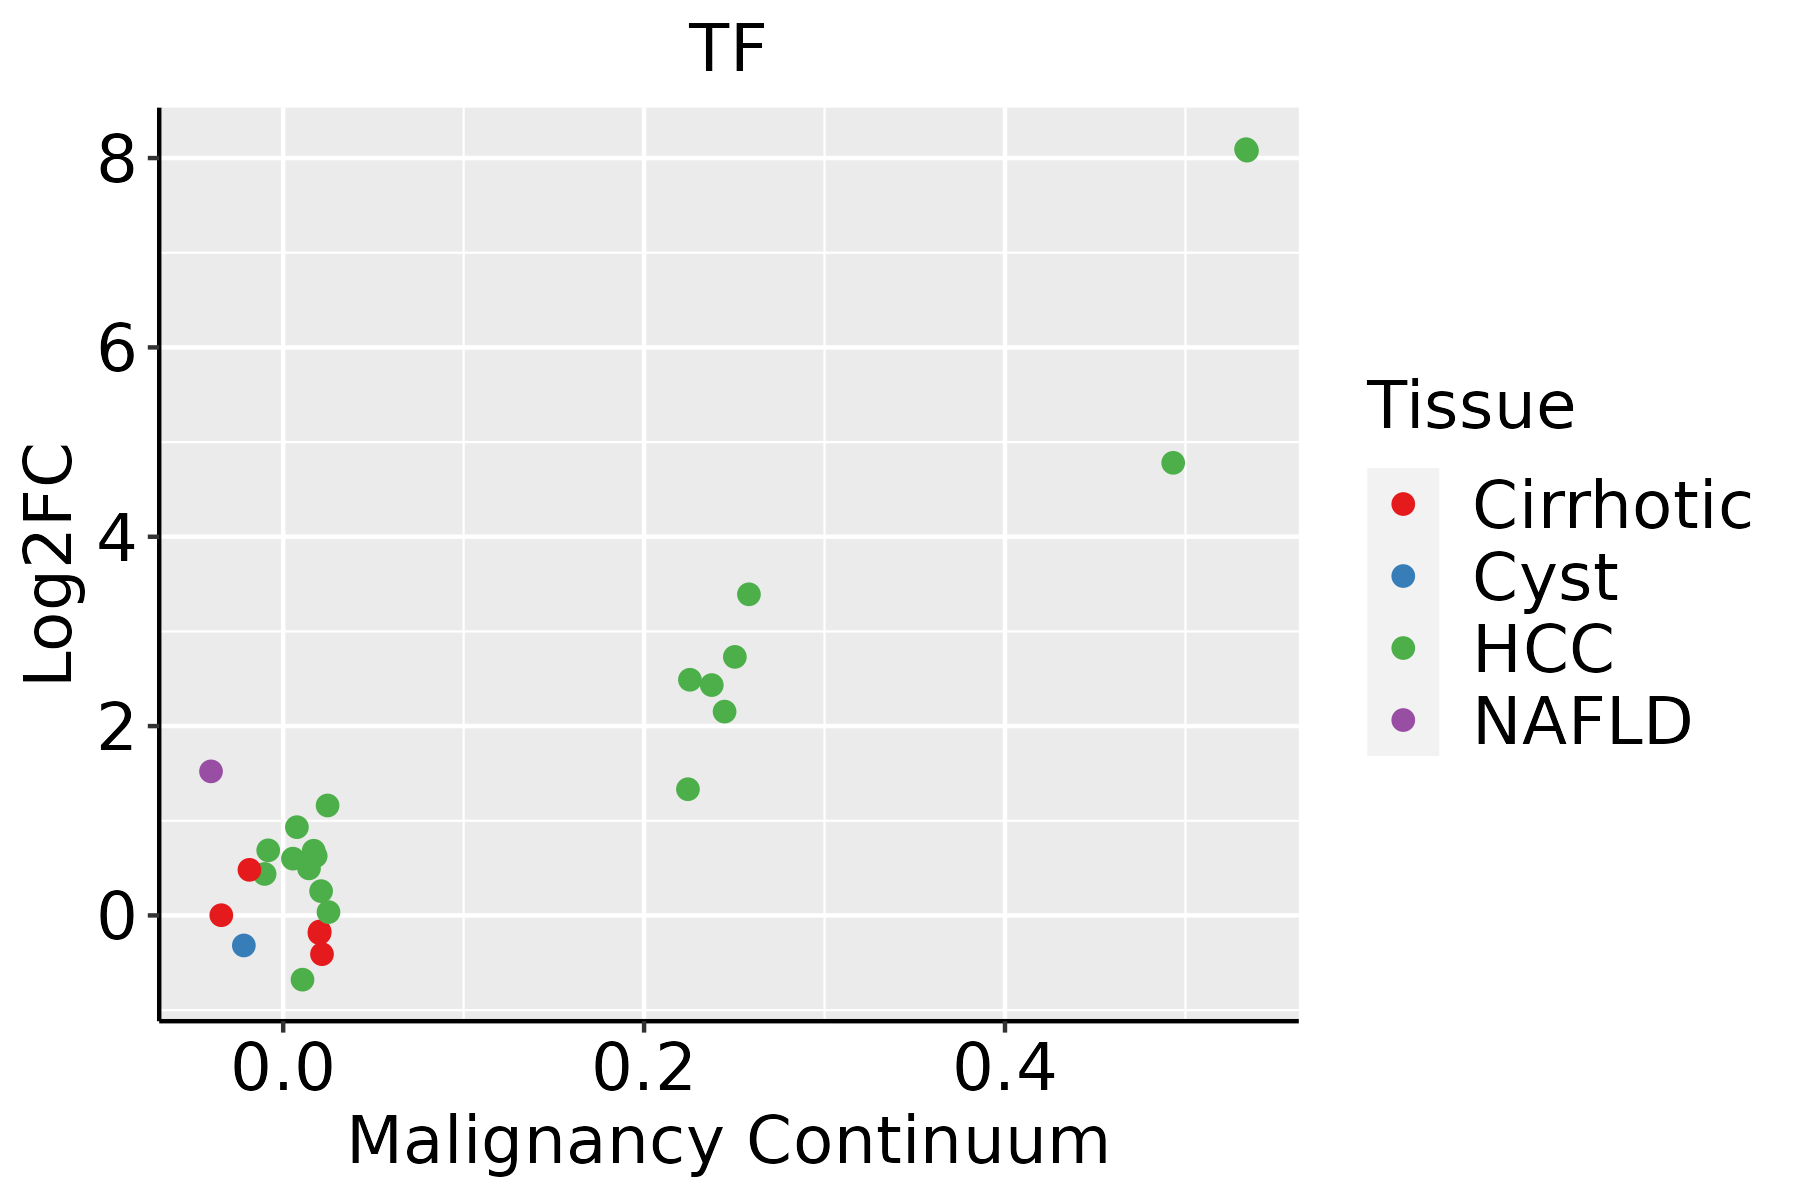 | HCC: Hepatocellular carcinoma |
| NAFLD: Non-alcoholic fatty liver disease | ||
| Oral Cavity |  | EOLP: Erosive Oral lichen planus |
| LP: leukoplakia | ||
| NEOLP: Non-erosive oral lichen planus | ||
| OSCC: Oral squamous cell carcinoma |
| ∗log2FC in expression of this searched gene in stem-like cells from each diseased tissue sample relative to stem-like cells in normal samples in each tissue plotted against the malignancy continuum. Samples are colored based on if they are from different disease stage. |
Top |
Malignant transformation related pathway analysis |
| Find out the enriched GO biological processes and KEGG pathways involved in transition from healthy to precancer to cancer |
| Tissue | Disease Stage | Enriched GO biological Processes |
| Colorectum | AD |  |
| Colorectum | SER |  |
| Colorectum | MSS |  |
| Colorectum | MSI-H |  |
| Colorectum | FAP |  |
| ∗Top 15 enriched GO BP terms are showed in the bar plot of each disease state in each tissue. Each row represents a significant GO biological process which is colored according to the -log10(p.adjust). |
| Page: 1 2 3 4 5 6 7 8 9 |
| GO ID | Tissue | Disease Stage | Description | Gene Ratio | Bg Ratio | pvalue | p.adjust | Count |
| GO:00514024 | Colorectum | FAP | neuron apoptotic process | 55/2622 | 246/18723 | 2.42e-04 | 3.37e-03 | 55 |
| GO:00018923 | Colorectum | FAP | embryonic placenta development | 24/2622 | 82/18723 | 2.55e-04 | 3.51e-03 | 24 |
| GO:00723293 | Colorectum | FAP | monocarboxylic acid catabolic process | 32/2622 | 122/18723 | 2.57e-04 | 3.53e-03 | 32 |
| GO:01501041 | Colorectum | FAP | transport across blood-brain barrier | 25/2622 | 87/18723 | 2.63e-04 | 3.59e-03 | 25 |
| GO:00521264 | Colorectum | FAP | movement in host environment | 42/2622 | 175/18723 | 2.64e-04 | 3.60e-03 | 42 |
| GO:00425943 | Colorectum | FAP | response to starvation | 46/2622 | 197/18723 | 2.72e-04 | 3.64e-03 | 46 |
| GO:00442422 | Colorectum | FAP | cellular lipid catabolic process | 49/2622 | 214/18723 | 2.87e-04 | 3.77e-03 | 49 |
| GO:00517014 | Colorectum | FAP | biological process involved in interaction with host | 47/2622 | 203/18723 | 2.89e-04 | 3.77e-03 | 47 |
| GO:00102321 | Colorectum | FAP | vascular transport | 25/2622 | 88/18723 | 3.19e-04 | 4.12e-03 | 25 |
| GO:00442823 | Colorectum | FAP | small molecule catabolic process | 77/2622 | 376/18723 | 3.25e-04 | 4.16e-03 | 77 |
| GO:00092673 | Colorectum | FAP | cellular response to starvation | 38/2622 | 156/18723 | 3.70e-04 | 4.63e-03 | 38 |
| GO:19012144 | Colorectum | FAP | regulation of neuron death | 67/2622 | 319/18723 | 3.73e-04 | 4.63e-03 | 67 |
| GO:19004074 | Colorectum | FAP | regulation of cellular response to oxidative stress | 25/2622 | 89/18723 | 3.85e-04 | 4.74e-03 | 25 |
| GO:00614583 | Colorectum | FAP | reproductive system development | 85/2622 | 427/18723 | 4.30e-04 | 5.13e-03 | 85 |
| GO:00016493 | Colorectum | FAP | osteoblast differentiation | 51/2622 | 229/18723 | 4.40e-04 | 5.22e-03 | 51 |
| GO:00030122 | Colorectum | FAP | muscle system process | 89/2622 | 452/18723 | 4.63e-04 | 5.39e-03 | 89 |
| GO:00364734 | Colorectum | FAP | cell death in response to oxidative stress | 26/2622 | 95/18723 | 4.63e-04 | 5.39e-03 | 26 |
| GO:00486083 | Colorectum | FAP | reproductive structure development | 84/2622 | 424/18723 | 5.40e-04 | 6.10e-03 | 84 |
| GO:19900904 | Colorectum | FAP | cellular response to nerve growth factor stimulus | 17/2622 | 53/18723 | 6.20e-04 | 6.82e-03 | 17 |
| GO:00108213 | Colorectum | FAP | regulation of mitochondrion organization | 35/2622 | 144/18723 | 6.44e-04 | 7.05e-03 | 35 |
| Pathway ID | Tissue | Disease Stage | Description | Gene Ratio | Bg Ratio | pvalue | p.adjust | qvalue | Count |
| hsa0406629 | Esophagus | ESCC | HIF-1 signaling pathway | 75/4205 | 109/8465 | 3.66e-05 | 1.68e-04 | 8.60e-05 | 75 |
| hsa043507 | Esophagus | ESCC | TGF-beta signaling pathway | 69/4205 | 108/8465 | 1.92e-03 | 5.54e-03 | 2.84e-03 | 69 |
| hsa04066113 | Esophagus | ESCC | HIF-1 signaling pathway | 75/4205 | 109/8465 | 3.66e-05 | 1.68e-04 | 8.60e-05 | 75 |
| hsa0435014 | Esophagus | ESCC | TGF-beta signaling pathway | 69/4205 | 108/8465 | 1.92e-03 | 5.54e-03 | 2.84e-03 | 69 |
| hsa0421621 | Liver | Cirrhotic | Ferroptosis | 23/2530 | 41/8465 | 4.09e-04 | 2.57e-03 | 1.58e-03 | 23 |
| hsa0406612 | Liver | Cirrhotic | HIF-1 signaling pathway | 46/2530 | 109/8465 | 4.00e-03 | 1.59e-02 | 9.78e-03 | 46 |
| hsa0421631 | Liver | Cirrhotic | Ferroptosis | 23/2530 | 41/8465 | 4.09e-04 | 2.57e-03 | 1.58e-03 | 23 |
| hsa0406613 | Liver | Cirrhotic | HIF-1 signaling pathway | 46/2530 | 109/8465 | 4.00e-03 | 1.59e-02 | 9.78e-03 | 46 |
| hsa0421641 | Liver | HCC | Ferroptosis | 33/4020 | 41/8465 | 1.42e-05 | 9.88e-05 | 5.50e-05 | 33 |
| hsa0406622 | Liver | HCC | HIF-1 signaling pathway | 70/4020 | 109/8465 | 2.96e-04 | 1.36e-03 | 7.57e-04 | 70 |
| hsa0421651 | Liver | HCC | Ferroptosis | 33/4020 | 41/8465 | 1.42e-05 | 9.88e-05 | 5.50e-05 | 33 |
| hsa0406632 | Liver | HCC | HIF-1 signaling pathway | 70/4020 | 109/8465 | 2.96e-04 | 1.36e-03 | 7.57e-04 | 70 |
| Page: 1 |
Top |
Cell-cell communication analysis |
| Identification of potential cell-cell interactions between two cell types and their ligand-receptor pairs for different disease states |
| Ligand | Receptor | LRpair | Pathway | Tissue | Disease Stage |
| Page: 1 |
Top |
Single-cell gene regulatory network inference analysis |
| Find out the significant the regulons (TFs) and the target genes of each regulon across cell types for different disease states |
| TF | Cell Type | Tissue | Disease Stage | Target Gene | RSS | Regulon Activity |
| ∗The dot plots of a searched regulon are shown for all cell subpopulations in each disease state of each tissue based on the regulon specific score inferred using pySCENIC and by calculating the average expression. |
| Page: 1 |
Top |
Somatic mutation of malignant transformation related genes |
| Annotation of somatic variants for genes involved in malignant transformation |
| Hugo Symbol | Variant Class | Variant Classification | dbSNP RS | HGVSc | HGVSp | HGVSp Short | SWISSPROT | BIOTYPE | SIFT | PolyPhen | Tumor Sample Barcode | Tissue | Histology | Sex | Age | Stage | Therapy Types | Drugs | Outcome |
| TF | SNV | Missense_Mutation | c.1906N>T | p.Gly636Cys | p.G636C | P02787 | protein_coding | deleterious(0.01) | possibly_damaging(0.767) | TCGA-A2-A25A-01 | Breast | breast invasive carcinoma | Female | <65 | I/II | Unspecific | Cytoxan | SD | |
| TF | SNV | Missense_Mutation | novel | c.693N>T | p.Glu231Asp | p.E231D | P02787 | protein_coding | tolerated(0.09) | benign(0.138) | TCGA-AN-A046-01 | Breast | breast invasive carcinoma | Female | >=65 | I/II | Unknown | Unknown | SD |
| TF | SNV | Missense_Mutation | c.1009N>C | p.Glu337Gln | p.E337Q | P02787 | protein_coding | tolerated(0.24) | benign(0.03) | TCGA-AN-A0XW-01 | Breast | breast invasive carcinoma | Female | <65 | III/IV | Unknown | Unknown | SD | |
| TF | SNV | Missense_Mutation | c.1565N>C | p.Leu522Pro | p.L522P | P02787 | protein_coding | tolerated(0.35) | benign(0) | TCGA-AO-A128-01 | Breast | breast invasive carcinoma | Female | <65 | I/II | Chemotherapy | doxorubicin | SD | |
| TF | SNV | Missense_Mutation | novel | c.1816N>C | p.Val606Leu | p.V606L | P02787 | protein_coding | deleterious(0) | probably_damaging(0.979) | TCGA-B6-A0RG-01 | Breast | breast invasive carcinoma | Female | <65 | I/II | Unknown | Unknown | SD |
| TF | SNV | Missense_Mutation | novel | c.1073G>T | p.Cys358Phe | p.C358F | P02787 | protein_coding | deleterious(0.05) | benign(0.097) | TCGA-BH-A0BJ-01 | Breast | breast invasive carcinoma | Female | <65 | I/II | Chemotherapy | doxorubicin | SD |
| TF | SNV | Missense_Mutation | novel | c.161N>T | p.Pro54Leu | p.P54L | P02787 | protein_coding | tolerated(0.06) | possibly_damaging(0.843) | TCGA-BH-A0HF-01 | Breast | breast invasive carcinoma | Female | >=65 | I/II | Hormone Therapy | arimidex | SD |
| TF | SNV | Missense_Mutation | c.1907N>T | p.Gly636Val | p.G636V | P02787 | protein_coding | tolerated(0.05) | benign(0.375) | TCGA-BH-A18G-01 | Breast | breast invasive carcinoma | Female | >=65 | I/II | Unknown | Unknown | SD | |
| TF | SNV | Missense_Mutation | c.493C>G | p.Leu165Val | p.L165V | P02787 | protein_coding | tolerated(0.45) | benign(0.035) | TCGA-EW-A1J5-01 | Breast | breast invasive carcinoma | Female | <65 | I/II | Chemotherapy | adriamycin | SD | |
| TF | insertion | Frame_Shift_Ins | novel | c.2011_2012insCCTCTGGGGGAACAACCACTCA | p.Gly671AlafsTer17 | p.G671Afs*17 | P02787 | protein_coding | TCGA-A8-A07Z-01 | Breast | breast invasive carcinoma | Female | >=65 | I/II | Unspecific | Exemestane | SD |
| Page: 1 2 3 4 5 6 7 8 9 10 11 12 13 |
Top |
Related drugs of malignant transformation related genes |
| Identification of chemicals and drugs interact with genes involved in malignant transfromation |
| (DGIdb 4.0) |
| Entrez ID | Symbol | Category | Interaction Types | Drug Claim Name | Drug Name | PMIDs |
| 7018 | TF | CELL SURFACE, DRUGGABLE GENOME | adalimumab | ADALIMUMAB | 27115882 | |
| 7018 | TF | CELL SURFACE, DRUGGABLE GENOME | Ademetionine | ADEMETIONINE | ||
| 7018 | TF | CELL SURFACE, DRUGGABLE GENOME | CALAA-01 | |||
| 7018 | TF | CELL SURFACE, DRUGGABLE GENOME | PF-06763809 | |||
| 7018 | TF | CELL SURFACE, DRUGGABLE GENOME | EP-2167 |
| Page: 1 |

Copyright 2023-Present -The University of Texas Health Science Center at Houston |