Schematic overview of the cellular and molecular mechanisms involved in the cancer progression, including the proposed cellular and molecular mechanisms in cancer cells trajectory. AT1: alveolar type 1 cells; AT2: alveolar type 2 cells; AAH: atypical adenomatous hyperplasia; AIS: adenocarcinoma in situ; MIA: minimally invasive adenocarcinoma; IA: invasive adenocarcinoma; EMT: epithelial-mesenchymal transition

Home

Download

Statistics

Help

Contact

Center for Computational Systems Medicine
leaf

Gene summary

leaf

Malignant transformation analysis

leaf

Malignant transformation related pathway analysis

leaf

Cell-cell communication analysis

leaf

Single-cell gene regulatory network inference analysis

leaf

Somatic mutation of malignant transformation related genes

leaf

Related drugs of malignant transformation related genes

Gene: DHX9

Gene summary for DHX9

check button Gene summary.

Gene informationSpeciesHuman
Gene symbol

DHX9

Gene ID

1660

Gene nameDExH-box helicase 9
Gene AliasDDX9
Cytomap1q25.3
Gene Typeprotein-coding
GO ID

GO:0000375

UniProtAcc

B3KU66


Top

Malignant transformation analysis

check button Identification of the aberrant gene expression in precancerous and cancerous lesions by comparing the gene expression of stem-like cells in diseased tissues with normal stem cells
check button Malignant transformation involving gene list.
Entrez IDSymbolReplicatesSpeciesOrganTissueAdj P-valueLog2FCMalignancy
1660DHX9HTA11_3410_2000001011HumanColorectumAD1.64e-02-3.07e-010.0155
1660DHX9HTA11_866_2000001011HumanColorectumAD1.16e-02-1.61e-01-0.1001
1660DHX9HTA11_99999970781_79442HumanColorectumMSS3.66e-095.75e-010.294
1660DHX9A015-C-203HumanColorectumFAP1.15e-17-2.52e-01-0.1294
1660DHX9A002-C-201HumanColorectumFAP7.88e-06-1.83e-010.0324
1660DHX9A002-C-203HumanColorectumFAP1.97e-02-1.28e-010.2786
1660DHX9A001-C-119HumanColorectumFAP6.00e-04-2.34e-01-0.1557
1660DHX9A001-C-108HumanColorectumFAP1.31e-11-2.87e-01-0.0272
1660DHX9A002-C-205HumanColorectumFAP5.84e-13-3.09e-01-0.1236
1660DHX9A015-C-006HumanColorectumFAP3.13e-08-2.44e-01-0.0994
1660DHX9A015-C-106HumanColorectumFAP1.14e-09-2.12e-01-0.0511
1660DHX9A002-C-114HumanColorectumFAP5.45e-11-3.06e-01-0.1561
1660DHX9A015-C-104HumanColorectumFAP5.70e-20-2.89e-01-0.1899
1660DHX9A001-C-014HumanColorectumFAP7.68e-09-2.11e-010.0135
1660DHX9A002-C-016HumanColorectumFAP1.61e-11-2.49e-010.0521
1660DHX9A015-C-002HumanColorectumFAP1.70e-06-2.55e-01-0.0763
1660DHX9A001-C-203HumanColorectumFAP3.43e-05-1.48e-01-0.0481
1660DHX9A002-C-116HumanColorectumFAP2.34e-22-3.38e-01-0.0452
1660DHX9A014-C-008HumanColorectumFAP2.02e-07-2.25e-01-0.191
1660DHX9A018-E-020HumanColorectumFAP1.19e-10-3.19e-01-0.2034
Page: 1 2 3 4 5 6 7 8 9 10 

check button Transcriptomic changes along malignancy continuum.
TissueExpression DynamicsAbbreviation
Colorectum (GSE201348)The image shows the transcriptomic changes along malignancy continuum.log2FC in expression of this searched gene in stem-like cells from each diseased tissue sample relative to stem-like cells in normal samples in each tissue plotted against the malignancy continuum. Samples are colored based on if they are from different disease stage.FAP: Familial adenomatous polyposis
CRC: Colorectal cancer
Colorectum (HTA11)The image shows the transcriptomic changes along malignancy continuum.log2FC in expression of this searched gene in stem-like cells from each diseased tissue sample relative to stem-like cells in normal samples in each tissue plotted against the malignancy continuum. Samples are colored based on if they are from different disease stage.AD: Adenomas
SER: Sessile serrated lesions
MSI-H: Microsatellite-high colorectal cancer
MSS: Microsatellite stable colorectal cancer
EsophagusThe image shows the transcriptomic changes along malignancy continuum.log2FC in expression of this searched gene in stem-like cells from each diseased tissue sample relative to stem-like cells in normal samples in each tissue plotted against the malignancy continuum. Samples are colored based on if they are from different disease stage.
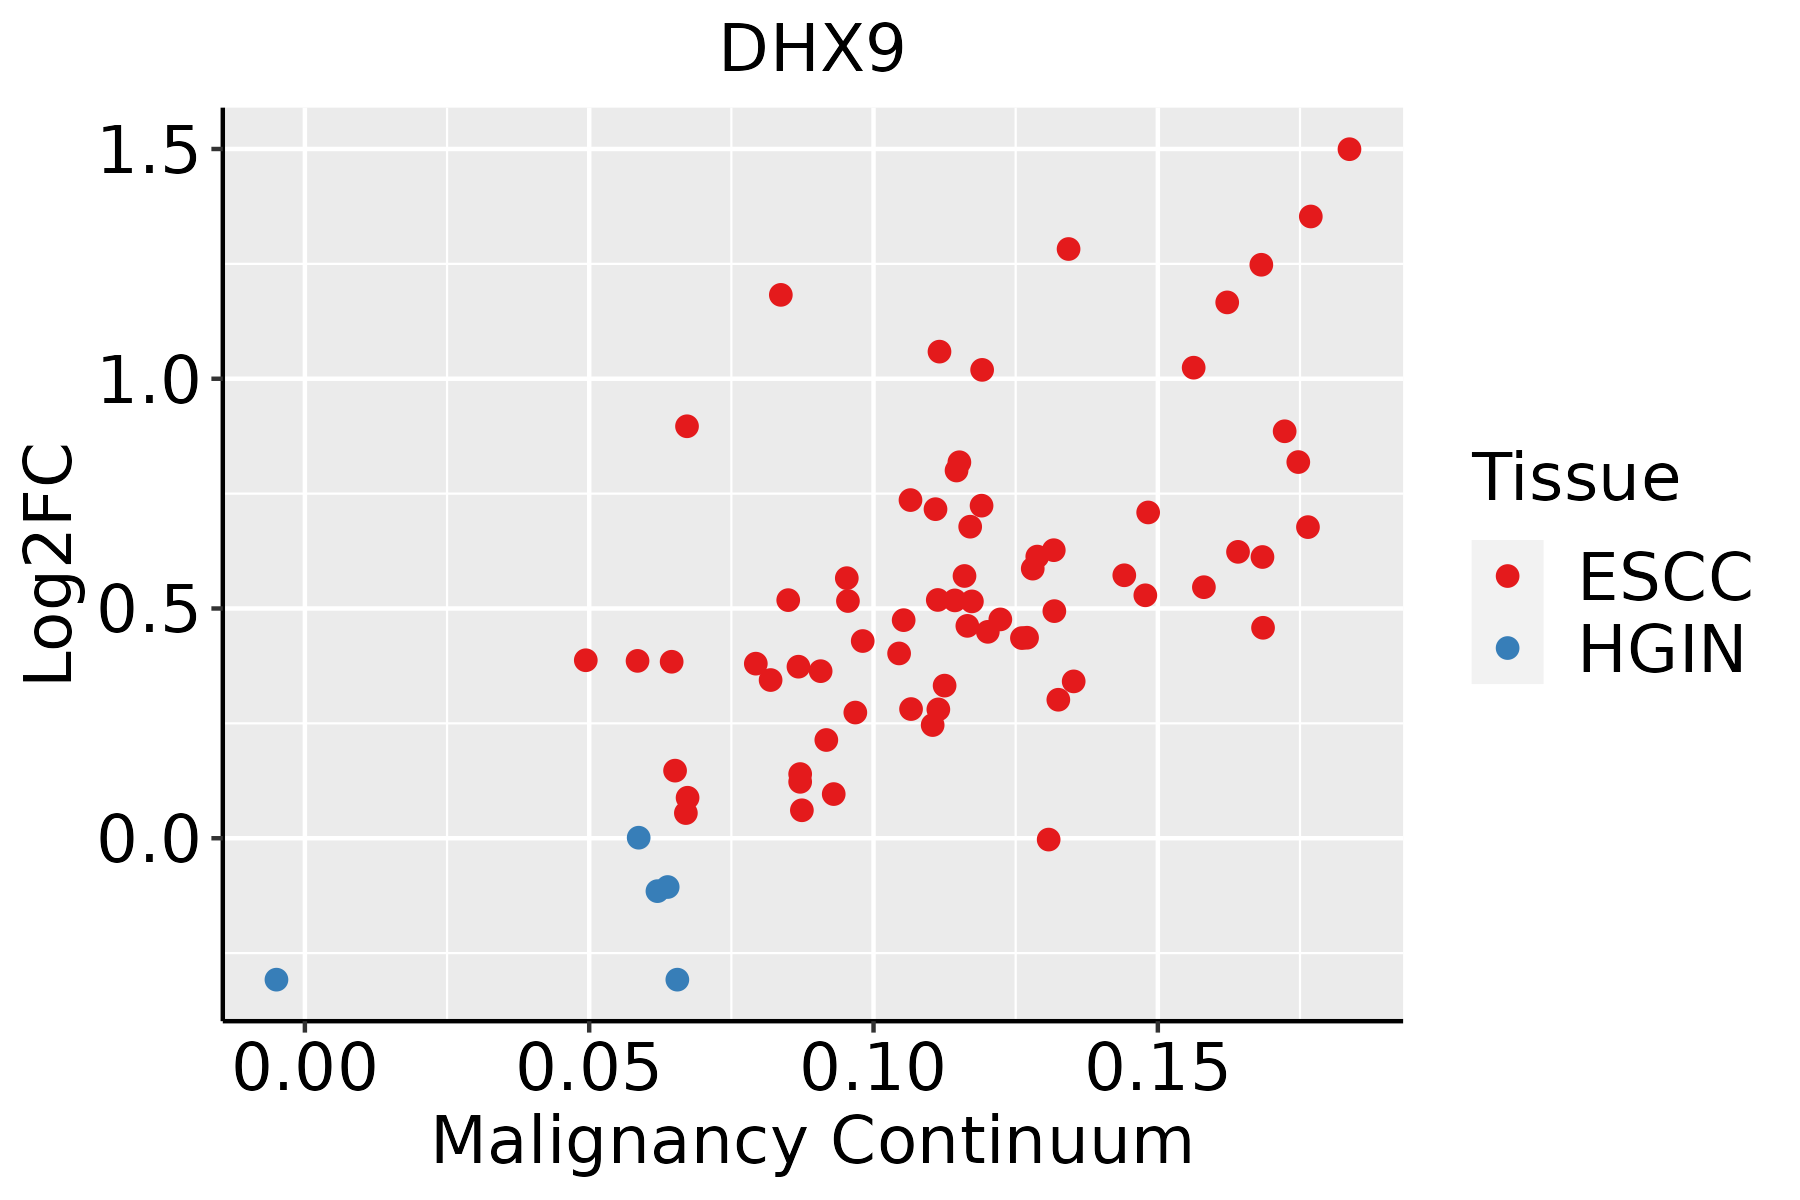
ESCC: Esophageal squamous cell carcinoma
HGIN: High-grade intraepithelial neoplasias
LGIN: Low-grade intraepithelial neoplasias
LiverThe image shows the transcriptomic changes along malignancy continuum.log2FC in expression of this searched gene in stem-like cells from each diseased tissue sample relative to stem-like cells in normal samples in each tissue plotted against the malignancy continuum. Samples are colored based on if they are from different disease stage.
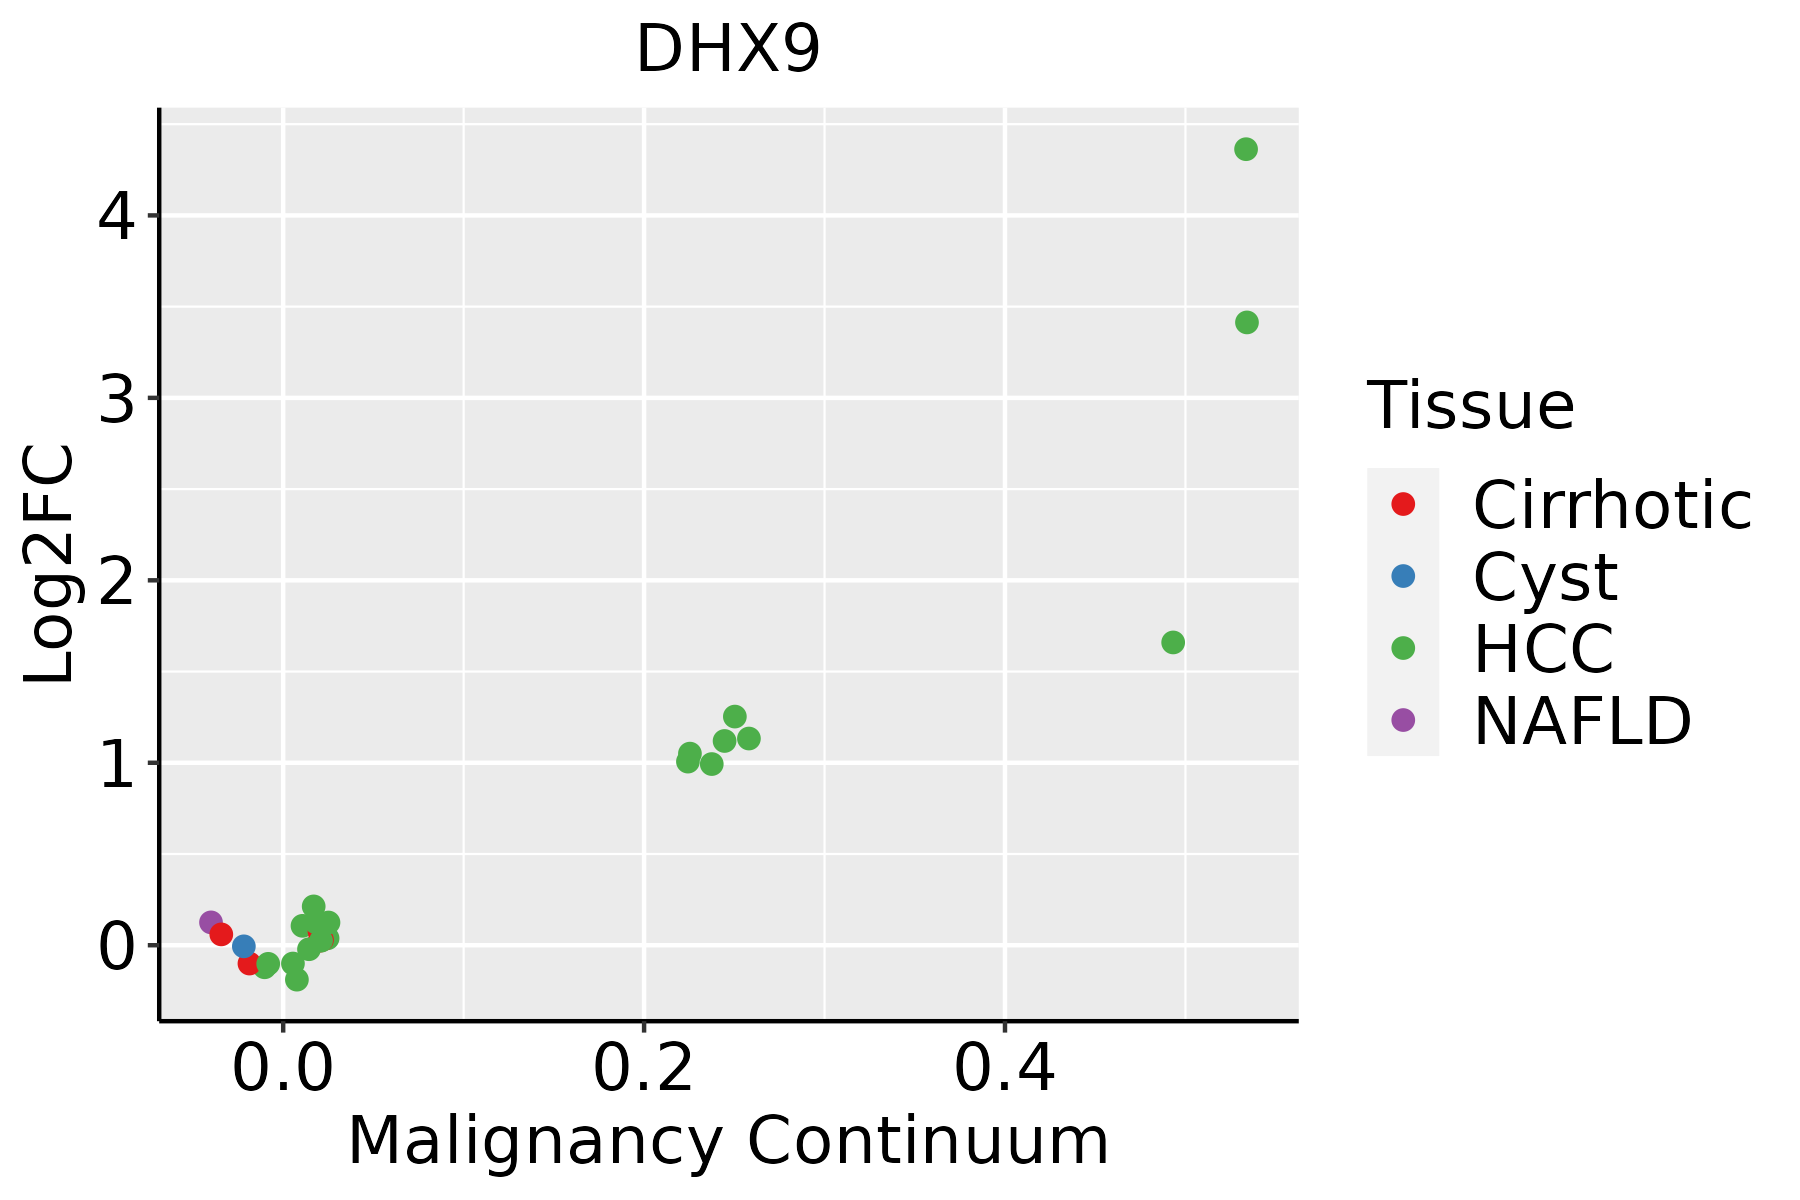
HCC: Hepatocellular carcinoma
NAFLD: Non-alcoholic fatty liver disease
LungThe image shows the transcriptomic changes along malignancy continuum.log2FC in expression of this searched gene in stem-like cells from each diseased tissue sample relative to stem-like cells in normal samples in each tissue plotted against the malignancy continuum. Samples are colored based on if they are from different disease stage.
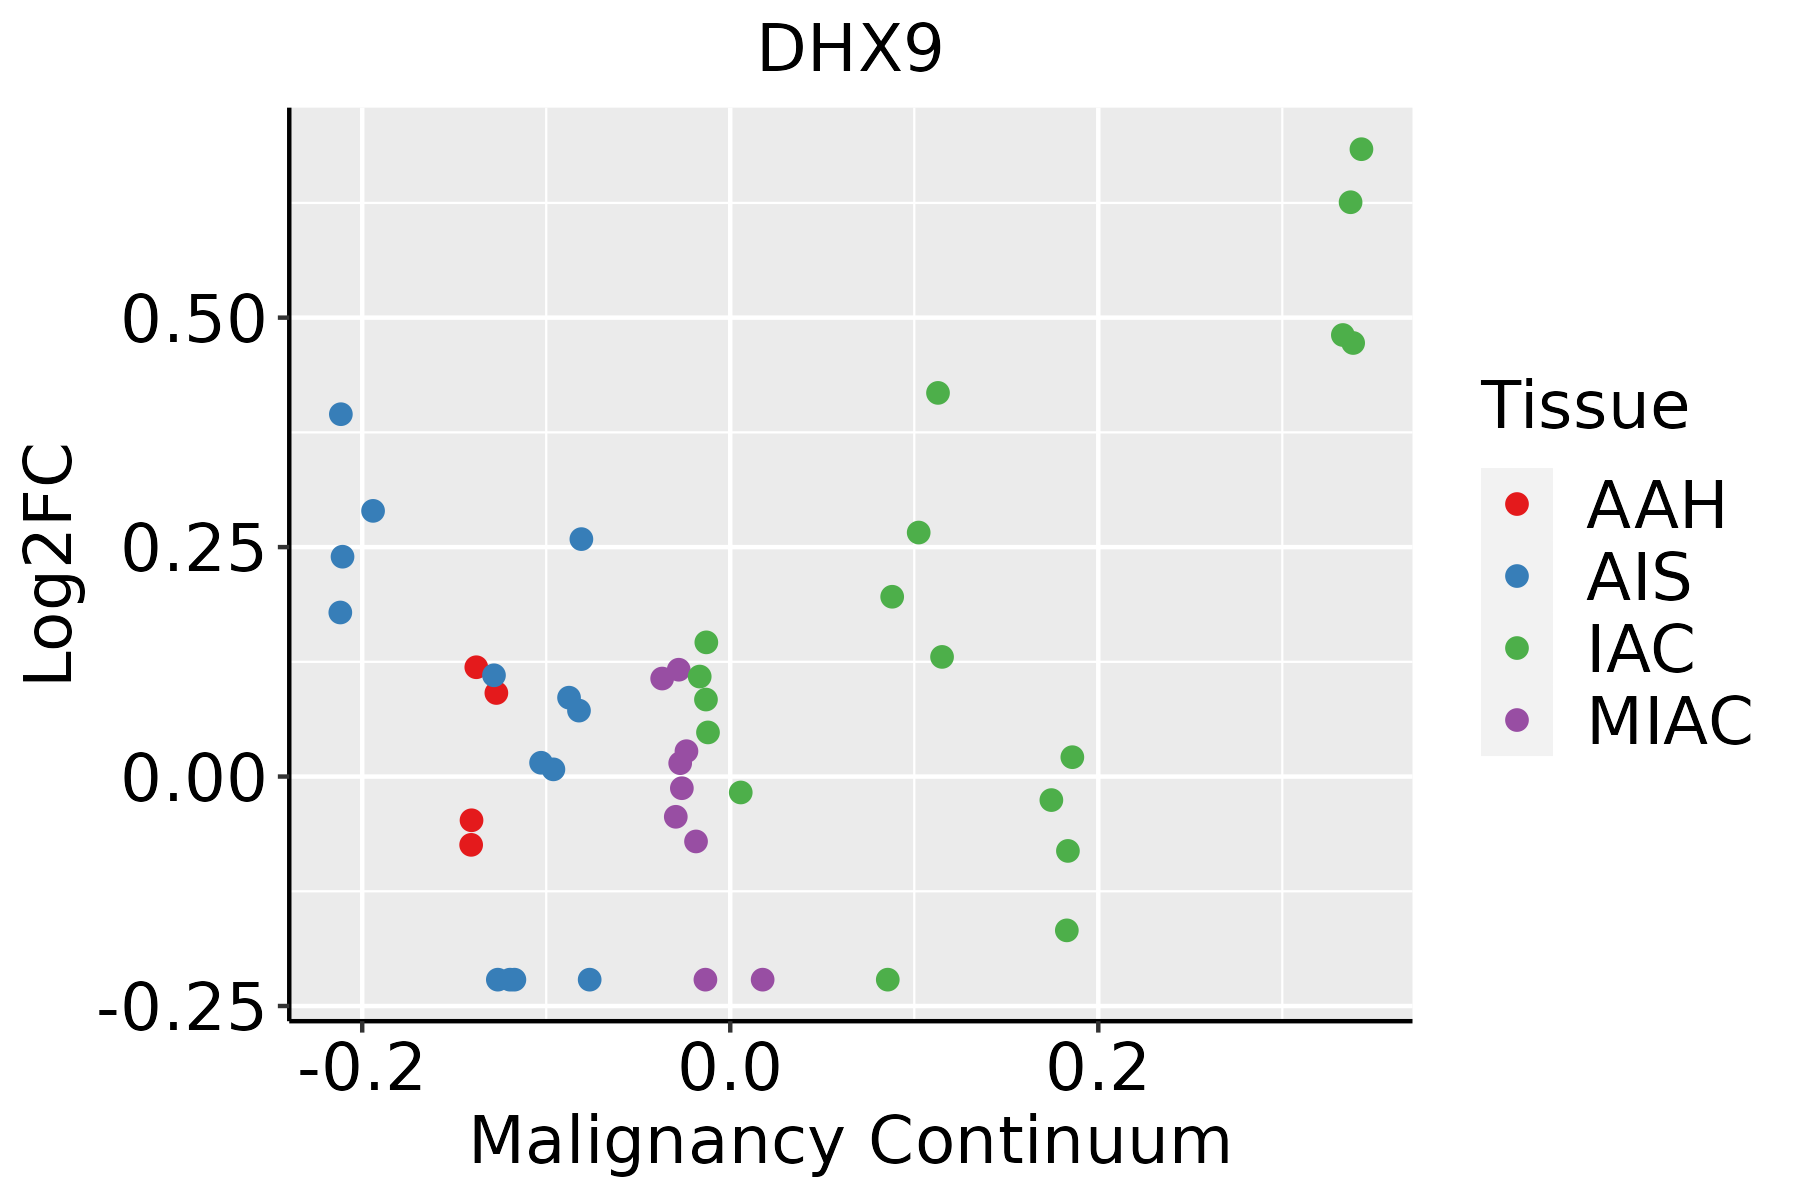
AAH: Atypical adenomatous hyperplasia
AIS: Adenocarcinoma in situ
IAC: Invasive lung adenocarcinoma
MIA: Minimally invasive adenocarcinoma
Oral CavityThe image shows the transcriptomic changes along malignancy continuum.log2FC in expression of this searched gene in stem-like cells from each diseased tissue sample relative to stem-like cells in normal samples in each tissue plotted against the malignancy continuum. Samples are colored based on if they are from different disease stage.EOLP: Erosive Oral lichen planus
LP: leukoplakia
NEOLP: Non-erosive oral lichen planus
OSCC: Oral squamous cell carcinoma
ProstateThe image shows the transcriptomic changes along malignancy continuum.log2FC in expression of this searched gene in stem-like cells from each diseased tissue sample relative to stem-like cells in normal samples in each tissue plotted against the malignancy continuum. Samples are colored based on if they are from different disease stage.
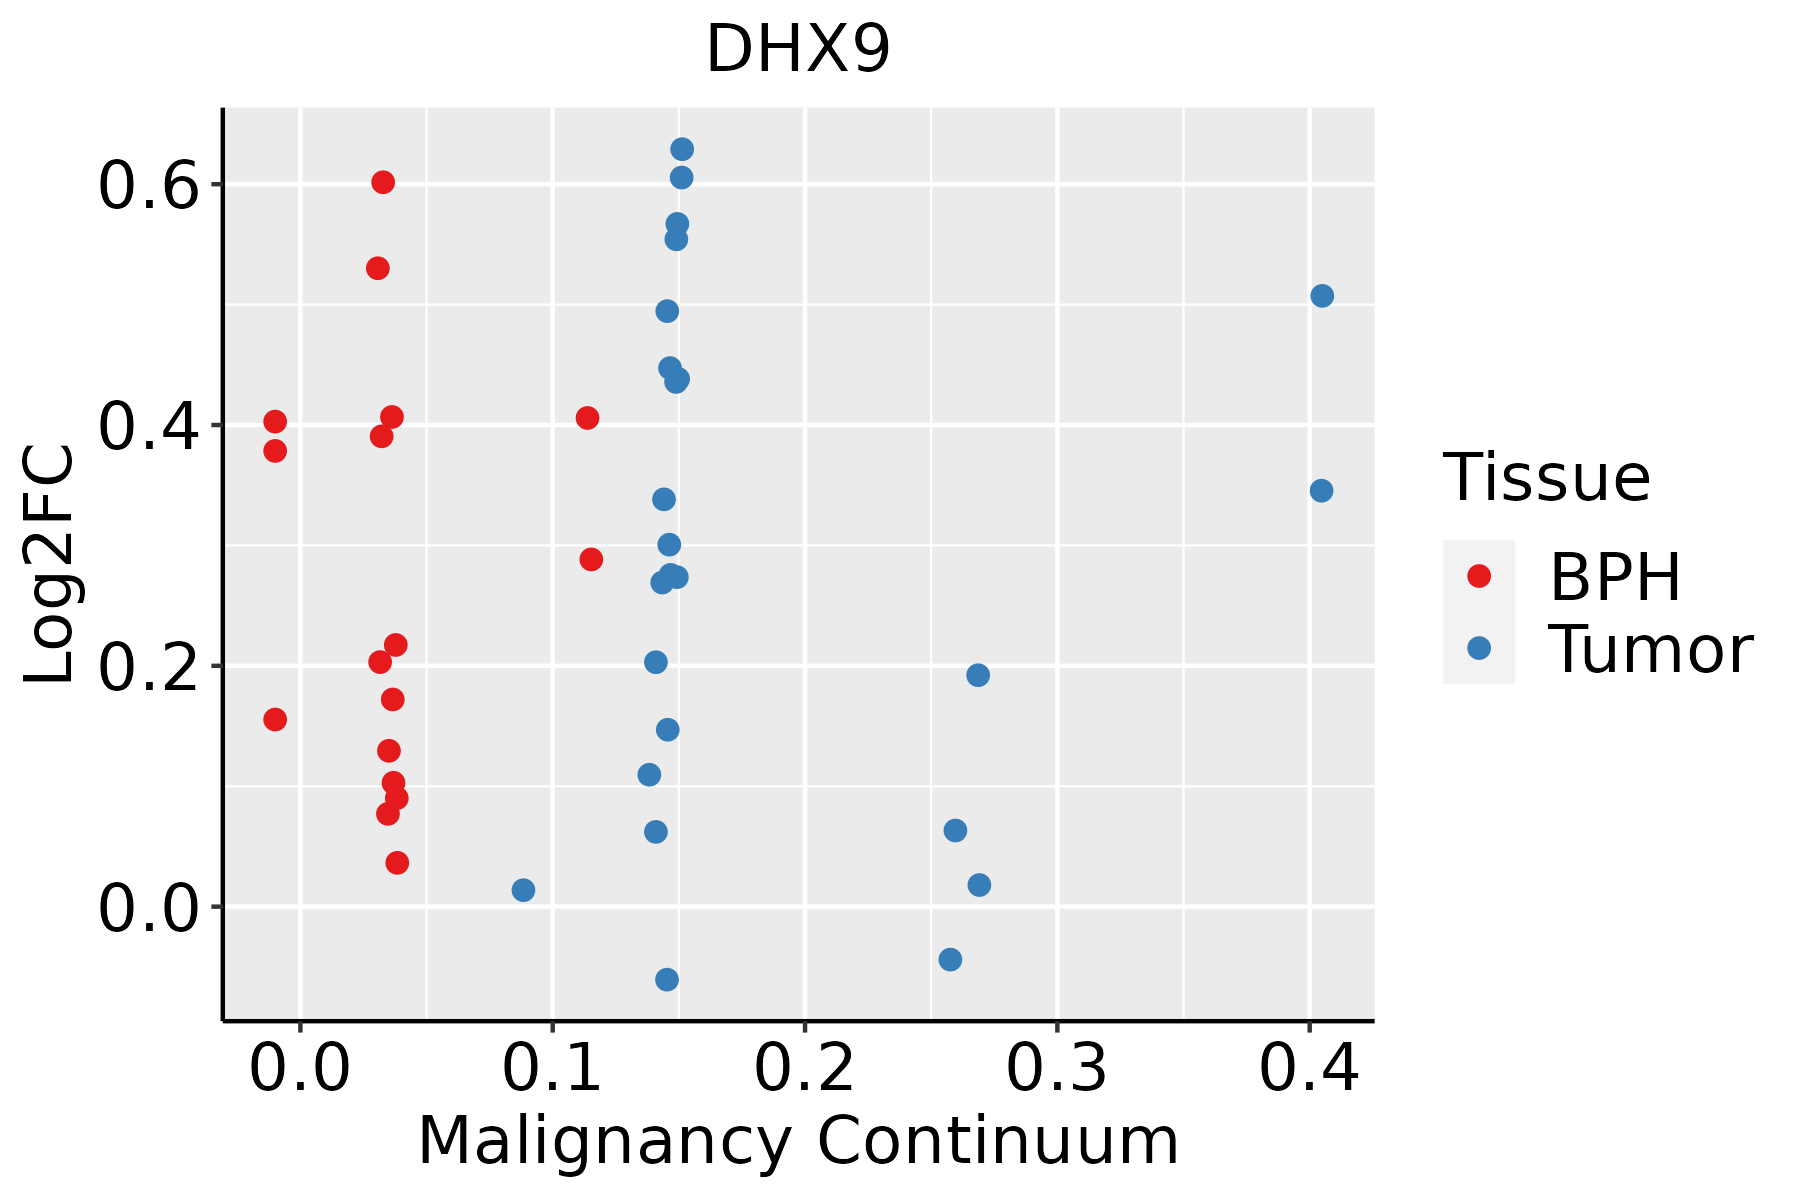
BPH: Benign Prostatic Hyperplasia
SkinThe image shows the transcriptomic changes along malignancy continuum.log2FC in expression of this searched gene in stem-like cells from each diseased tissue sample relative to stem-like cells in normal samples in each tissue plotted against the malignancy continuum. Samples are colored based on if they are from different disease stage.
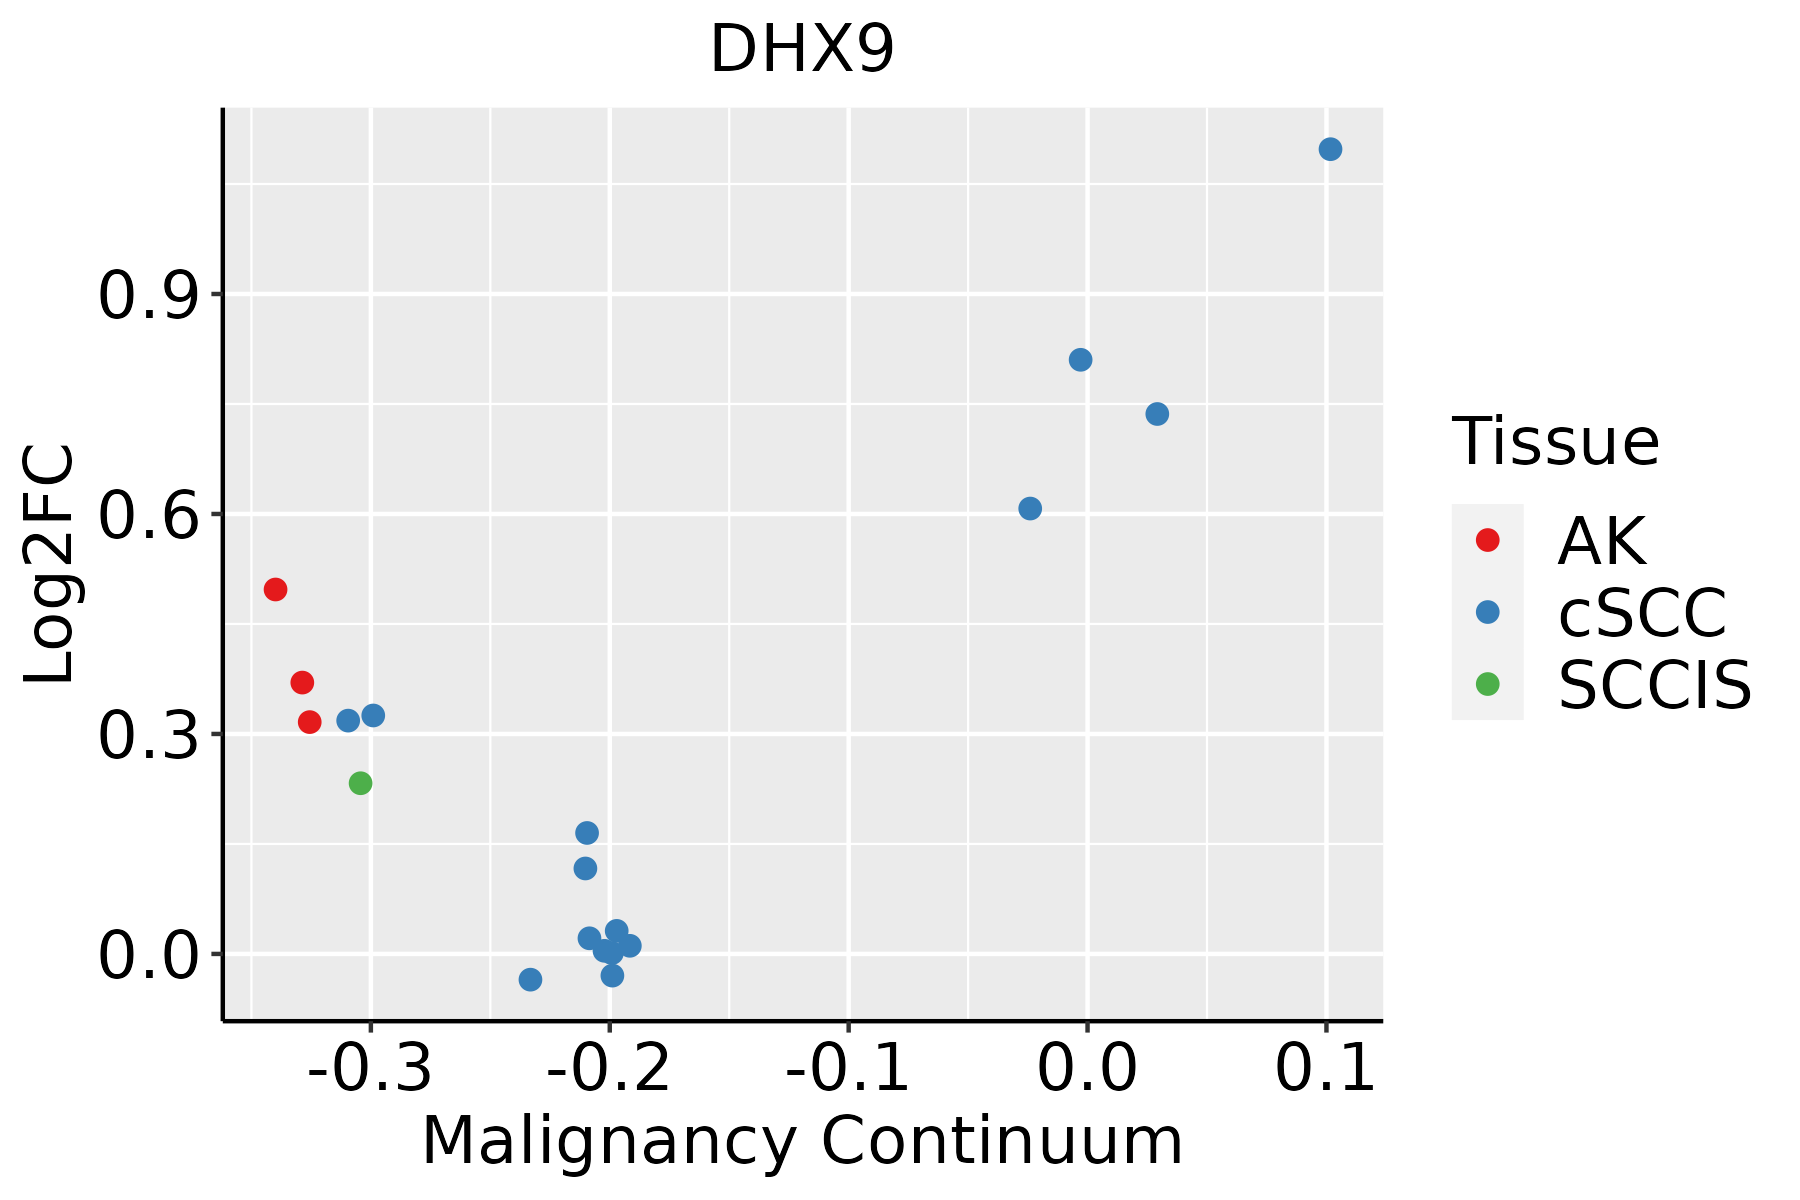
AK: Actinic keratosis
cSCC: Cutaneous squamous cell carcinoma
SCCIS:squamous cell carcinoma in situ
ThyroidThe image shows the transcriptomic changes along malignancy continuum.log2FC in expression of this searched gene in stem-like cells from each diseased tissue sample relative to stem-like cells in normal samples in each tissue plotted against the malignancy continuum. Samples are colored based on if they are from different disease stage.
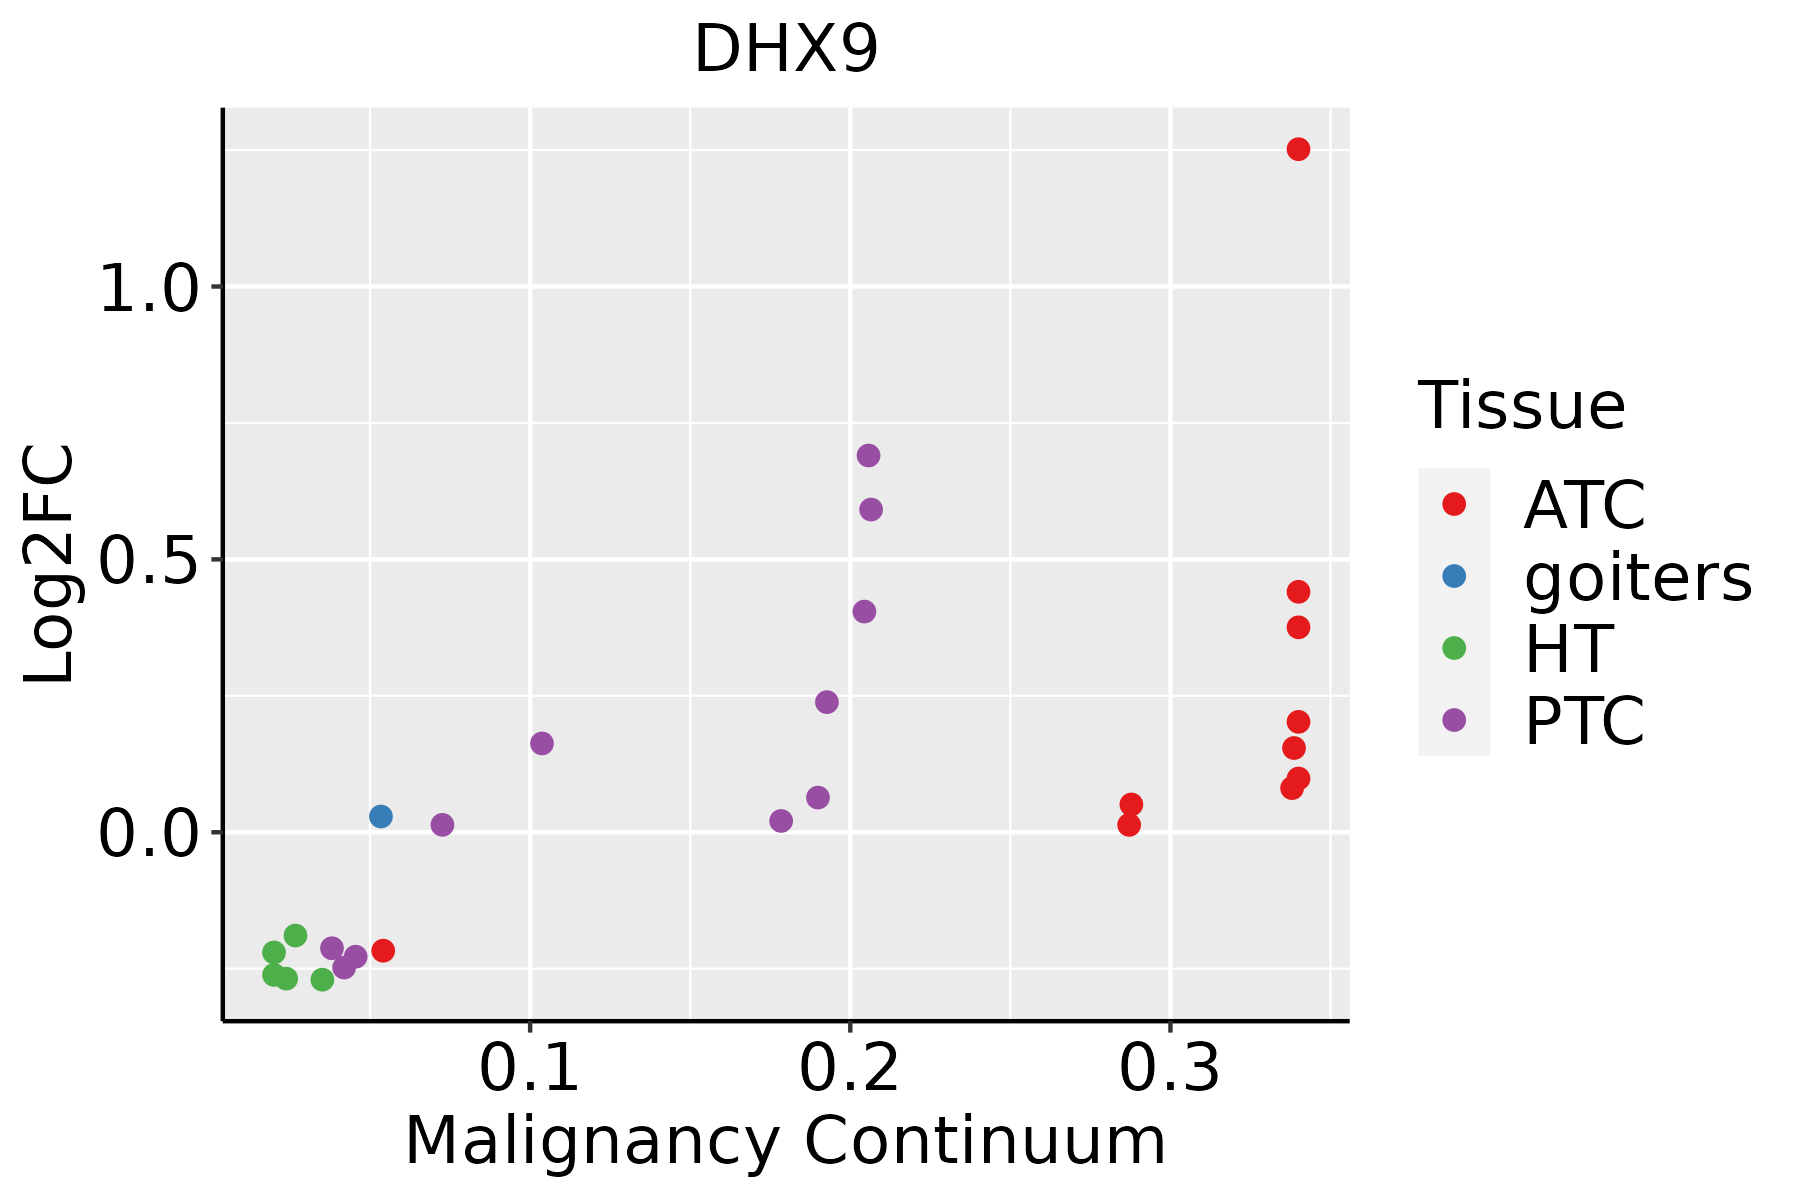
ATC: Anaplastic thyroid cancer
HT: Hashimoto's thyroiditis
PTC: Papillary thyroid cancer
∗log2FC in expression of this searched gene in stem-like cells from each diseased tissue sample relative to stem-like cells in normal samples in each tissue plotted against the malignancy continuum. Samples are colored based on if they are from different disease stage.

Top

Malignant transformation related pathway analysis

check buttonFind out the enriched GO biological processes and KEGG pathways involved in transition from healthy to precancer to cancer
check button Figure of enriched GO biological processes.
TissueDisease StageEnriched GO biological Processes
ColorectumADGO analysis - Figure of enriched GO biological processes: Top 15 enriched GO BP terms are showed in the bar plot of each disease state in each tissue. Each row represents a significant GO biological process which is colored according to the -log10(p.adjust).
ColorectumSERGO analysis - Figure of enriched GO biological processes: Top 15 enriched GO BP terms are showed in the bar plot of each disease state in each tissue. Each row represents a significant GO biological process which is colored according to the -log10(p.adjust).
ColorectumMSSGO analysis - Figure of enriched GO biological processes: Top 15 enriched GO BP terms are showed in the bar plot of each disease state in each tissue. Each row represents a significant GO biological process which is colored according to the -log10(p.adjust).
ColorectumMSI-HGO analysis - Figure of enriched GO biological processes: Top 15 enriched GO BP terms are showed in the bar plot of each disease state in each tissue. Each row represents a significant GO biological process which is colored according to the -log10(p.adjust).
ColorectumFAPGO analysis - Figure of enriched GO biological processes: Top 15 enriched GO BP terms are showed in the bar plot of each disease state in each tissue. Each row represents a significant GO biological process which is colored according to the -log10(p.adjust).
∗Top 15 enriched GO BP terms are showed in the bar plot of each disease state in each tissue. Each row represents a significant GO biological process which is colored according to the -log10(p.adjust).
Page: 1 2 3 4 5 6 7 8 9 

check button Enriched GO biological processes.
GO IDTissueDisease StageDescriptionGene RatioBg Ratiopvaluep.adjustCount
GO:20006379ThyroidHTpositive regulation of gene silencing by miRNA7/127230/187233.35e-032.60e-027
GO:004427024ThyroidHTcellular nitrogen compound catabolic process46/1272451/187233.83e-032.84e-0246
GO:00601489ThyroidHTpositive regulation of posttranscriptional gene silencing7/127231/187234.08e-032.99e-027
GO:00028334ThyroidHTpositive regulation of response to biotic stimulus21/1272168/187234.98e-033.36e-0221
GO:00467823ThyroidHTregulation of viral transcription5/127219/187237.48e-034.44e-025
GO:0022613113ThyroidPTCribonucleoprotein complex biogenesis292/5968463/187233.24e-442.05e-40292
GO:0008380113ThyroidPTCRNA splicing273/5968434/187234.44e-411.40e-37273
GO:0002181113ThyroidPTCcytoplasmic translation121/5968148/187234.32e-364.54e-33121
GO:0000375113ThyroidPTCRNA splicing, via transesterification reactions202/5968324/187236.81e-303.91e-27202
GO:0000377113ThyroidPTCRNA splicing, via transesterification reactions with bulged adenosine as nucleophile199/5968320/187232.96e-291.44e-26199
GO:0000398113ThyroidPTCmRNA splicing, via spliceosome199/5968320/187232.96e-291.44e-26199
GO:1903311112ThyroidPTCregulation of mRNA metabolic process181/5968288/187231.60e-275.94e-25181
GO:0032386111ThyroidPTCregulation of intracellular transport202/5968337/187231.12e-263.93e-24202
GO:0016032113ThyroidPTCviral process236/5968415/187232.48e-268.24e-24236
GO:0006913112ThyroidPTCnucleocytoplasmic transport181/5968301/187232.93e-247.69e-22181
GO:0051169112ThyroidPTCnuclear transport181/5968301/187232.93e-247.69e-22181
GO:0032388112ThyroidPTCpositive regulation of intracellular transport132/5968202/187231.10e-222.57e-20132
GO:0006403112ThyroidPTCRNA localization130/5968201/187239.23e-221.94e-19130
GO:0050684112ThyroidPTCregulation of mRNA processing98/5968137/187231.53e-213.10e-1998
GO:0006401112ThyroidPTCRNA catabolic process163/5968278/187232.13e-203.27e-18163
Page: 1 2 3 4 5 6 7 8 9 10 11 12 13 14 15 16 17 18 19 20 21 22 23 24 25 26 27 28 29 30 31 32 33 34 35 36 37 38 39 40 41 42 43 44 45 46 47 48 49 50 51 52 53 54 55 56 57 58 59 60 61 62 63 64 65 66 67 68 69 70 71 72 73 74 75 76 77 78 79 80 81 82 83 

check button Enriched KEGG pathways.
Pathway IDTissueDisease StageDescriptionGene RatioBg Ratiopvaluep.adjustqvalueCount
Page: 1 

Top

Cell-cell communication analysis

check buttonIdentification of potential cell-cell interactions between two cell types and their ligand-receptor pairs for different disease states
LigandReceptorLRpairPathwayTissueDisease Stage
Page: 1 

Top

Single-cell gene regulatory network inference analysis

check buttonFind out the significant the regulons (TFs) and the target genes of each regulon across cell types for different disease states
TFCell TypeTissueDisease StageTarget GeneRSSRegulon Activity
∗The dot plots of a searched regulon are shown for all cell subpopulations in each disease state of each tissue based on the regulon specific score inferred using pySCENIC and by calculating the average expression.
Page: 1 

Top

Somatic mutation of malignant transformation related genes

check buttonAnnotation of somatic variants for genes involved in malignant transformation
Hugo SymbolVariant ClassVariant ClassificationdbSNP RSHGVScHGVSpHGVSp ShortSWISSPROTBIOTYPESIFTPolyPhenTumor Sample BarcodeTissueHistologySexAgeStageTherapy TypesDrugsOutcome
DHX9SNVMissense_Mutationnovelc.1531N>Tp.Asp511Tyrp.D511YQ08211protein_codingdeleterious(0)probably_damaging(1)TCGA-A7-A5ZW-01Breastbreast invasive carcinomaFemale<65I/IIChemotherapycyclophosphamideCR
DHX9SNVMissense_Mutationc.2173N>Tp.Val725Phep.V725FQ08211protein_codingdeleterious(0.04)probably_damaging(0.998)TCGA-A8-A09Z-01Breastbreast invasive carcinomaFemale>=65I/IIUnknownUnknownSD
DHX9SNVMissense_Mutationc.3280C>Tp.His1094Tyrp.H1094YQ08211protein_codingtolerated(1)benign(0.157)TCGA-AC-A23H-01Breastbreast invasive carcinomaFemale>=65I/IIUnknownUnknownPD
DHX9SNVMissense_Mutationc.2714G>Ap.Arg905Glnp.R905QQ08211protein_codingdeleterious(0.02)probably_damaging(0.984)TCGA-AN-A046-01Breastbreast invasive carcinomaFemale>=65I/IIUnknownUnknownSD
DHX9SNVMissense_Mutationnovelc.2202N>Cp.Gln734Hisp.Q734HQ08211protein_codingdeleterious(0)probably_damaging(0.95)TCGA-BH-A0B6-01Breastbreast invasive carcinomaFemale<65I/IIUnknownUnknownSD
DHX9SNVMissense_Mutationrs754675901c.1582C>Tp.Arg528Cysp.R528CQ08211protein_codingdeleterious(0)probably_damaging(1)TCGA-BH-A18G-01Breastbreast invasive carcinomaFemale>=65I/IIUnknownUnknownSD
DHX9SNVMissense_Mutationc.176G>Ap.Ser59Asnp.S59NQ08211protein_codingtolerated(0.22)benign(0.281)TCGA-BH-A1F0-01Breastbreast invasive carcinomaFemale>=65I/IIUnknownUnknownPD
DHX9SNVMissense_Mutationnovelc.929N>Gp.Leu310Argp.L310RQ08211protein_codingdeleterious(0.01)probably_damaging(0.97)TCGA-C8-A8HQ-01Breastbreast invasive carcinomaFemale<65I/IIUnknownUnknownSD
DHX9SNVMissense_Mutationc.2588G>Ap.Arg863Hisp.R863HQ08211protein_codingdeleterious(0.05)probably_damaging(0.993)TCGA-D8-A1JE-01Breastbreast invasive carcinomaFemale<65I/IIChemotherapyadriamicinSD
DHX9SNVMissense_Mutationc.67N>Gp.Ile23Valp.I23VQ08211protein_codingtolerated(0.92)benign(0.028)TCGA-E9-A1NI-01Breastbreast invasive carcinomaFemale<65I/IIChemotherapydoxorubicinCR
Page: 1 2 3 4 5 6 7 8 9 10 11 12 13 14 15 16 

Top

Related drugs of malignant transformation related genes

check buttonIdentification of chemicals and drugs interact with genes involved in malignant transfromation
(DGIdb 4.0)
Entrez IDSymbolCategoryInteraction TypesDrug Claim NameDrug NamePMIDs
Page: 1