
|
|||||
|
 | |
| |
| |
| |
| |
| |
|
Gene: VEGFA |
Gene summary for VEGFA |
| Gene information | Species | Human | Gene symbol | VEGFA | Gene ID | 7422 |
| Gene name | vascular endothelial growth factor A | |
| Gene Alias | MVCD1 | |
| Cytomap | 6p21.1 | |
| Gene Type | protein-coding | GO ID | GO:0000003 | UniProtAcc | A0A087WUD8 |
Top |
Malignant transformation analysis |
| Identification of the aberrant gene expression in precancerous and cancerous lesions by comparing the gene expression of stem-like cells in diseased tissues with normal stem cells |
| Entrez ID | Symbol | Replicates | Species | Organ | Tissue | Adj P-value | Log2FC | Malignancy |
| 7422 | VEGFA | GSM4909281 | Human | Breast | IDC | 5.30e-08 | 4.70e-01 | 0.21 |
| 7422 | VEGFA | GSM4909286 | Human | Breast | IDC | 4.66e-03 | -2.45e-01 | 0.1081 |
| 7422 | VEGFA | GSM4909294 | Human | Breast | IDC | 2.50e-02 | -2.41e-01 | 0.2022 |
| 7422 | VEGFA | GSM4909296 | Human | Breast | IDC | 1.34e-05 | -1.79e-01 | 0.1524 |
| 7422 | VEGFA | GSM4909297 | Human | Breast | IDC | 3.44e-09 | -2.82e-01 | 0.1517 |
| 7422 | VEGFA | GSM4909298 | Human | Breast | IDC | 1.98e-02 | -2.47e-01 | 0.1551 |
| 7422 | VEGFA | GSM4909311 | Human | Breast | IDC | 6.77e-14 | -2.78e-01 | 0.1534 |
| 7422 | VEGFA | GSM4909312 | Human | Breast | IDC | 5.10e-07 | -2.63e-01 | 0.1552 |
| 7422 | VEGFA | GSM4909313 | Human | Breast | IDC | 6.95e-05 | -2.88e-01 | 0.0391 |
| 7422 | VEGFA | GSM4909315 | Human | Breast | IDC | 1.34e-02 | 3.31e-01 | 0.21 |
| 7422 | VEGFA | GSM4909319 | Human | Breast | IDC | 1.44e-17 | -3.14e-01 | 0.1563 |
| 7422 | VEGFA | GSM4909320 | Human | Breast | IDC | 3.24e-02 | -6.03e-02 | 0.1575 |
| 7422 | VEGFA | GSM4909321 | Human | Breast | IDC | 3.53e-13 | -3.26e-01 | 0.1559 |
| 7422 | VEGFA | ctrl6 | Human | Breast | Precancer | 6.56e-15 | 7.40e-01 | -0.0061 |
| 7422 | VEGFA | brca1 | Human | Breast | Precancer | 2.78e-10 | -2.94e-01 | -0.0338 |
| 7422 | VEGFA | brca10 | Human | Breast | Precancer | 2.93e-33 | 8.67e-01 | -0.0029 |
| 7422 | VEGFA | NCCBC14 | Human | Breast | DCIS | 3.70e-04 | -9.47e-02 | 0.2021 |
| 7422 | VEGFA | NCCBC2 | Human | Breast | DCIS | 3.20e-02 | 2.72e-01 | 0.1554 |
| 7422 | VEGFA | NCCBC5 | Human | Breast | DCIS | 1.17e-03 | -5.01e-02 | 0.2046 |
| 7422 | VEGFA | P1 | Human | Breast | IDC | 2.33e-07 | -6.81e-02 | 0.1527 |
| Page: 1 2 3 4 5 6 7 8 9 |
| Tissue | Expression Dynamics | Abbreviation |
| Breast | 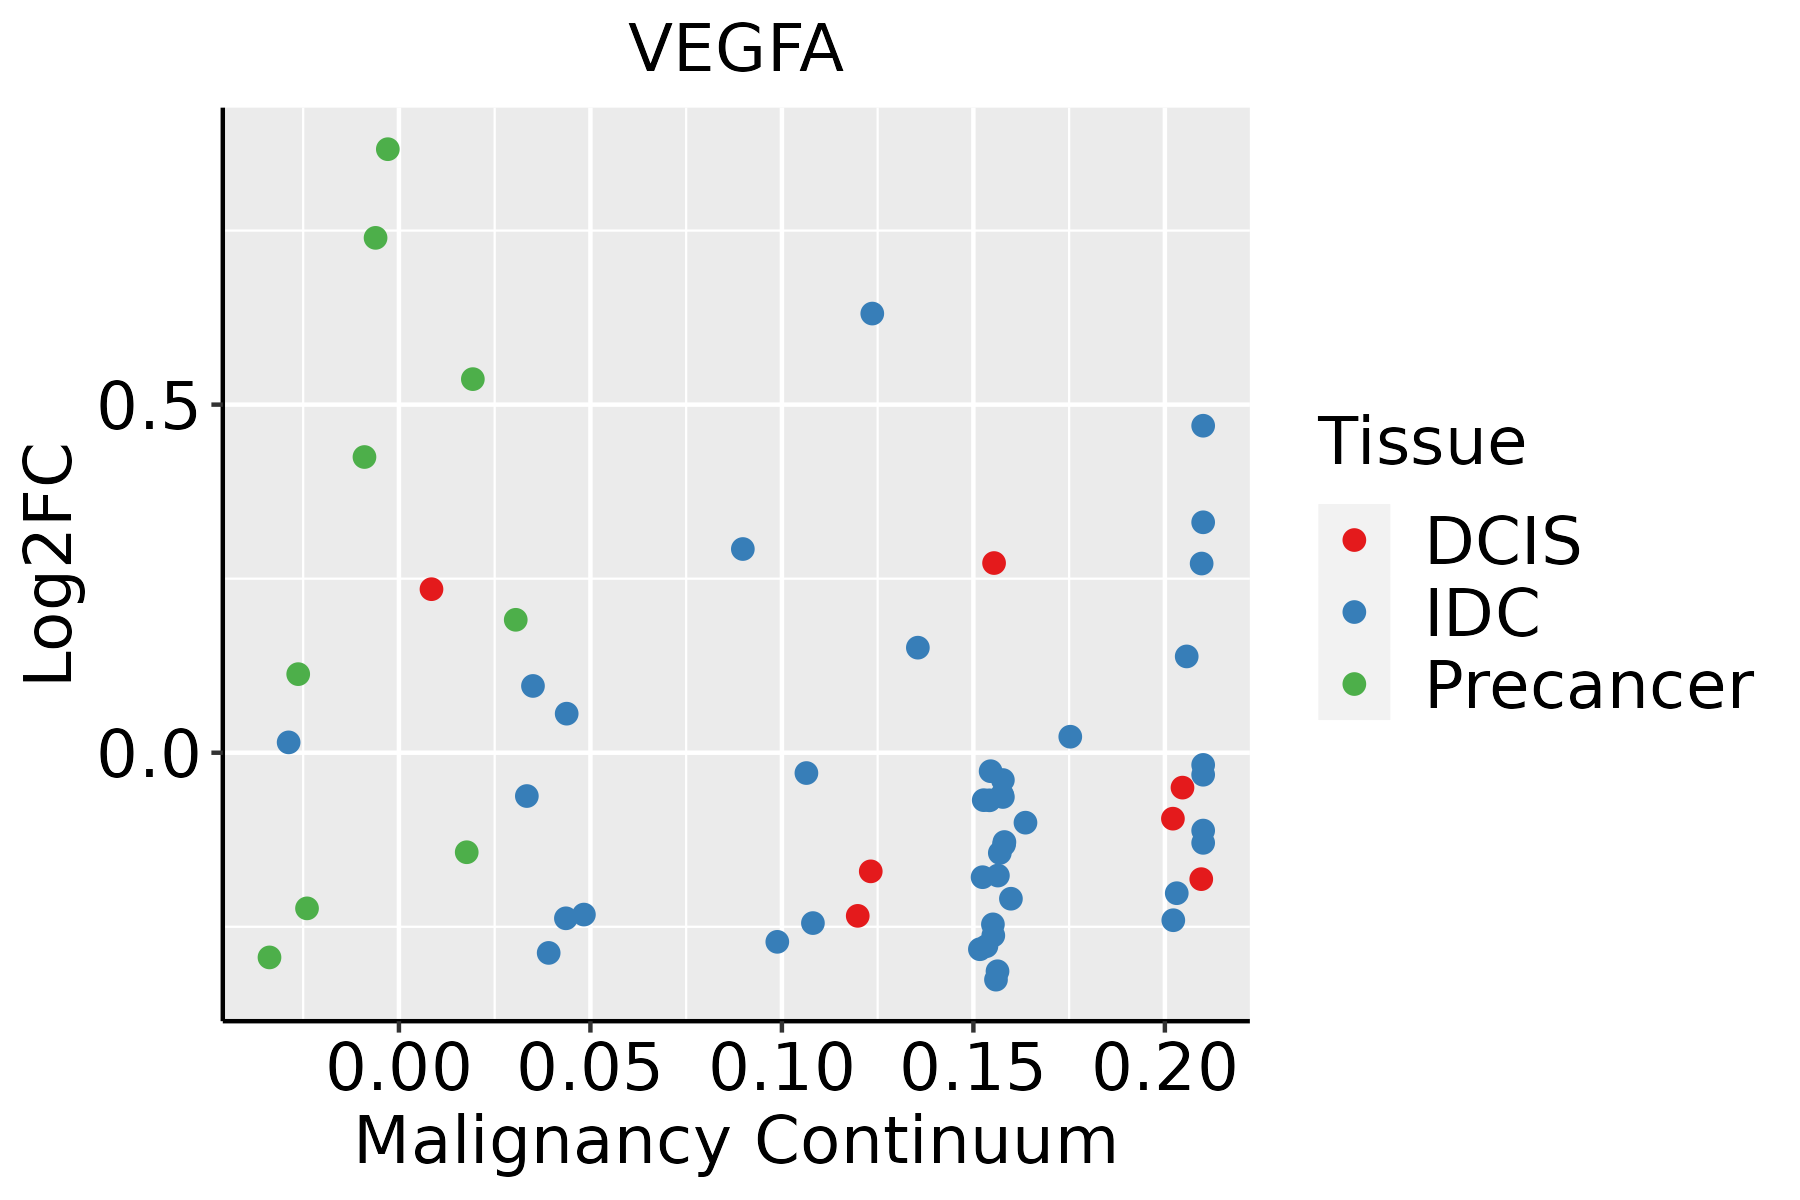 | IDC: Invasive ductal carcinoma |
| DCIS: Ductal carcinoma in situ | ||
| Precancer(BRCA1-mut): Precancerous lesion from BRCA1 mutation carriers | ||
| Cervix |  | CC: Cervix cancer |
| HSIL_HPV: HPV-infected high-grade squamous intraepithelial lesions | ||
| N_HPV: HPV-infected normal cervix | ||
| Colorectum (GSE201348) |  | FAP: Familial adenomatous polyposis |
| CRC: Colorectal cancer | ||
| Colorectum (HTA11) |  | AD: Adenomas |
| SER: Sessile serrated lesions | ||
| MSI-H: Microsatellite-high colorectal cancer | ||
| MSS: Microsatellite stable colorectal cancer | ||
| Endometrium | 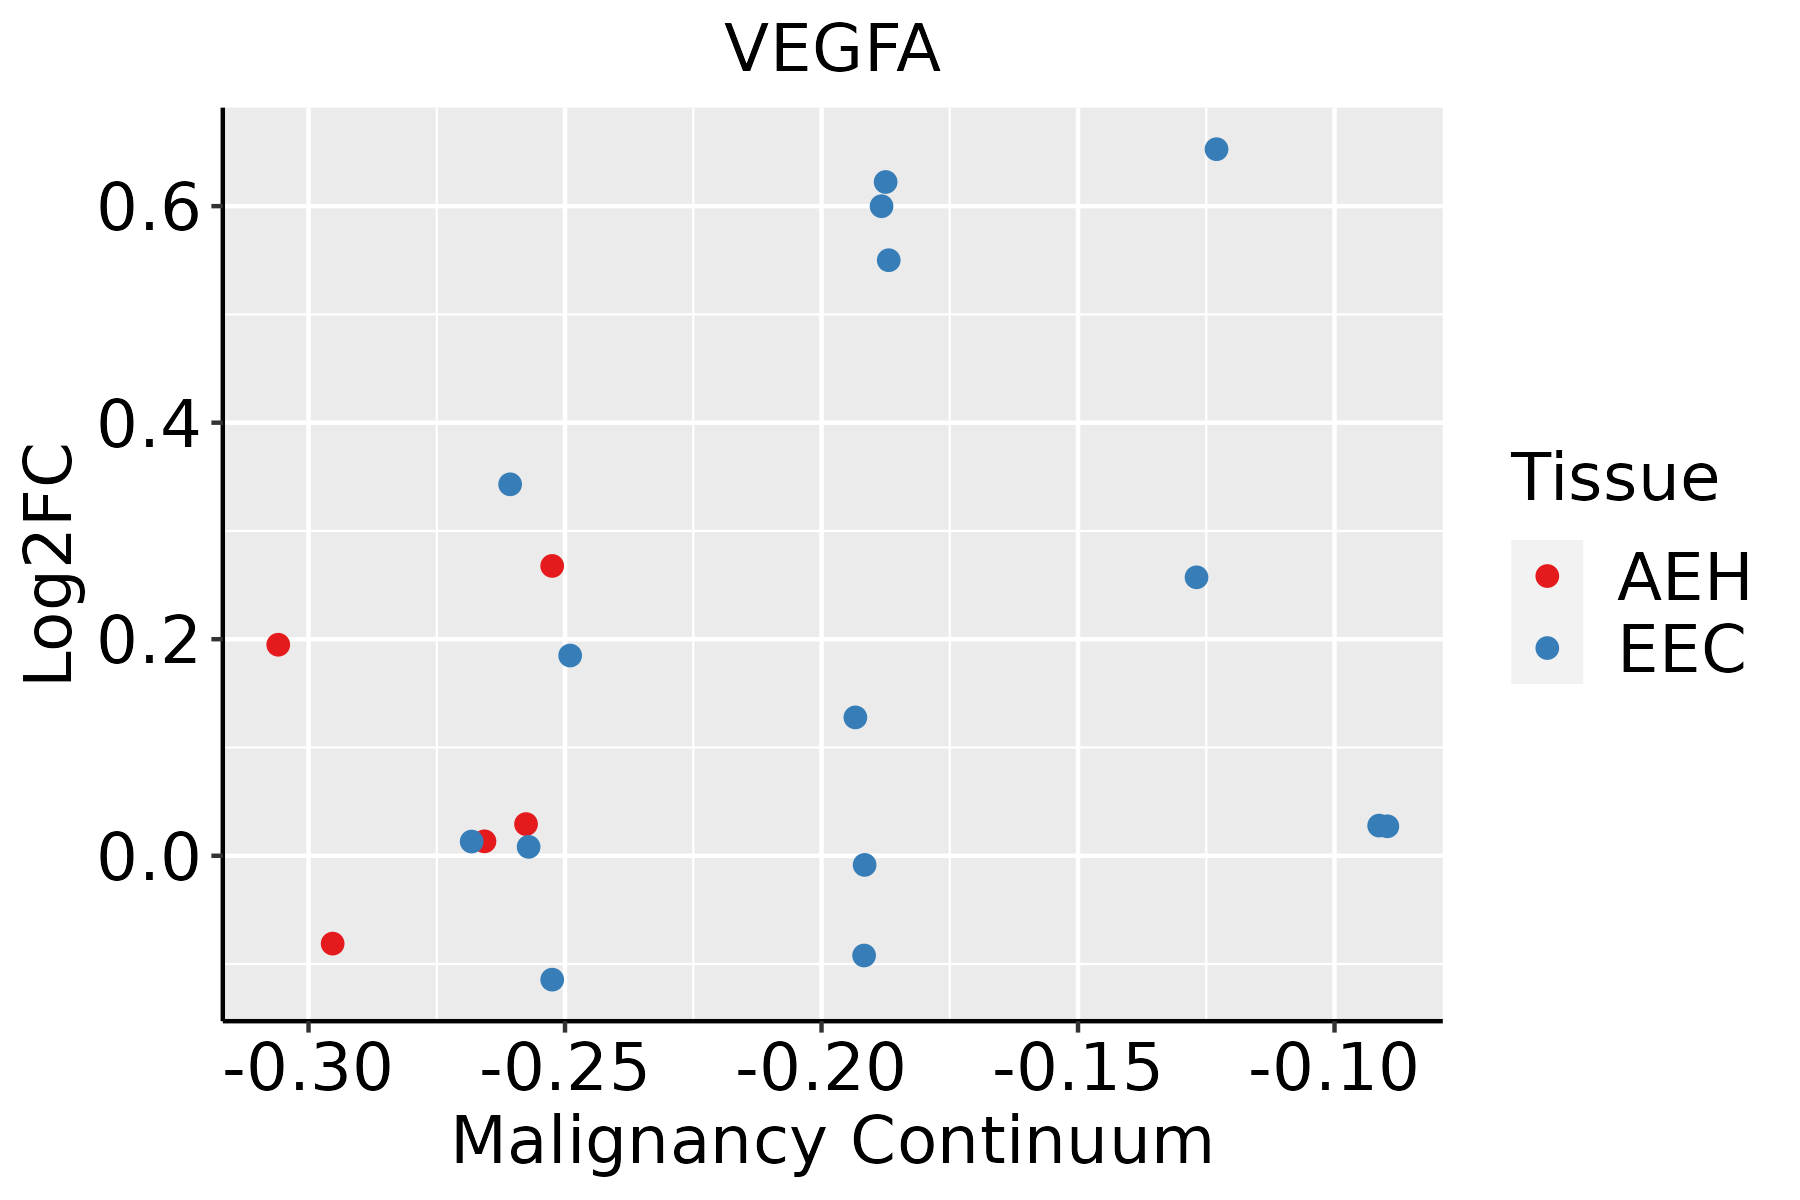 | AEH: Atypical endometrial hyperplasia |
| EEC: Endometrioid Cancer | ||
| Esophagus | 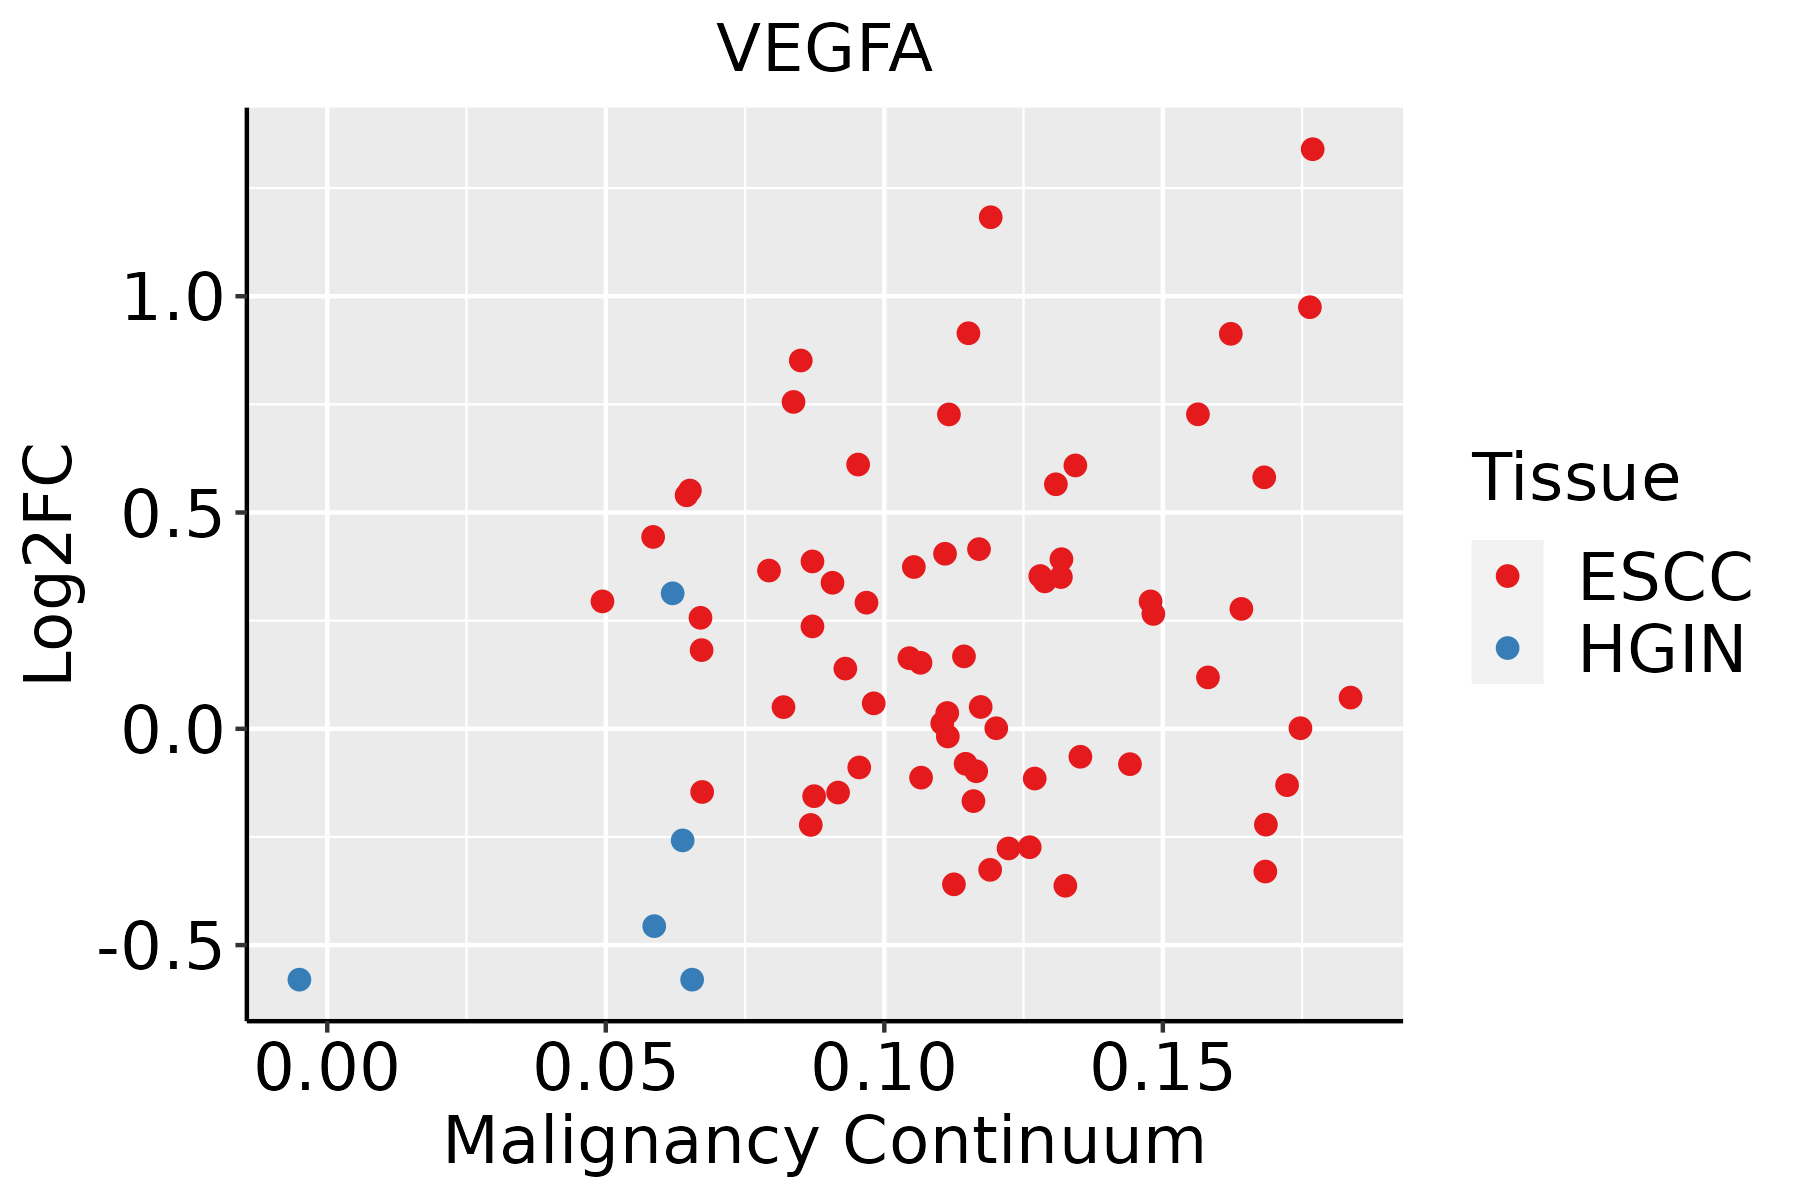 | ESCC: Esophageal squamous cell carcinoma |
| HGIN: High-grade intraepithelial neoplasias | ||
| LGIN: Low-grade intraepithelial neoplasias | ||
| Liver | 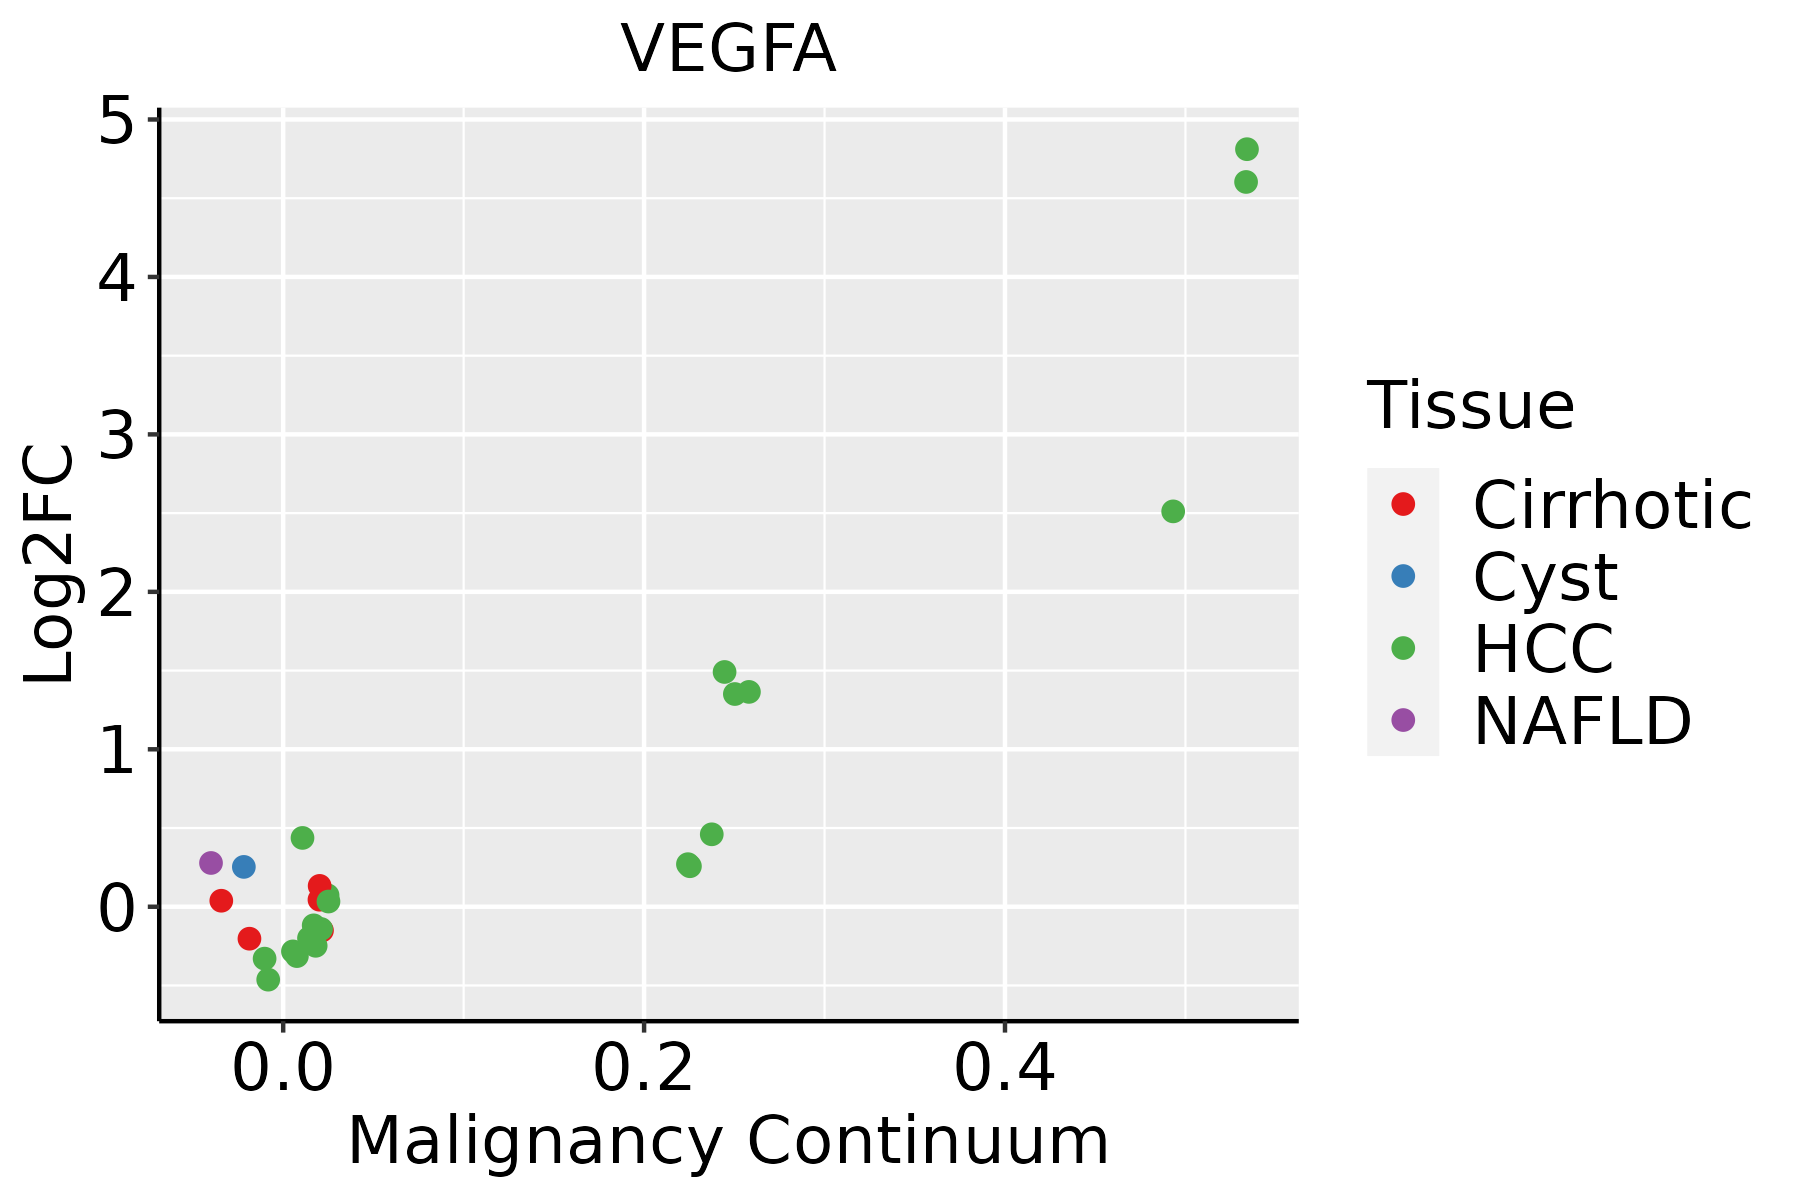 | HCC: Hepatocellular carcinoma |
| NAFLD: Non-alcoholic fatty liver disease | ||
| Lung | 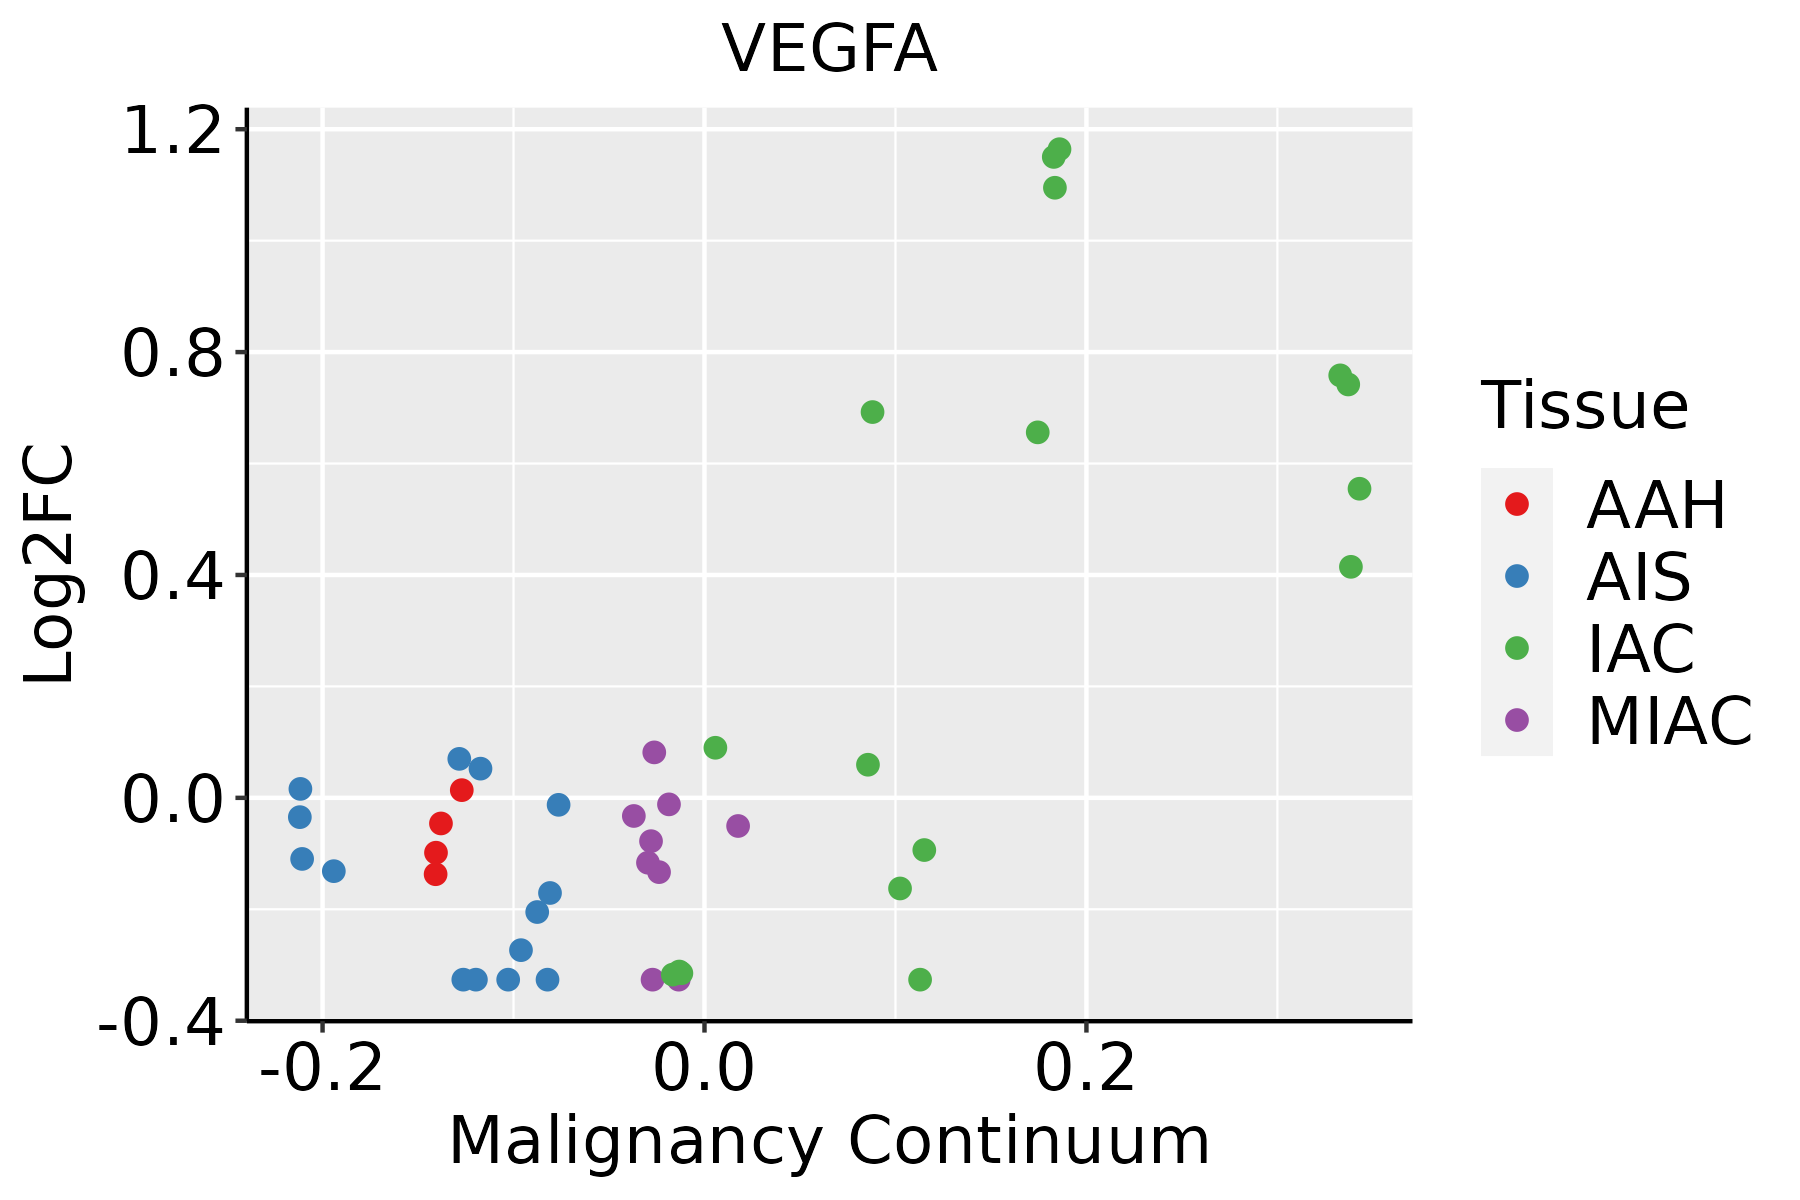 | AAH: Atypical adenomatous hyperplasia |
| AIS: Adenocarcinoma in situ | ||
| IAC: Invasive lung adenocarcinoma | ||
| MIA: Minimally invasive adenocarcinoma | ||
| Oral Cavity | 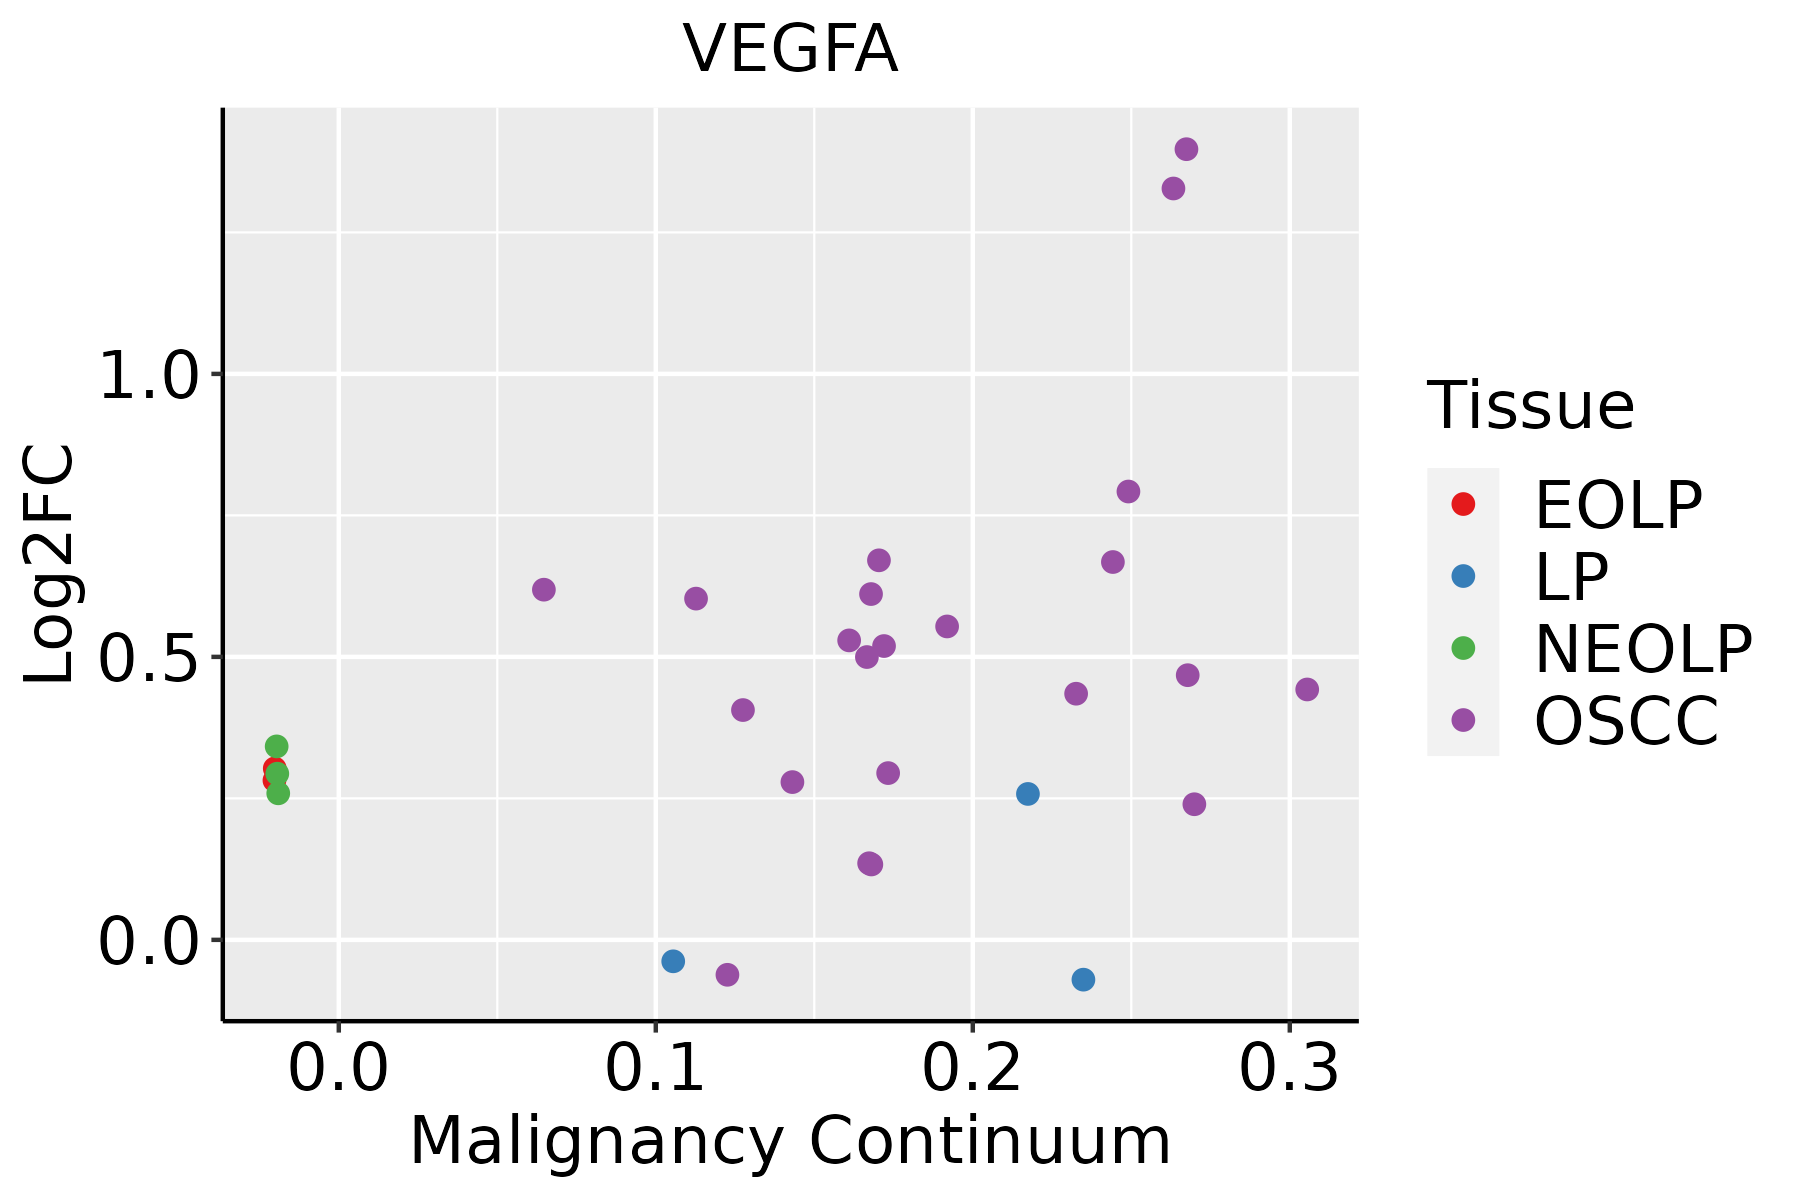 | EOLP: Erosive Oral lichen planus |
| LP: leukoplakia | ||
| NEOLP: Non-erosive oral lichen planus | ||
| OSCC: Oral squamous cell carcinoma | ||
| Prostate | 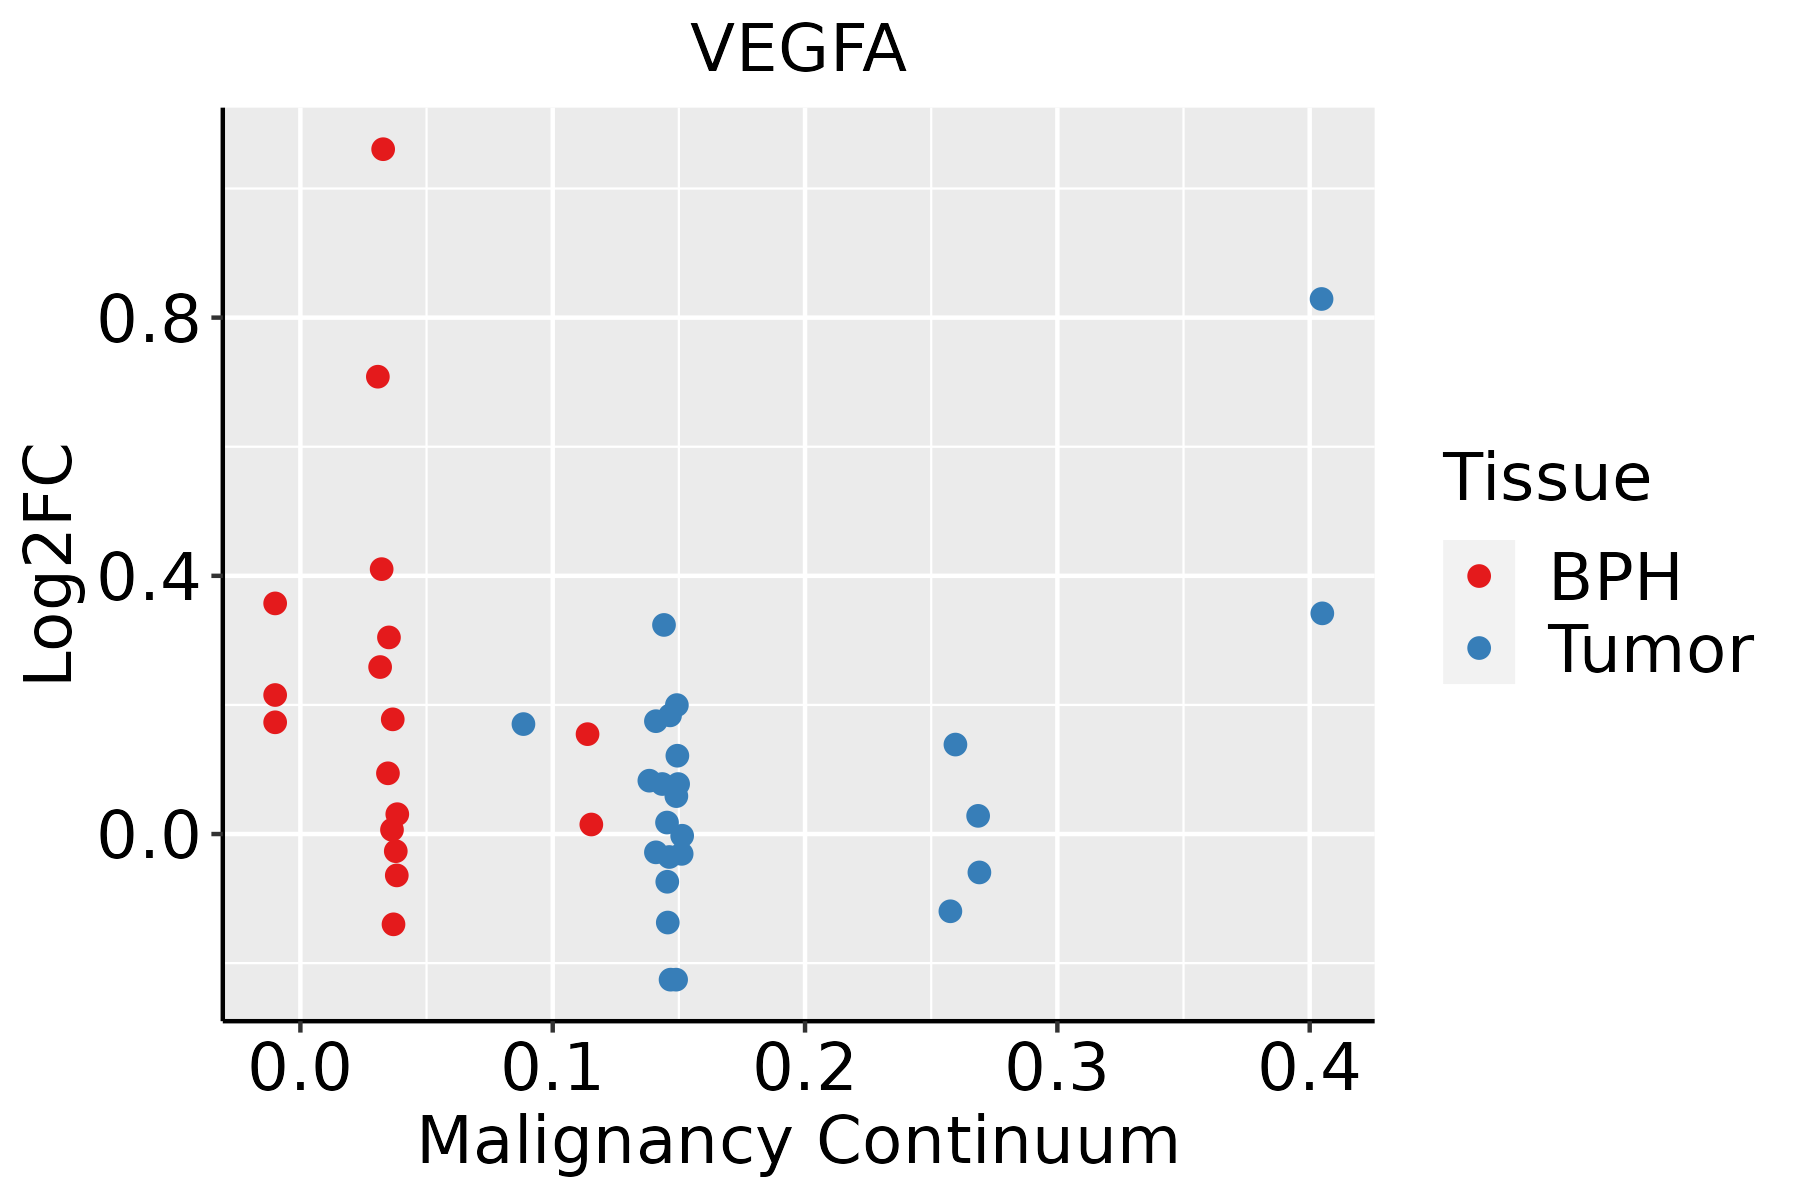 | BPH: Benign Prostatic Hyperplasia |
| Thyroid |  | ATC: Anaplastic thyroid cancer |
| HT: Hashimoto's thyroiditis | ||
| PTC: Papillary thyroid cancer |
| ∗log2FC in expression of this searched gene in stem-like cells from each diseased tissue sample relative to stem-like cells in normal samples in each tissue plotted against the malignancy continuum. Samples are colored based on if they are from different disease stage. |
Top |
Malignant transformation related pathway analysis |
| Find out the enriched GO biological processes and KEGG pathways involved in transition from healthy to precancer to cancer |
| Tissue | Disease Stage | Enriched GO biological Processes |
| Colorectum | AD |  |
| Colorectum | SER |  |
| Colorectum | MSS |  |
| Colorectum | MSI-H |  |
| Colorectum | FAP |  |
| ∗Top 15 enriched GO BP terms are showed in the bar plot of each disease state in each tissue. Each row represents a significant GO biological process which is colored according to the -log10(p.adjust). |
| Page: 1 2 3 4 5 6 7 8 9 |
| GO ID | Tissue | Disease Stage | Description | Gene Ratio | Bg Ratio | pvalue | p.adjust | Count |
| GO:0048872111 | Esophagus | ESCC | homeostasis of number of cells | 163/8552 | 272/18723 | 1.40e-06 | 1.69e-05 | 163 |
| GO:000195217 | Esophagus | ESCC | regulation of cell-matrix adhesion | 85/8552 | 128/18723 | 1.70e-06 | 2.02e-05 | 85 |
| GO:003514815 | Esophagus | ESCC | tube formation | 96/8552 | 148/18723 | 1.86e-06 | 2.16e-05 | 96 |
| GO:004580718 | Esophagus | ESCC | positive regulation of endocytosis | 69/8552 | 100/18723 | 1.97e-06 | 2.29e-05 | 69 |
| GO:00719029 | Esophagus | ESCC | positive regulation of protein serine/threonine kinase activity | 124/8552 | 200/18723 | 2.27e-06 | 2.61e-05 | 124 |
| GO:0030218111 | Esophagus | ESCC | erythrocyte differentiation | 80/8552 | 120/18723 | 2.69e-06 | 3.08e-05 | 80 |
| GO:000257317 | Esophagus | ESCC | myeloid leukocyte differentiation | 128/8552 | 208/18723 | 2.75e-06 | 3.15e-05 | 128 |
| GO:004677710 | Esophagus | ESCC | protein autophosphorylation | 138/8552 | 227/18723 | 2.98e-06 | 3.38e-05 | 138 |
| GO:00182099 | Esophagus | ESCC | peptidyl-serine modification | 196/8552 | 338/18723 | 3.07e-06 | 3.47e-05 | 196 |
| GO:007145616 | Esophagus | ESCC | cellular response to hypoxia | 97/8552 | 151/18723 | 3.12e-06 | 3.51e-05 | 97 |
| GO:001810515 | Esophagus | ESCC | peptidyl-serine phosphorylation | 184/8552 | 315/18723 | 3.22e-06 | 3.61e-05 | 184 |
| GO:000716018 | Esophagus | ESCC | cell-matrix adhesion | 141/8552 | 233/18723 | 3.33e-06 | 3.71e-05 | 141 |
| GO:00510918 | Esophagus | ESCC | positive regulation of DNA-binding transcription factor activity | 155/8552 | 260/18723 | 3.83e-06 | 4.14e-05 | 155 |
| GO:002260420 | Esophagus | ESCC | regulation of cell morphogenesis | 180/8552 | 309/18723 | 5.19e-06 | 5.45e-05 | 180 |
| GO:004586018 | Esophagus | ESCC | positive regulation of protein kinase activity | 219/8552 | 386/18723 | 6.91e-06 | 6.97e-05 | 219 |
| GO:015011619 | Esophagus | ESCC | regulation of cell-substrate junction organization | 51/8552 | 71/18723 | 6.99e-06 | 7.04e-05 | 51 |
| GO:003367420 | Esophagus | ESCC | positive regulation of kinase activity | 260/8552 | 467/18723 | 7.26e-06 | 7.22e-05 | 260 |
| GO:004311218 | Esophagus | ESCC | receptor metabolic process | 104/8552 | 166/18723 | 7.44e-06 | 7.37e-05 | 104 |
| GO:00480087 | Esophagus | ESCC | platelet-derived growth factor receptor signaling pathway | 42/8552 | 56/18723 | 7.62e-06 | 7.54e-05 | 42 |
| GO:00303239 | Esophagus | ESCC | respiratory tube development | 112/8552 | 181/18723 | 7.82e-06 | 7.69e-05 | 112 |
| Page: 1 2 3 4 5 6 7 8 9 10 11 12 13 14 15 16 17 18 19 20 21 22 23 24 25 26 27 28 29 30 31 32 33 34 35 36 37 38 39 40 41 42 43 44 45 46 47 48 49 50 51 52 53 54 55 56 57 58 59 60 61 62 63 64 65 66 67 68 69 70 71 72 73 74 75 76 77 78 79 80 81 82 83 84 85 86 87 88 89 90 91 92 93 94 95 96 97 98 99 100 101 102 103 104 105 106 107 108 109 110 111 112 113 114 115 116 117 118 119 120 121 122 123 124 125 126 127 128 129 130 131 132 133 134 135 136 137 138 139 140 141 142 143 144 145 146 147 148 149 150 151 152 153 154 155 156 157 158 159 160 161 |
| Pathway ID | Tissue | Disease Stage | Description | Gene Ratio | Bg Ratio | pvalue | p.adjust | qvalue | Count |
| hsa0520818 | Breast | Precancer | Chemical carcinogenesis - reactive oxygen species | 68/684 | 223/8465 | 3.61e-23 | 1.14e-21 | 8.73e-22 | 68 |
| hsa0516718 | Breast | Precancer | Kaposi sarcoma-associated herpesvirus infection | 36/684 | 194/8465 | 1.68e-06 | 2.53e-05 | 1.94e-05 | 36 |
| hsa0541818 | Breast | Precancer | Fluid shear stress and atherosclerosis | 28/684 | 139/8465 | 4.74e-06 | 6.00e-05 | 4.59e-05 | 28 |
| hsa0406616 | Breast | Precancer | HIF-1 signaling pathway | 23/684 | 109/8465 | 1.51e-05 | 1.59e-04 | 1.22e-04 | 23 |
| hsa0532312 | Breast | Precancer | Rheumatoid arthritis | 19/684 | 93/8465 | 1.30e-04 | 1.14e-03 | 8.73e-04 | 19 |
| hsa0520514 | Breast | Precancer | Proteoglycans in cancer | 30/684 | 205/8465 | 1.00e-03 | 7.18e-03 | 5.50e-03 | 30 |
| hsa0516316 | Breast | Precancer | Human cytomegalovirus infection | 32/684 | 225/8465 | 1.13e-03 | 7.57e-03 | 5.80e-03 | 32 |
| hsa052196 | Breast | Precancer | Bladder cancer | 9/684 | 41/8465 | 4.65e-03 | 2.72e-02 | 2.08e-02 | 9 |
| hsa0520819 | Breast | Precancer | Chemical carcinogenesis - reactive oxygen species | 68/684 | 223/8465 | 3.61e-23 | 1.14e-21 | 8.73e-22 | 68 |
| hsa0516719 | Breast | Precancer | Kaposi sarcoma-associated herpesvirus infection | 36/684 | 194/8465 | 1.68e-06 | 2.53e-05 | 1.94e-05 | 36 |
| hsa0541819 | Breast | Precancer | Fluid shear stress and atherosclerosis | 28/684 | 139/8465 | 4.74e-06 | 6.00e-05 | 4.59e-05 | 28 |
| hsa0406617 | Breast | Precancer | HIF-1 signaling pathway | 23/684 | 109/8465 | 1.51e-05 | 1.59e-04 | 1.22e-04 | 23 |
| hsa0532313 | Breast | Precancer | Rheumatoid arthritis | 19/684 | 93/8465 | 1.30e-04 | 1.14e-03 | 8.73e-04 | 19 |
| hsa0520515 | Breast | Precancer | Proteoglycans in cancer | 30/684 | 205/8465 | 1.00e-03 | 7.18e-03 | 5.50e-03 | 30 |
| hsa0516317 | Breast | Precancer | Human cytomegalovirus infection | 32/684 | 225/8465 | 1.13e-03 | 7.57e-03 | 5.80e-03 | 32 |
| hsa0521913 | Breast | Precancer | Bladder cancer | 9/684 | 41/8465 | 4.65e-03 | 2.72e-02 | 2.08e-02 | 9 |
| hsa0520824 | Breast | IDC | Chemical carcinogenesis - reactive oxygen species | 71/867 | 223/8465 | 2.55e-19 | 7.53e-18 | 5.63e-18 | 71 |
| hsa0541824 | Breast | IDC | Fluid shear stress and atherosclerosis | 34/867 | 139/8465 | 9.41e-07 | 1.61e-05 | 1.20e-05 | 34 |
| hsa0520523 | Breast | IDC | Proteoglycans in cancer | 42/867 | 205/8465 | 7.69e-06 | 9.99e-05 | 7.48e-05 | 42 |
| hsa0516723 | Breast | IDC | Kaposi sarcoma-associated herpesvirus infection | 38/867 | 194/8465 | 5.87e-05 | 5.96e-04 | 4.46e-04 | 38 |
| Page: 1 2 3 4 5 6 7 8 9 10 11 12 13 14 15 16 17 18 19 20 21 22 23 |
Top |
Cell-cell communication analysis |
| Identification of potential cell-cell interactions between two cell types and their ligand-receptor pairs for different disease states |
| Ligand | Receptor | LRpair | Pathway | Tissue | Disease Stage |
| VEGFA | FLT1 | VEGFA_VEGFR1 | VEGF | Breast | ADJ |
| VEGFA | KDR | VEGFA_VEGFR2 | VEGF | Breast | ADJ |
| VEGFA | FLT1_KDR | VEGFA_VEGFR1R2 | VEGF | Breast | ADJ |
| VEGFA | FLT1 | VEGFA_VEGFR1 | VEGF | Breast | DCIS |
| VEGFA | FLT1 | VEGFA_VEGFR1 | VEGF | Breast | Healthy |
| VEGFA | KDR | VEGFA_VEGFR2 | VEGF | Breast | Healthy |
| VEGFA | FLT1_KDR | VEGFA_VEGFR1R2 | VEGF | Breast | Healthy |
| VEGFA | FLT1 | VEGFA_VEGFR1 | VEGF | Breast | IDC |
| VEGFA | KDR | VEGFA_VEGFR2 | VEGF | Breast | IDC |
| VEGFA | FLT1_KDR | VEGFA_VEGFR1R2 | VEGF | Breast | IDC |
| VEGFA | FLT1 | VEGFA_VEGFR1 | VEGF | Breast | Precancer |
| VEGFA | FLT1 | VEGFA_VEGFR1 | VEGF | Cervix | ADJ |
| VEGFA | KDR | VEGFA_VEGFR2 | VEGF | Cervix | ADJ |
| VEGFA | FLT1_KDR | VEGFA_VEGFR1R2 | VEGF | Cervix | ADJ |
| VEGFA | FLT1 | VEGFA_VEGFR1 | VEGF | Cervix | CC |
| VEGFA | KDR | VEGFA_VEGFR2 | VEGF | Cervix | CC |
| VEGFA | FLT1_KDR | VEGFA_VEGFR1R2 | VEGF | Cervix | CC |
| VEGFA | FLT1 | VEGFA_VEGFR1 | VEGF | Cervix | Healthy |
| VEGFA | KDR | VEGFA_VEGFR2 | VEGF | Cervix | Healthy |
| VEGFA | FLT1_KDR | VEGFA_VEGFR1R2 | VEGF | Cervix | Healthy |
| Page: 1 2 3 4 5 6 |
Top |
Single-cell gene regulatory network inference analysis |
| Find out the significant the regulons (TFs) and the target genes of each regulon across cell types for different disease states |
| TF | Cell Type | Tissue | Disease Stage | Target Gene | RSS | Regulon Activity |
| ∗The dot plots of a searched regulon are shown for all cell subpopulations in each disease state of each tissue based on the regulon specific score inferred using pySCENIC and by calculating the average expression. |
| Page: 1 |
Top |
Somatic mutation of malignant transformation related genes |
| Annotation of somatic variants for genes involved in malignant transformation |
| Hugo Symbol | Variant Class | Variant Classification | dbSNP RS | HGVSc | HGVSp | HGVSp Short | SWISSPROT | BIOTYPE | SIFT | PolyPhen | Tumor Sample Barcode | Tissue | Histology | Sex | Age | Stage | Therapy Types | Drugs | Outcome |
| VEGFA | SNV | Missense_Mutation | novel | c.1235N>T | p.Arg412Leu | p.R412L | protein_coding | deleterious(0) | probably_damaging(0.999) | TCGA-A2-A0ST-01 | Breast | breast invasive carcinoma | Female | <65 | I/II | Chemotherapy | adriamycin | SD | |
| VEGFA | SNV | Missense_Mutation | novel | c.1102T>C | p.Ser368Pro | p.S368P | protein_coding | tolerated(0.06) | probably_damaging(0.991) | TCGA-B6-A0I6-01 | Breast | breast invasive carcinoma | Female | <65 | I/II | Unknown | Unknown | PD | |
| VEGFA | SNV | Missense_Mutation | rs753526479 | c.1073N>C | p.Leu358Pro | p.L358P | protein_coding | tolerated_low_confidence(0.38) | possibly_damaging(0.549) | TCGA-BH-A1FU-01 | Breast | breast invasive carcinoma | Female | <65 | I/II | Unknown | Unknown | PD | |
| VEGFA | SNV | Missense_Mutation | c.742G>A | p.Glu248Lys | p.E248K | protein_coding | tolerated(0.07) | possibly_damaging(0.526) | TCGA-IR-A3LA-01 | Cervix | cervical & endocervical cancer | Female | <65 | I/II | Chemotherapy | cisplatin | CR | ||
| VEGFA | SNV | Missense_Mutation | rs376388064 | c.1136N>T | p.Pro379Leu | p.P379L | protein_coding | deleterious(0.02) | probably_damaging(1) | TCGA-AA-3663-01 | Colorectum | colon adenocarcinoma | Male | <65 | I/II | Unknown | Unknown | SD | |
| VEGFA | SNV | Missense_Mutation | c.1174N>T | p.Arg392Cys | p.R392C | protein_coding | deleterious(0) | probably_damaging(0.997) | TCGA-AA-3672-01 | Colorectum | colon adenocarcinoma | Female | >=65 | III/IV | Unknown | Unknown | SD | ||
| VEGFA | SNV | Missense_Mutation | rs369593555 | c.1175G>A | p.Arg392His | p.R392H | protein_coding | tolerated(0.11) | possibly_damaging(0.761) | TCGA-AA-3949-01 | Colorectum | colon adenocarcinoma | Female | >=65 | III/IV | Unknown | Unknown | SD | |
| VEGFA | SNV | Missense_Mutation | novel | c.538N>G | p.Thr180Ala | p.T180A | protein_coding | tolerated_low_confidence(0.06) | benign(0.342) | TCGA-CK-4951-01 | Colorectum | colon adenocarcinoma | Female | >=65 | I/II | Unknown | Unknown | PD | |
| VEGFA | SNV | Missense_Mutation | c.128N>T | p.Glu43Val | p.E43V | protein_coding | deleterious_low_confidence(0) | probably_damaging(0.994) | TCGA-CM-4743-01 | Colorectum | colon adenocarcinoma | Male | >=65 | I/II | Chemotherapy | capecitabine | SD | ||
| VEGFA | insertion | Frame_Shift_Ins | novel | c.1158_1159insA | p.Asn388LysfsTer12 | p.N388Kfs*12 | protein_coding | TCGA-AA-3715-01 | Colorectum | colon adenocarcinoma | Male | >=65 | I/II | Unknown | Unknown | PD |
| Page: 1 2 |
Top |
Related drugs of malignant transformation related genes |
| Identification of chemicals and drugs interact with genes involved in malignant transfromation |
| (DGIdb 4.0) |
| Entrez ID | Symbol | Category | Interaction Types | Drug Claim Name | Drug Name | PMIDs |
| 7422 | VEGFA | CLINICALLY ACTIONABLE, GROWTH FACTOR, CELL SURFACE, DRUGGABLE GENOME | ANTHRACYCLINE | 15297400 | ||
| 7422 | VEGFA | CLINICALLY ACTIONABLE, GROWTH FACTOR, CELL SURFACE, DRUGGABLE GENOME | Carbamide derivative 17 | |||
| 7422 | VEGFA | CLINICALLY ACTIONABLE, GROWTH FACTOR, CELL SURFACE, DRUGGABLE GENOME | inhibitor | SORAFENIB TOSYLATE | ||
| 7422 | VEGFA | CLINICALLY ACTIONABLE, GROWTH FACTOR, CELL SURFACE, DRUGGABLE GENOME | Carbamide derivative 21 | |||
| 7422 | VEGFA | CLINICALLY ACTIONABLE, GROWTH FACTOR, CELL SURFACE, DRUGGABLE GENOME | FENOFIBRATE | FENOFIBRATE | 11356390 | |
| 7422 | VEGFA | CLINICALLY ACTIONABLE, GROWTH FACTOR, CELL SURFACE, DRUGGABLE GENOME | Quinoline and quinazoline derivative 4 | |||
| 7422 | VEGFA | CLINICALLY ACTIONABLE, GROWTH FACTOR, CELL SURFACE, DRUGGABLE GENOME | Navicixizumab | NAVICIXIZUMAB | ||
| 7422 | VEGFA | CLINICALLY ACTIONABLE, GROWTH FACTOR, CELL SURFACE, DRUGGABLE GENOME | inhibitor | CHEMBL1742982 | AFLIBERCEPT | |
| 7422 | VEGFA | CLINICALLY ACTIONABLE, GROWTH FACTOR, CELL SURFACE, DRUGGABLE GENOME | PENTOSAN POLYSULFATE | 17071199 | ||
| 7422 | VEGFA | CLINICALLY ACTIONABLE, GROWTH FACTOR, CELL SURFACE, DRUGGABLE GENOME | Carbamide derivative 20 |
| Page: 1 2 3 4 5 6 7 8 9 10 11 12 13 14 15 |

Copyright 2023-Present -The University of Texas Health Science Center at Houston |