
|
|||||
|
 | |
| |
| |
| |
| |
| |
|
Gene: PYCARD |
Gene summary for PYCARD |
| Gene information | Species | Human | Gene symbol | PYCARD | Gene ID | 29108 |
| Gene name | PYD and CARD domain containing | |
| Gene Alias | ASC | |
| Cytomap | 16p11.2 | |
| Gene Type | protein-coding | GO ID | GO:0000165 | UniProtAcc | Q9ULZ3 |
Top |
Malignant transformation analysis |
| Identification of the aberrant gene expression in precancerous and cancerous lesions by comparing the gene expression of stem-like cells in diseased tissues with normal stem cells |
| Entrez ID | Symbol | Replicates | Species | Organ | Tissue | Adj P-value | Log2FC | Malignancy |
| 29108 | PYCARD | GSM4909281 | Human | Breast | IDC | 5.84e-03 | -1.92e-01 | 0.21 |
| 29108 | PYCARD | GSM4909286 | Human | Breast | IDC | 2.57e-02 | -1.71e-01 | 0.1081 |
| 29108 | PYCARD | GSM4909291 | Human | Breast | IDC | 1.07e-07 | -2.87e-01 | 0.1753 |
| 29108 | PYCARD | GSM4909294 | Human | Breast | IDC | 1.50e-05 | 3.86e-01 | 0.2022 |
| 29108 | PYCARD | GSM4909297 | Human | Breast | IDC | 6.61e-05 | -1.86e-02 | 0.1517 |
| 29108 | PYCARD | GSM4909298 | Human | Breast | IDC | 3.65e-18 | 5.52e-01 | 0.1551 |
| 29108 | PYCARD | GSM4909307 | Human | Breast | IDC | 3.22e-10 | 5.17e-01 | 0.1569 |
| 29108 | PYCARD | GSM4909308 | Human | Breast | IDC | 3.34e-31 | 7.52e-01 | 0.158 |
| 29108 | PYCARD | GSM4909311 | Human | Breast | IDC | 4.23e-15 | -1.50e-01 | 0.1534 |
| 29108 | PYCARD | GSM4909312 | Human | Breast | IDC | 4.93e-04 | 5.44e-02 | 0.1552 |
| 29108 | PYCARD | GSM4909313 | Human | Breast | IDC | 2.95e-08 | 4.02e-01 | 0.0391 |
| 29108 | PYCARD | GSM4909317 | Human | Breast | IDC | 1.09e-11 | 5.16e-01 | 0.1355 |
| 29108 | PYCARD | GSM4909318 | Human | Breast | IDC | 4.86e-05 | 5.57e-01 | 0.2031 |
| 29108 | PYCARD | GSM4909319 | Human | Breast | IDC | 4.32e-23 | -3.35e-02 | 0.1563 |
| 29108 | PYCARD | GSM4909321 | Human | Breast | IDC | 1.56e-10 | 3.17e-01 | 0.1559 |
| 29108 | PYCARD | M1 | Human | Breast | IDC | 3.40e-02 | 3.83e-01 | 0.1577 |
| 29108 | PYCARD | M2 | Human | Breast | IDC | 1.23e-05 | 4.60e-01 | 0.21 |
| 29108 | PYCARD | M5 | Human | Breast | IDC | 4.09e-03 | 5.97e-01 | 0.1598 |
| 29108 | PYCARD | NCCBC11 | Human | Breast | DCIS | 6.39e-04 | 4.33e-01 | 0.1232 |
| 29108 | PYCARD | NCCBC14 | Human | Breast | DCIS | 3.68e-06 | 1.44e-01 | 0.2021 |
| Page: 1 2 3 4 5 6 7 8 9 10 11 |
| Tissue | Expression Dynamics | Abbreviation |
| Breast | 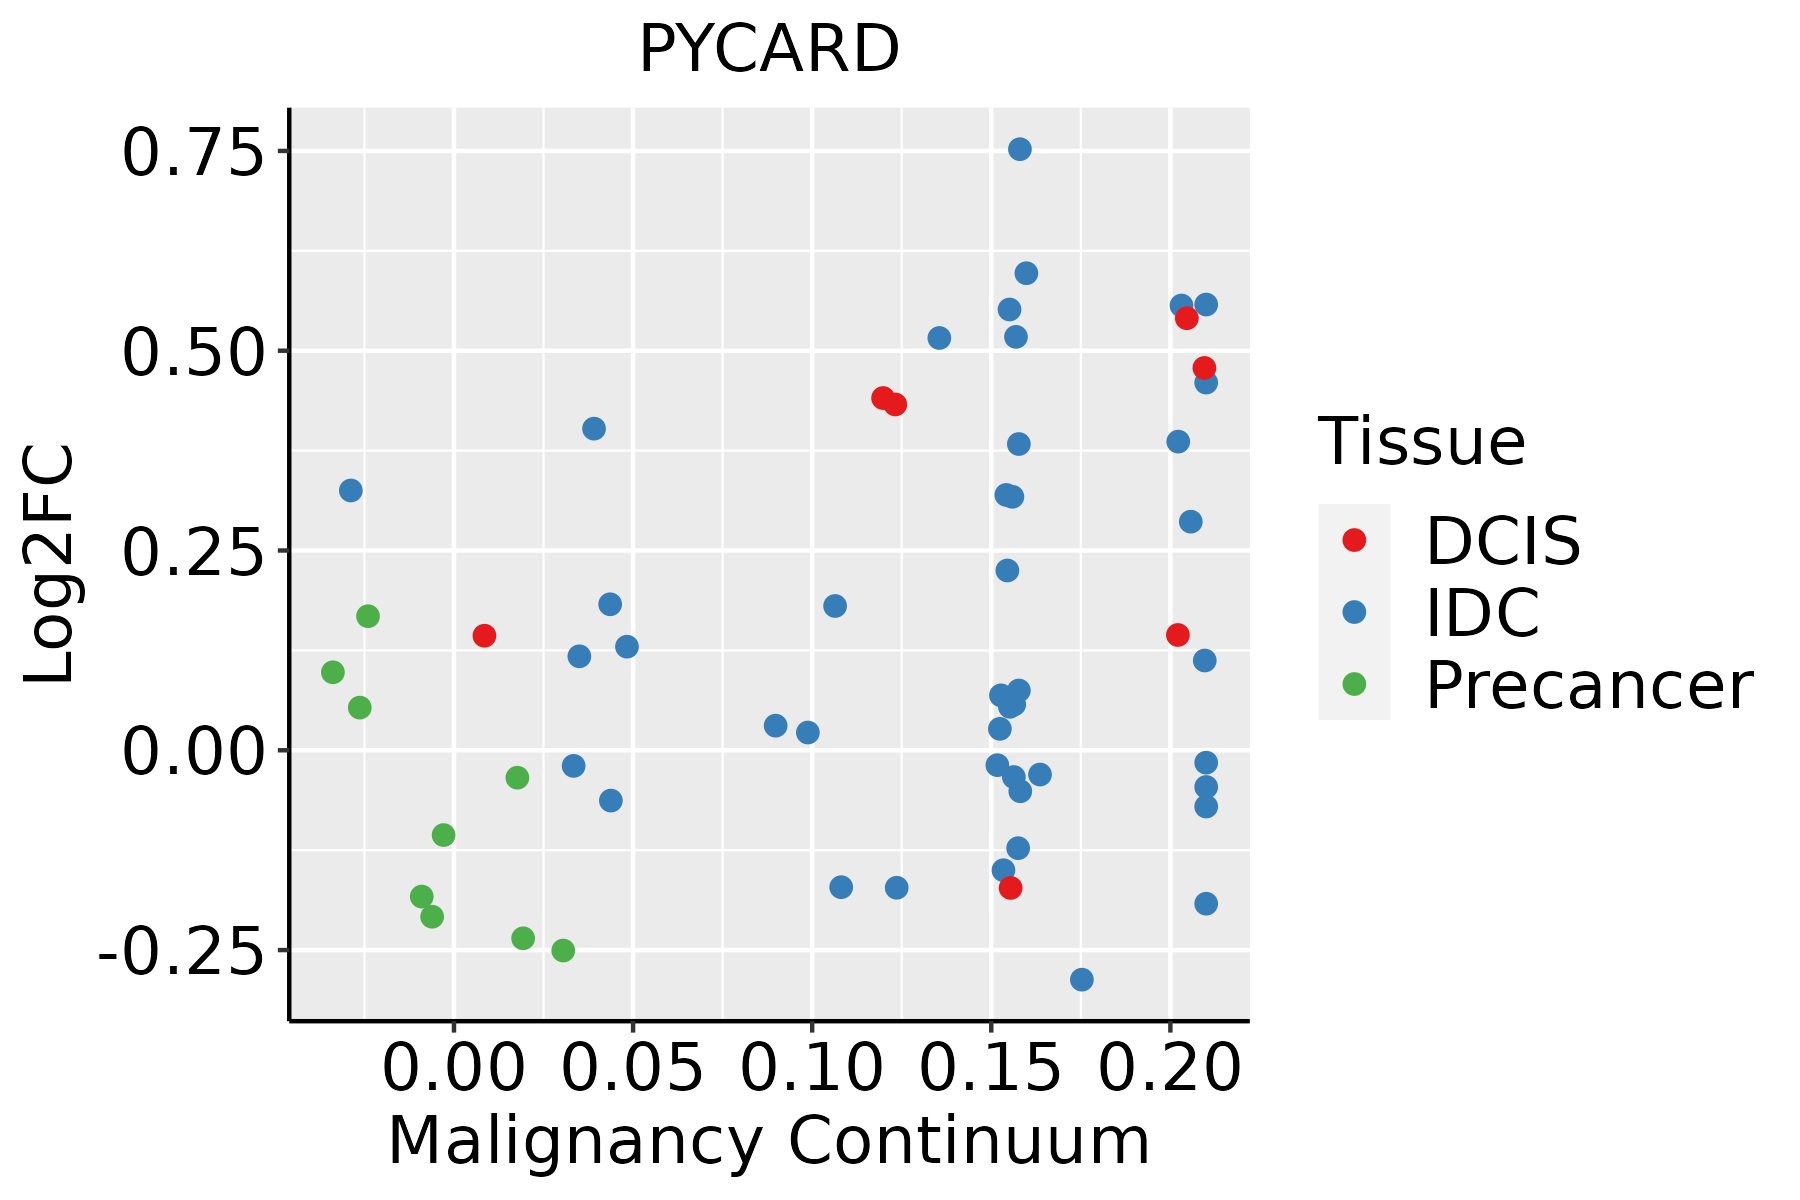 | IDC: Invasive ductal carcinoma |
| DCIS: Ductal carcinoma in situ | ||
| Precancer(BRCA1-mut): Precancerous lesion from BRCA1 mutation carriers | ||
| Cervix |  | CC: Cervix cancer |
| HSIL_HPV: HPV-infected high-grade squamous intraepithelial lesions | ||
| N_HPV: HPV-infected normal cervix | ||
| Colorectum (GSE201348) |  | FAP: Familial adenomatous polyposis |
| CRC: Colorectal cancer | ||
| Colorectum (HTA11) |  | AD: Adenomas |
| SER: Sessile serrated lesions | ||
| MSI-H: Microsatellite-high colorectal cancer | ||
| MSS: Microsatellite stable colorectal cancer | ||
| Esophagus | 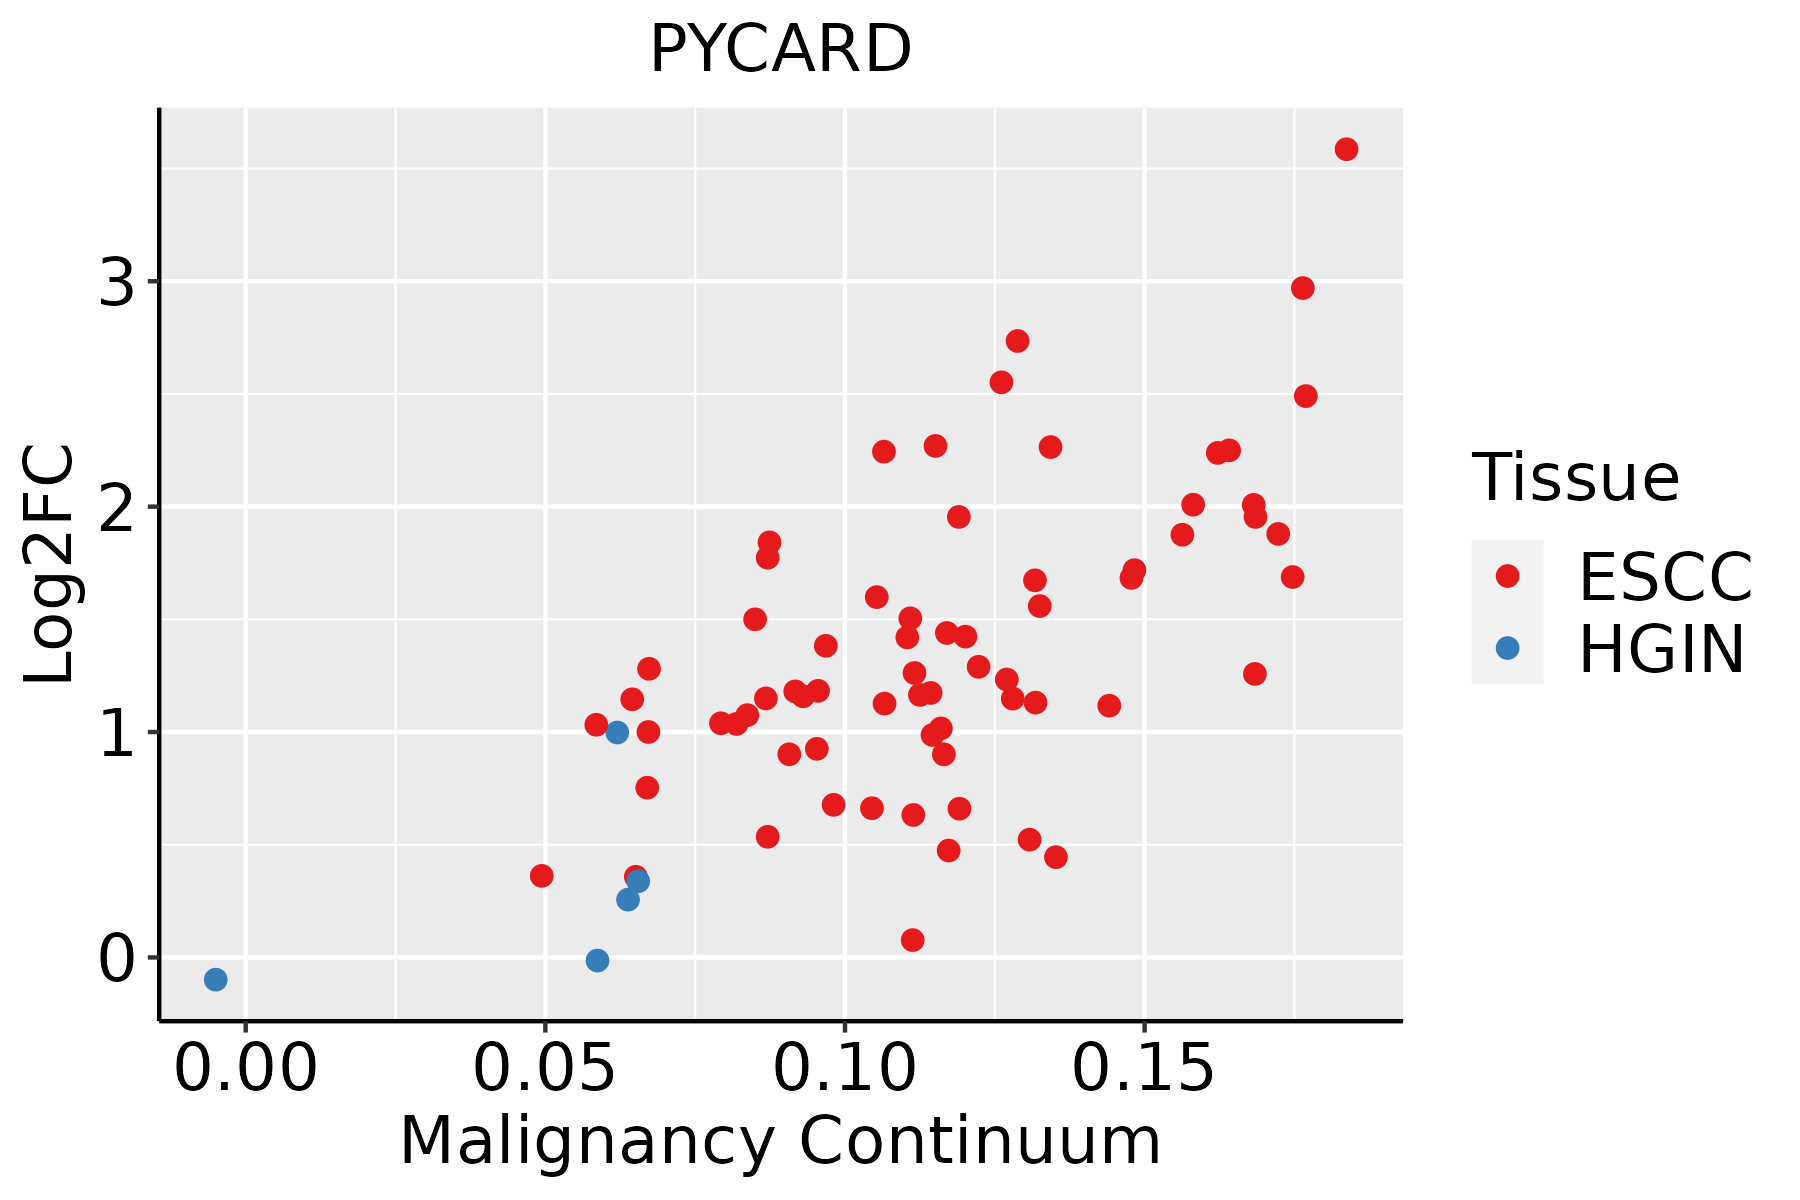 | ESCC: Esophageal squamous cell carcinoma |
| HGIN: High-grade intraepithelial neoplasias | ||
| LGIN: Low-grade intraepithelial neoplasias | ||
| GC | 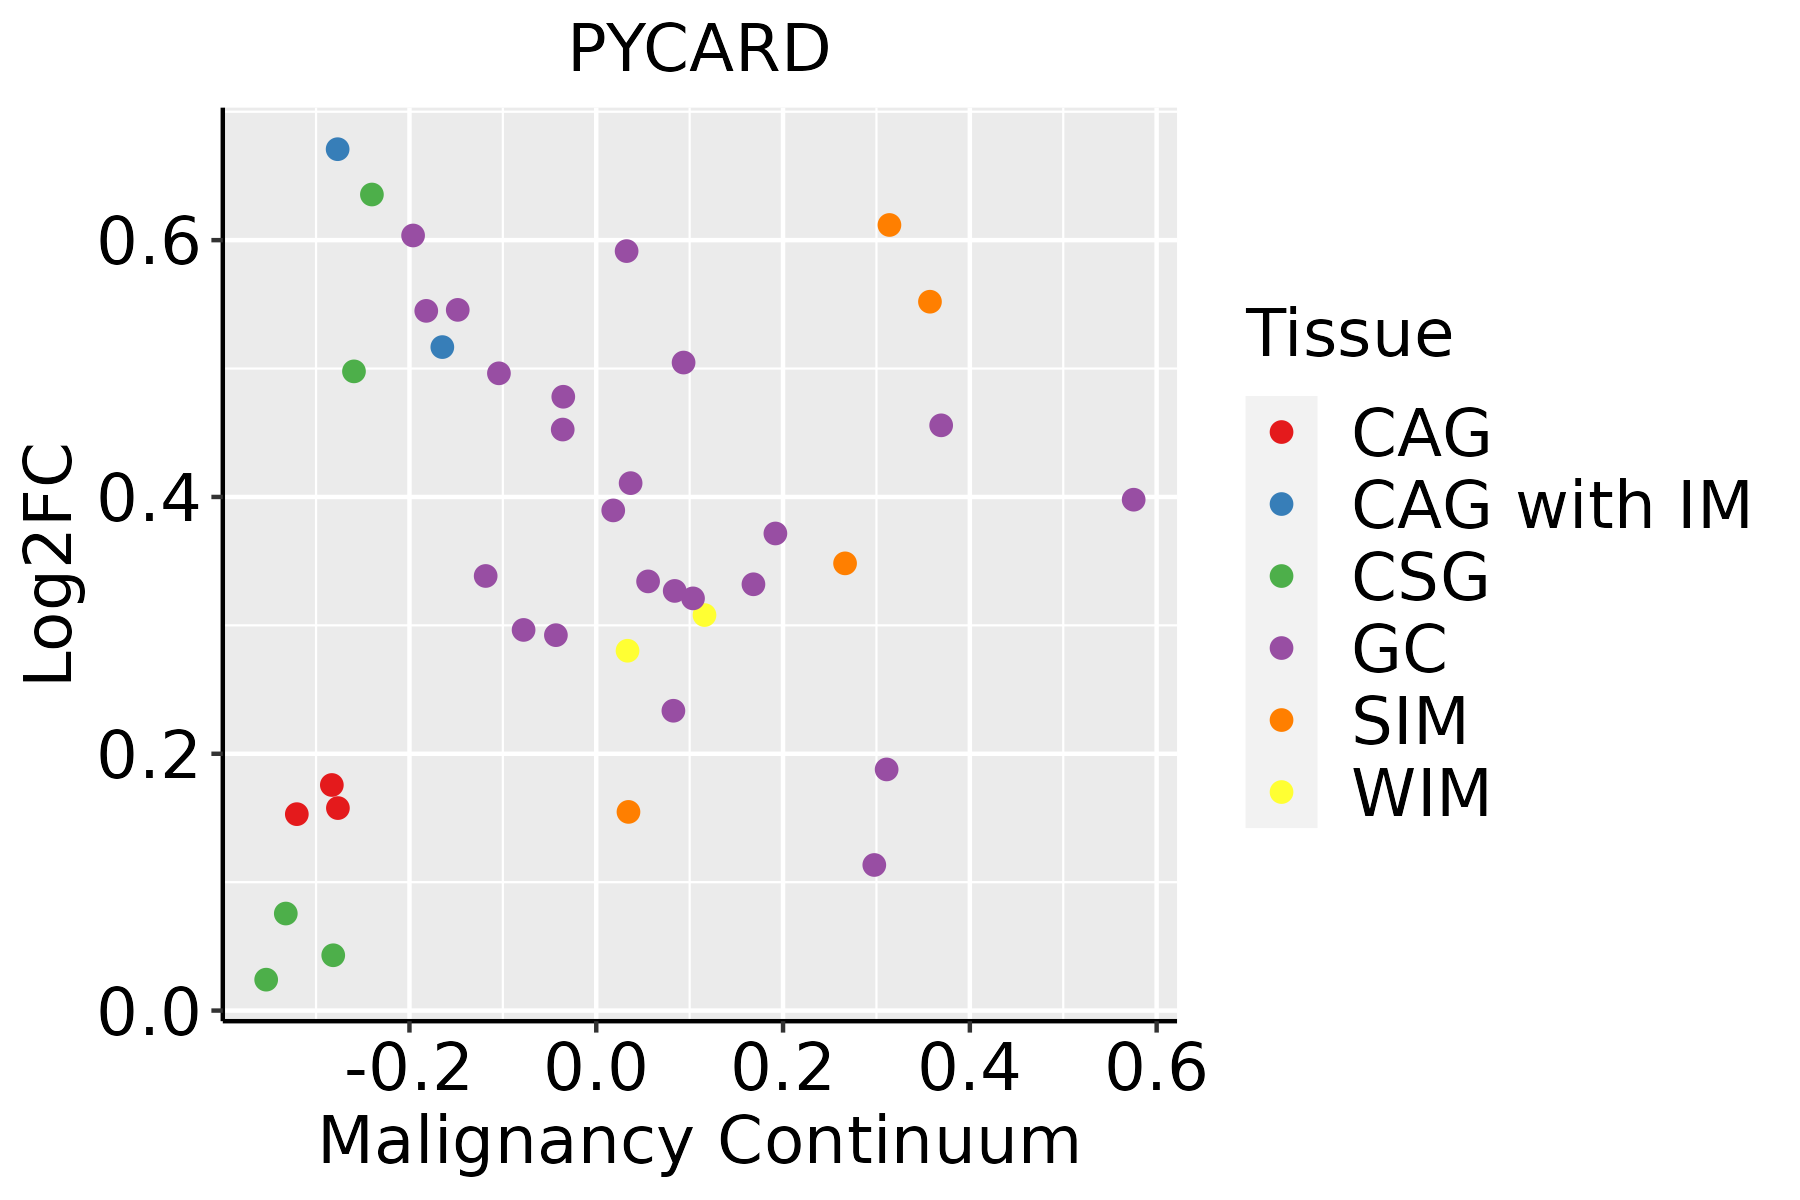 | CAG: Chronic atrophic gastritis |
| CAG with IM: Chronic atrophic gastritis with intestinal metaplasia | ||
| CSG: Chronic superficial gastritis | ||
| GC: Gastric cancer | ||
| SIM: Severe intestinal metaplasia | ||
| WIM: Wild intestinal metaplasia | ||
| Oral Cavity |  | EOLP: Erosive Oral lichen planus |
| LP: leukoplakia | ||
| NEOLP: Non-erosive oral lichen planus | ||
| OSCC: Oral squamous cell carcinoma | ||
| Skin | 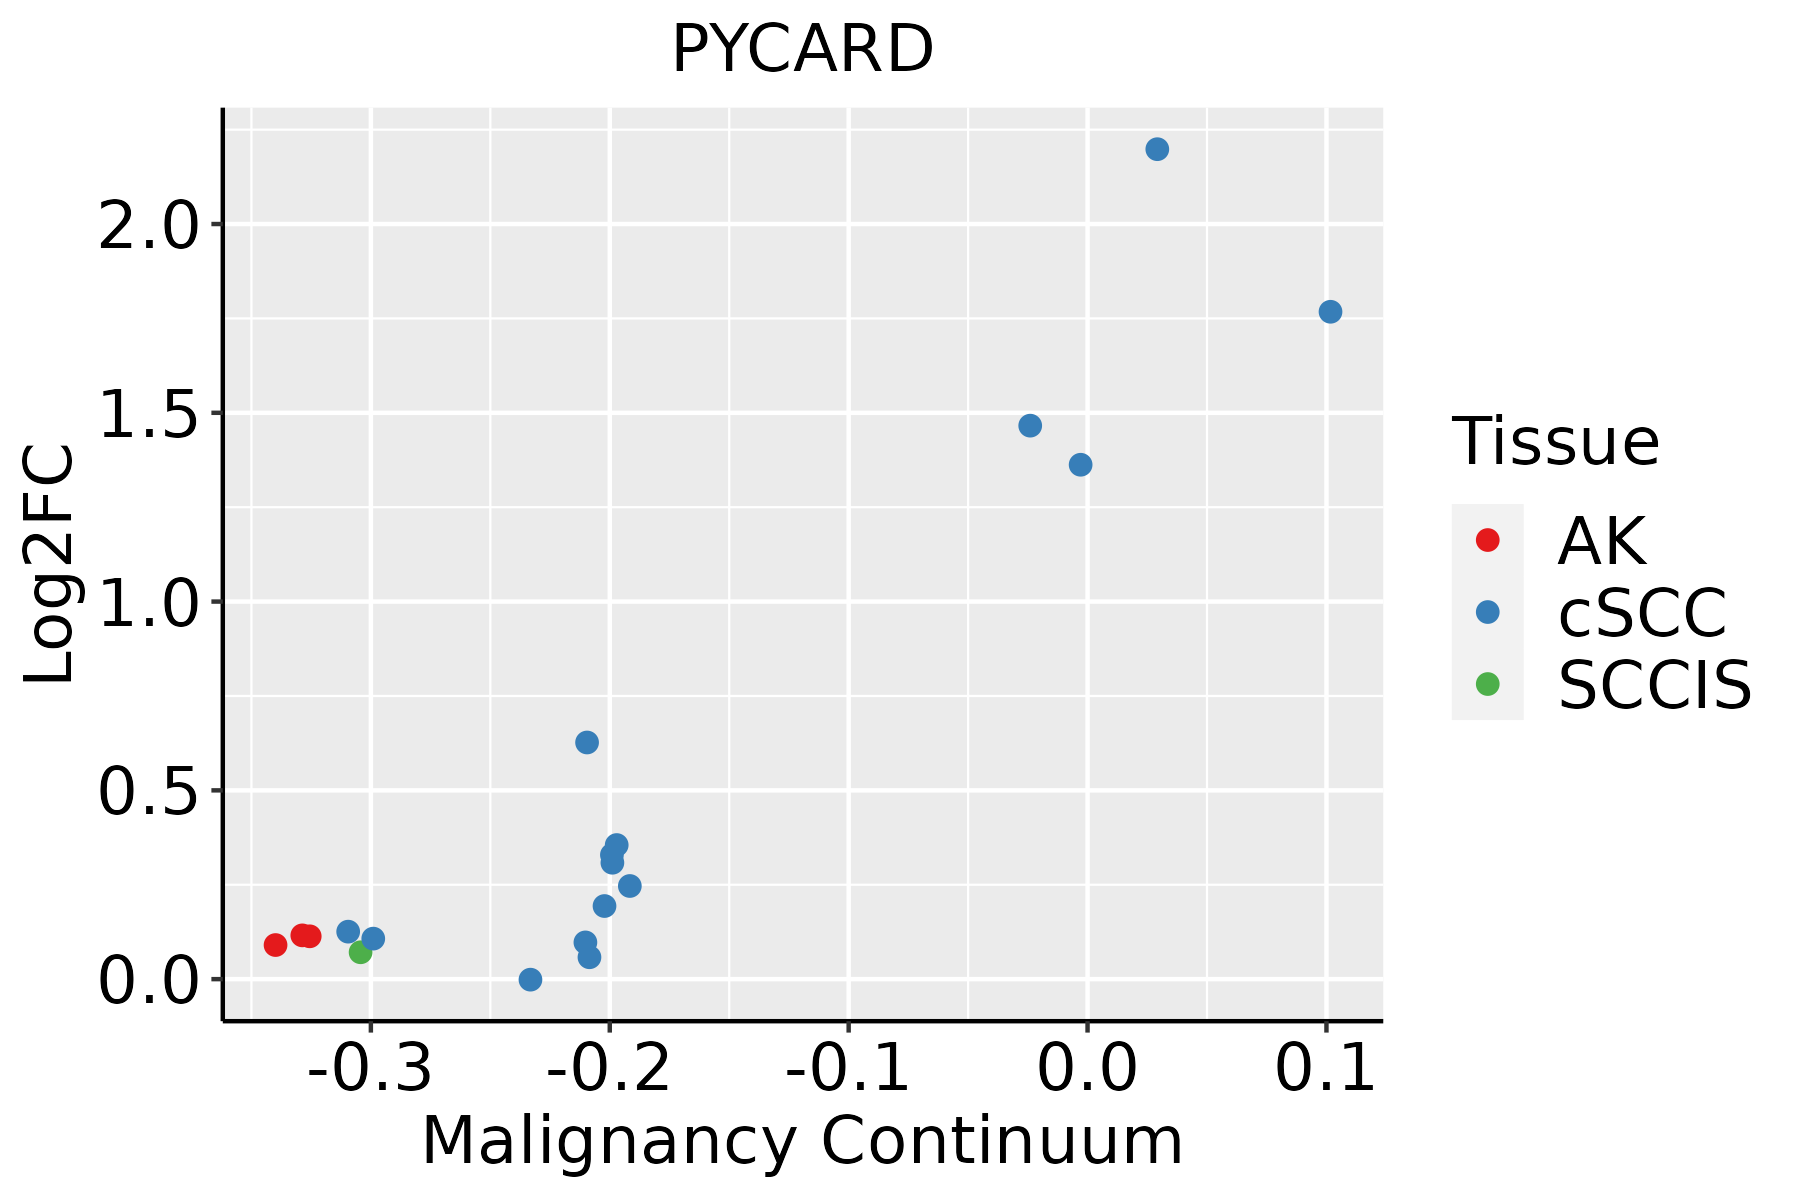 | AK: Actinic keratosis |
| cSCC: Cutaneous squamous cell carcinoma | ||
| SCCIS:squamous cell carcinoma in situ | ||
| Thyroid | 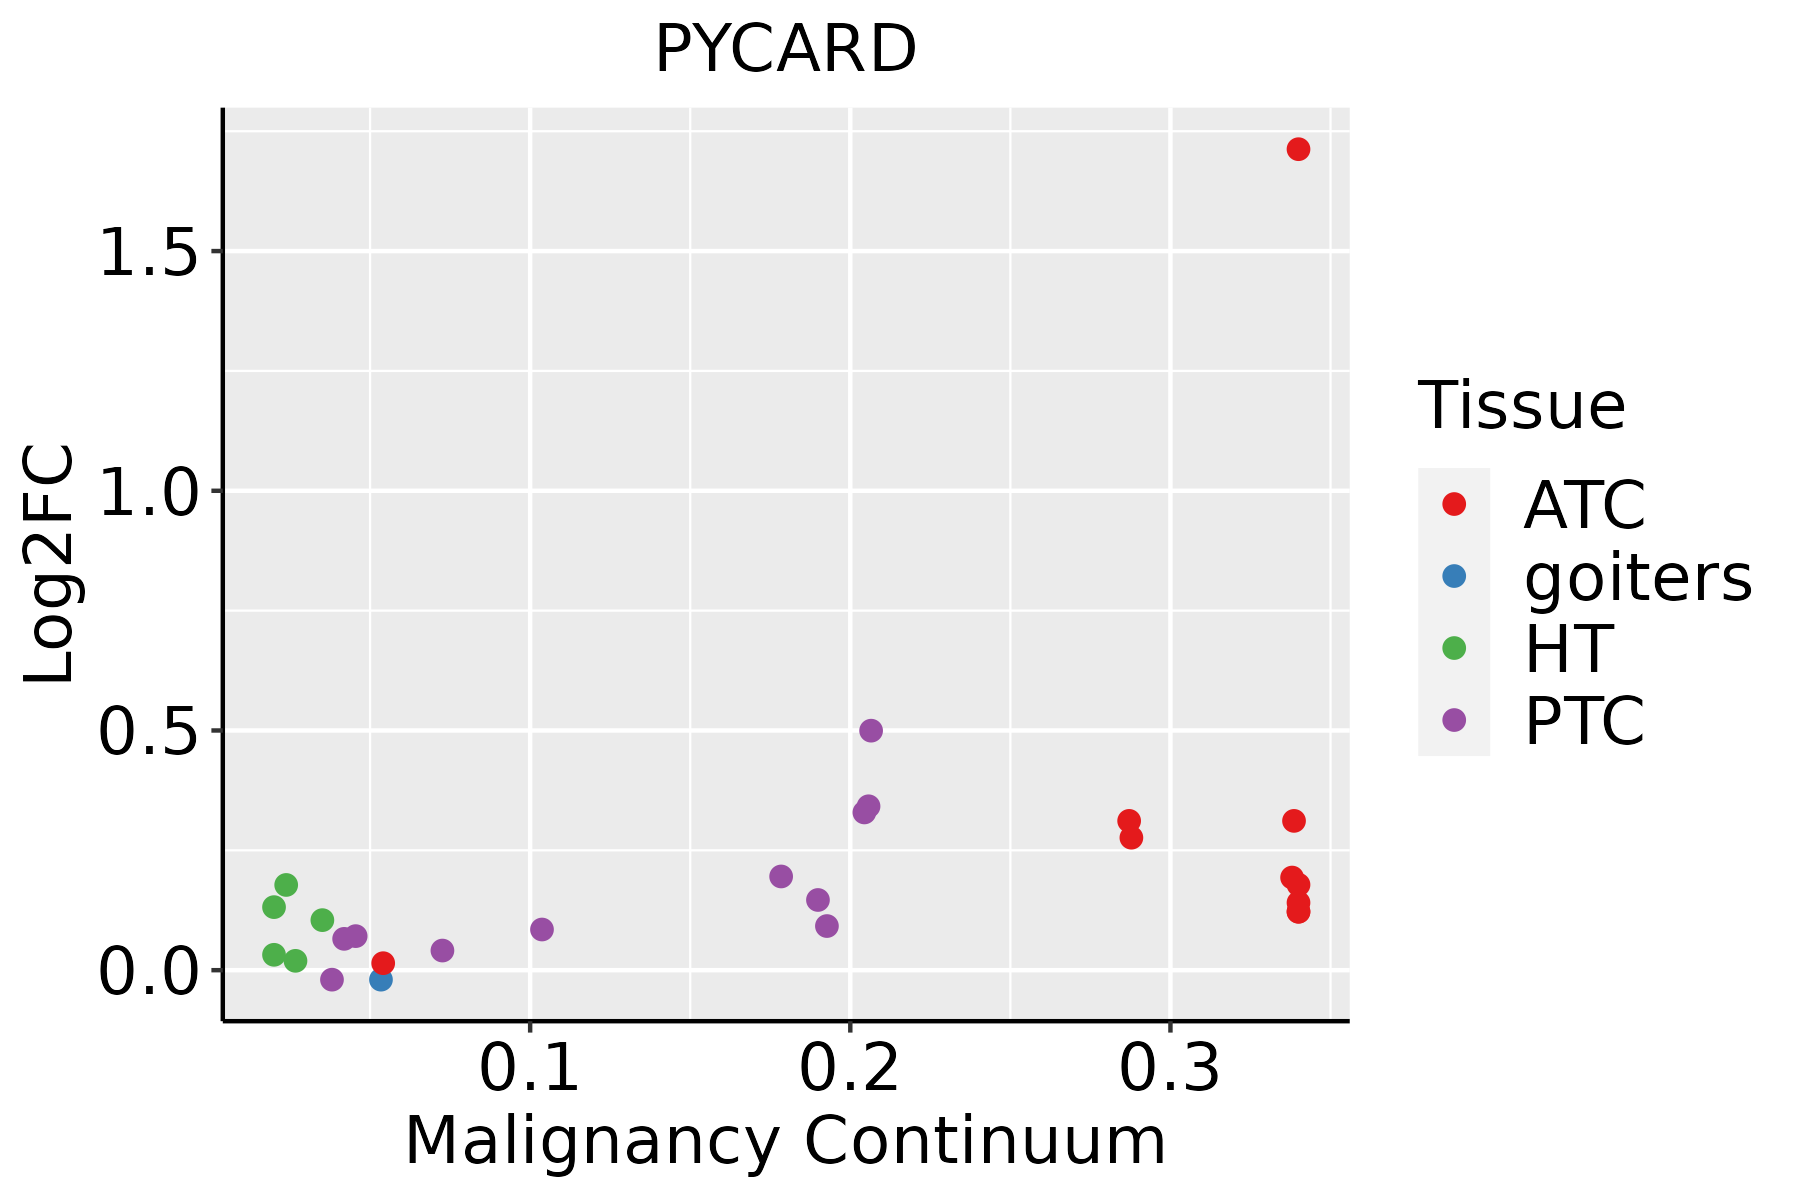 | ATC: Anaplastic thyroid cancer |
| HT: Hashimoto's thyroiditis | ||
| PTC: Papillary thyroid cancer |
| ∗log2FC in expression of this searched gene in stem-like cells from each diseased tissue sample relative to stem-like cells in normal samples in each tissue plotted against the malignancy continuum. Samples are colored based on if they are from different disease stage. |
Top |
Malignant transformation related pathway analysis |
| Find out the enriched GO biological processes and KEGG pathways involved in transition from healthy to precancer to cancer |
| Tissue | Disease Stage | Enriched GO biological Processes |
| Colorectum | AD |  |
| Colorectum | SER |  |
| Colorectum | MSS |  |
| Colorectum | MSI-H |  |
| Colorectum | FAP |  |
| ∗Top 15 enriched GO BP terms are showed in the bar plot of each disease state in each tissue. Each row represents a significant GO biological process which is colored according to the -log10(p.adjust). |
| Page: 1 2 3 4 5 6 7 8 9 |
| GO ID | Tissue | Disease Stage | Description | Gene Ratio | Bg Ratio | pvalue | p.adjust | Count |
| GO:00018364 | Stomach | SIM | release of cytochrome c from mitochondria | 13/708 | 59/18723 | 2.35e-07 | 1.68e-05 | 13 |
| GO:004578551 | Stomach | SIM | positive regulation of cell adhesion | 40/708 | 437/18723 | 2.47e-07 | 1.74e-05 | 40 |
| GO:200011651 | Stomach | SIM | regulation of cysteine-type endopeptidase activity | 27/708 | 235/18723 | 2.92e-07 | 2.03e-05 | 27 |
| GO:00024954 | Stomach | SIM | antigen processing and presentation of peptide antigen via MHC class II | 10/708 | 34/18723 | 3.23e-07 | 2.21e-05 | 10 |
| GO:00224075 | Stomach | SIM | regulation of cell-cell adhesion | 40/708 | 448/18723 | 4.73e-07 | 3.05e-05 | 40 |
| GO:00025044 | Stomach | SIM | antigen processing and presentation of peptide or polysaccharide antigen via MHC class II | 10/708 | 36/18723 | 5.84e-07 | 3.58e-05 | 10 |
| GO:00324965 | Stomach | SIM | response to lipopolysaccharide | 33/708 | 343/18723 | 9.30e-07 | 5.42e-05 | 33 |
| GO:003164751 | Stomach | SIM | regulation of protein stability | 30/708 | 298/18723 | 1.14e-06 | 6.23e-05 | 30 |
| GO:00713565 | Stomach | SIM | cellular response to tumor necrosis factor | 25/708 | 229/18723 | 2.06e-06 | 1.05e-04 | 25 |
| GO:000701541 | Stomach | SIM | actin filament organization | 38/708 | 442/18723 | 2.29e-06 | 1.15e-04 | 38 |
| GO:00508705 | Stomach | SIM | positive regulation of T cell activation | 24/708 | 216/18723 | 2.41e-06 | 1.18e-04 | 24 |
| GO:005134851 | Stomach | SIM | negative regulation of transferase activity | 27/708 | 268/18723 | 3.82e-06 | 1.68e-04 | 27 |
| GO:00224095 | Stomach | SIM | positive regulation of cell-cell adhesion | 28/708 | 284/18723 | 3.86e-06 | 1.68e-04 | 28 |
| GO:00346125 | Stomach | SIM | response to tumor necrosis factor | 26/708 | 253/18723 | 4.00e-06 | 1.70e-04 | 26 |
| GO:19030395 | Stomach | SIM | positive regulation of leukocyte cell-cell adhesion | 25/708 | 239/18723 | 4.46e-06 | 1.88e-04 | 25 |
| GO:00432815 | Stomach | SIM | regulation of cysteine-type endopeptidase activity involved in apoptotic process | 23/708 | 209/18723 | 4.58e-06 | 1.89e-04 | 23 |
| GO:190290551 | Stomach | SIM | positive regulation of supramolecular fiber organization | 23/708 | 209/18723 | 4.58e-06 | 1.89e-04 | 23 |
| GO:19030375 | Stomach | SIM | regulation of leukocyte cell-cell adhesion | 31/708 | 336/18723 | 4.73e-06 | 1.94e-04 | 31 |
| GO:00071595 | Stomach | SIM | leukocyte cell-cell adhesion | 33/708 | 371/18723 | 5.16e-06 | 2.08e-04 | 33 |
| GO:004325441 | Stomach | SIM | regulation of protein-containing complex assembly | 36/708 | 428/18723 | 6.89e-06 | 2.71e-04 | 36 |
| Page: 1 2 3 4 5 6 7 8 9 10 11 12 13 14 15 16 17 18 19 20 21 22 23 24 25 26 27 28 29 30 31 32 33 34 35 36 37 38 39 40 41 42 43 44 45 46 47 48 49 50 51 52 53 54 55 56 57 58 59 60 61 62 63 64 65 66 67 68 69 70 71 72 73 74 75 76 77 78 79 80 81 82 83 84 85 |
| Pathway ID | Tissue | Disease Stage | Description | Gene Ratio | Bg Ratio | pvalue | p.adjust | qvalue | Count |
| hsa0513224 | Breast | IDC | Salmonella infection | 55/867 | 249/8465 | 2.07e-08 | 4.49e-07 | 3.36e-07 | 55 |
| hsa0513422 | Breast | IDC | Legionellosis | 19/867 | 57/8465 | 1.89e-06 | 3.07e-05 | 2.29e-05 | 19 |
| hsa0513024 | Breast | IDC | Pathogenic Escherichia coli infection | 42/867 | 197/8465 | 2.66e-06 | 3.92e-05 | 2.94e-05 | 42 |
| hsa0513124 | Breast | IDC | Shigellosis | 47/867 | 247/8465 | 1.78e-05 | 2.00e-04 | 1.49e-04 | 47 |
| hsa0541724 | Breast | IDC | Lipid and atherosclerosis | 35/867 | 215/8465 | 3.67e-03 | 2.29e-02 | 1.71e-02 | 35 |
| hsa0513234 | Breast | IDC | Salmonella infection | 55/867 | 249/8465 | 2.07e-08 | 4.49e-07 | 3.36e-07 | 55 |
| hsa0513432 | Breast | IDC | Legionellosis | 19/867 | 57/8465 | 1.89e-06 | 3.07e-05 | 2.29e-05 | 19 |
| hsa0513034 | Breast | IDC | Pathogenic Escherichia coli infection | 42/867 | 197/8465 | 2.66e-06 | 3.92e-05 | 2.94e-05 | 42 |
| hsa0513134 | Breast | IDC | Shigellosis | 47/867 | 247/8465 | 1.78e-05 | 2.00e-04 | 1.49e-04 | 47 |
| hsa0541734 | Breast | IDC | Lipid and atherosclerosis | 35/867 | 215/8465 | 3.67e-03 | 2.29e-02 | 1.71e-02 | 35 |
| hsa0513243 | Breast | DCIS | Salmonella infection | 55/846 | 249/8465 | 8.71e-09 | 1.87e-07 | 1.38e-07 | 55 |
| hsa0513441 | Breast | DCIS | Legionellosis | 19/846 | 57/8465 | 1.30e-06 | 2.10e-05 | 1.55e-05 | 19 |
| hsa0513043 | Breast | DCIS | Pathogenic Escherichia coli infection | 42/846 | 197/8465 | 1.40e-06 | 2.15e-05 | 1.59e-05 | 42 |
| hsa0513144 | Breast | DCIS | Shigellosis | 46/846 | 247/8465 | 2.06e-05 | 2.38e-04 | 1.75e-04 | 46 |
| hsa0541744 | Breast | DCIS | Lipid and atherosclerosis | 34/846 | 215/8465 | 4.50e-03 | 2.46e-02 | 1.82e-02 | 34 |
| hsa051336 | Breast | DCIS | Pertussis | 15/846 | 76/8465 | 7.42e-03 | 3.48e-02 | 2.56e-02 | 15 |
| hsa0513253 | Breast | DCIS | Salmonella infection | 55/846 | 249/8465 | 8.71e-09 | 1.87e-07 | 1.38e-07 | 55 |
| hsa0513451 | Breast | DCIS | Legionellosis | 19/846 | 57/8465 | 1.30e-06 | 2.10e-05 | 1.55e-05 | 19 |
| hsa0513053 | Breast | DCIS | Pathogenic Escherichia coli infection | 42/846 | 197/8465 | 1.40e-06 | 2.15e-05 | 1.59e-05 | 42 |
| hsa0513154 | Breast | DCIS | Shigellosis | 46/846 | 247/8465 | 2.06e-05 | 2.38e-04 | 1.75e-04 | 46 |
| Page: 1 2 3 4 5 6 7 8 9 10 11 |
Top |
Cell-cell communication analysis |
| Identification of potential cell-cell interactions between two cell types and their ligand-receptor pairs for different disease states |
| Ligand | Receptor | LRpair | Pathway | Tissue | Disease Stage |
| Page: 1 |
Top |
Single-cell gene regulatory network inference analysis |
| Find out the significant the regulons (TFs) and the target genes of each regulon across cell types for different disease states |
| TF | Cell Type | Tissue | Disease Stage | Target Gene | RSS | Regulon Activity |
| ∗The dot plots of a searched regulon are shown for all cell subpopulations in each disease state of each tissue based on the regulon specific score inferred using pySCENIC and by calculating the average expression. |
| Page: 1 |
Top |
Somatic mutation of malignant transformation related genes |
| Annotation of somatic variants for genes involved in malignant transformation |
| Hugo Symbol | Variant Class | Variant Classification | dbSNP RS | HGVSc | HGVSp | HGVSp Short | SWISSPROT | BIOTYPE | SIFT | PolyPhen | Tumor Sample Barcode | Tissue | Histology | Sex | Age | Stage | Therapy Types | Drugs | Outcome |
| PYCARD | insertion | Nonsense_Mutation | novel | c.461_462insTTAGGAATCACCAAA | p.Thr154_Asn155insTer | p.T154_N155ins* | Q9ULZ3 | protein_coding | TCGA-A8-A097-01 | Breast | breast invasive carcinoma | Female | >=65 | I/II | Hormone Therapy | tamoxiphen | SD | ||
| PYCARD | insertion | Frame_Shift_Ins | novel | c.525_526insCACCATGCCCAGCTGACTG | p.Leu176HisfsTer60 | p.L176Hfs*60 | Q9ULZ3 | protein_coding | TCGA-B6-A0RE-01 | Breast | breast invasive carcinoma | Female | <65 | I/II | Unknown | Unknown | SD | ||
| PYCARD | deletion | Frame_Shift_Del | novel | c.88delG | p.Val30CysfsTer86 | p.V30Cfs*86 | Q9ULZ3 | protein_coding | TCGA-D8-A27V-01 | Breast | breast invasive carcinoma | Female | <65 | I/II | Hormone Therapy | tamoxiphen | SD | ||
| PYCARD | SNV | Missense_Mutation | c.237G>T | p.Gln79His | p.Q79H | Q9ULZ3 | protein_coding | deleterious(0.02) | benign(0.003) | TCGA-AZ-6598-01 | Colorectum | colon adenocarcinoma | Female | >=65 | I/II | Unknown | Unknown | SD | |
| PYCARD | SNV | Missense_Mutation | novel | c.484C>T | p.Leu162Phe | p.L162F | Q9ULZ3 | protein_coding | deleterious(0) | probably_damaging(1) | TCGA-CA-6717-01 | Colorectum | colon adenocarcinoma | Male | <65 | I/II | Chemotherapy | oxaliplatin | CR |
| PYCARD | SNV | Missense_Mutation | c.340N>G | p.Phe114Val | p.F114V | Q9ULZ3 | protein_coding | deleterious(0) | probably_damaging(1) | TCGA-DY-A1DG-01 | Colorectum | rectum adenocarcinoma | Male | >=65 | I/II | Unknown | Unknown | PD | |
| PYCARD | SNV | Missense_Mutation | novel | c.406N>A | p.Leu136Met | p.L136M | Q9ULZ3 | protein_coding | deleterious(0) | probably_damaging(1) | TCGA-AJ-A5DW-01 | Endometrium | uterine corpus endometrioid carcinoma | Female | <65 | I/II | Unknown | Unknown | SD |
| PYCARD | SNV | Missense_Mutation | novel | c.448N>T | p.Arg150Trp | p.R150W | Q9ULZ3 | protein_coding | deleterious(0.03) | probably_damaging(0.93) | TCGA-B5-A5OC-01 | Endometrium | uterine corpus endometrioid carcinoma | Female | >=65 | III/IV | Chemotherapy | cisplatin | SD |
| PYCARD | SNV | Missense_Mutation | novel | c.496N>G | p.Thr166Ala | p.T166A | Q9ULZ3 | protein_coding | tolerated(0.97) | benign(0) | TCGA-D1-A175-01 | Endometrium | uterine corpus endometrioid carcinoma | Female | <65 | I/II | Chemotherapy | paclitaxel | SD |
| PYCARD | SNV | Missense_Mutation | novel | c.146N>T | p.Ala49Val | p.A49V | Q9ULZ3 | protein_coding | tolerated(0.16) | benign(0.105) | TCGA-DF-A2KU-01 | Endometrium | uterine corpus endometrioid carcinoma | Female | Unknown | I/II | Unknown | Unknown | SD |
| Page: 1 2 |
Top |
Related drugs of malignant transformation related genes |
| Identification of chemicals and drugs interact with genes involved in malignant transfromation |
| (DGIdb 4.0) |
| Entrez ID | Symbol | Category | Interaction Types | Drug Claim Name | Drug Name | PMIDs |
| Page: 1 |

Copyright 2023-Present -The University of Texas Health Science Center at Houston |