
|
|||||
|
 | |
| |
| |
| |
| |
| |
|
Gene: PAK1 |
Gene summary for PAK1 |
| Gene information | Species | Human | Gene symbol | PAK1 | Gene ID | 5058 |
| Gene name | p21 (RAC1) activated kinase 1 | |
| Gene Alias | IDDMSSD | |
| Cytomap | 11q13.5-q14.1 | |
| Gene Type | protein-coding | GO ID | GO:0000165 | UniProtAcc | Q13153 |
Top |
Malignant transformation analysis |
| Identification of the aberrant gene expression in precancerous and cancerous lesions by comparing the gene expression of stem-like cells in diseased tissues with normal stem cells |
| Entrez ID | Symbol | Replicates | Species | Organ | Tissue | Adj P-value | Log2FC | Malignancy |
| 5058 | PAK1 | GSM4909298 | Human | Breast | IDC | 3.08e-40 | 6.68e-01 | 0.1551 |
| 5058 | PAK1 | GSM4909311 | Human | Breast | IDC | 5.44e-03 | 7.34e-04 | 0.1534 |
| 5058 | PAK1 | GSM4909319 | Human | Breast | IDC | 2.52e-05 | -1.05e-01 | 0.1563 |
| 5058 | PAK1 | M5 | Human | Breast | IDC | 1.90e-17 | 1.14e+00 | 0.1598 |
| 5058 | PAK1 | P1 | Human | Breast | IDC | 3.63e-02 | -4.05e-02 | 0.1527 |
| 5058 | PAK1 | P3 | Human | Breast | IDC | 5.03e-07 | 6.75e-01 | 0.1542 |
| 5058 | PAK1 | DCIS2 | Human | Breast | DCIS | 6.51e-26 | 1.62e-02 | 0.0085 |
| 5058 | PAK1 | HTA11_3410_2000001011 | Human | Colorectum | AD | 1.40e-07 | -3.60e-01 | 0.0155 |
| 5058 | PAK1 | HTA11_347_2000001011 | Human | Colorectum | AD | 1.08e-10 | 5.36e-01 | -0.1954 |
| 5058 | PAK1 | HTA11_411_2000001011 | Human | Colorectum | SER | 5.60e-06 | 8.85e-01 | -0.2602 |
| 5058 | PAK1 | HTA11_99999965104_69814 | Human | Colorectum | MSS | 7.17e-03 | 4.66e-01 | 0.281 |
| 5058 | PAK1 | HTA11_99999974143_84620 | Human | Colorectum | MSS | 7.76e-04 | -3.28e-01 | 0.3005 |
| 5058 | PAK1 | A001-C-207 | Human | Colorectum | FAP | 3.99e-02 | -1.76e-01 | 0.1278 |
| 5058 | PAK1 | A015-C-203 | Human | Colorectum | FAP | 1.14e-28 | -4.50e-01 | -0.1294 |
| 5058 | PAK1 | A015-C-204 | Human | Colorectum | FAP | 8.87e-09 | -4.78e-01 | -0.0228 |
| 5058 | PAK1 | A014-C-040 | Human | Colorectum | FAP | 8.12e-03 | -4.15e-01 | -0.1184 |
| 5058 | PAK1 | A002-C-201 | Human | Colorectum | FAP | 6.27e-15 | -4.77e-01 | 0.0324 |
| 5058 | PAK1 | A001-C-119 | Human | Colorectum | FAP | 1.07e-06 | -4.71e-01 | -0.1557 |
| 5058 | PAK1 | A001-C-108 | Human | Colorectum | FAP | 5.72e-23 | -4.29e-01 | -0.0272 |
| 5058 | PAK1 | A002-C-205 | Human | Colorectum | FAP | 6.42e-22 | -4.86e-01 | -0.1236 |
| Page: 1 2 3 4 5 6 7 8 9 |
| Tissue | Expression Dynamics | Abbreviation |
| Breast | 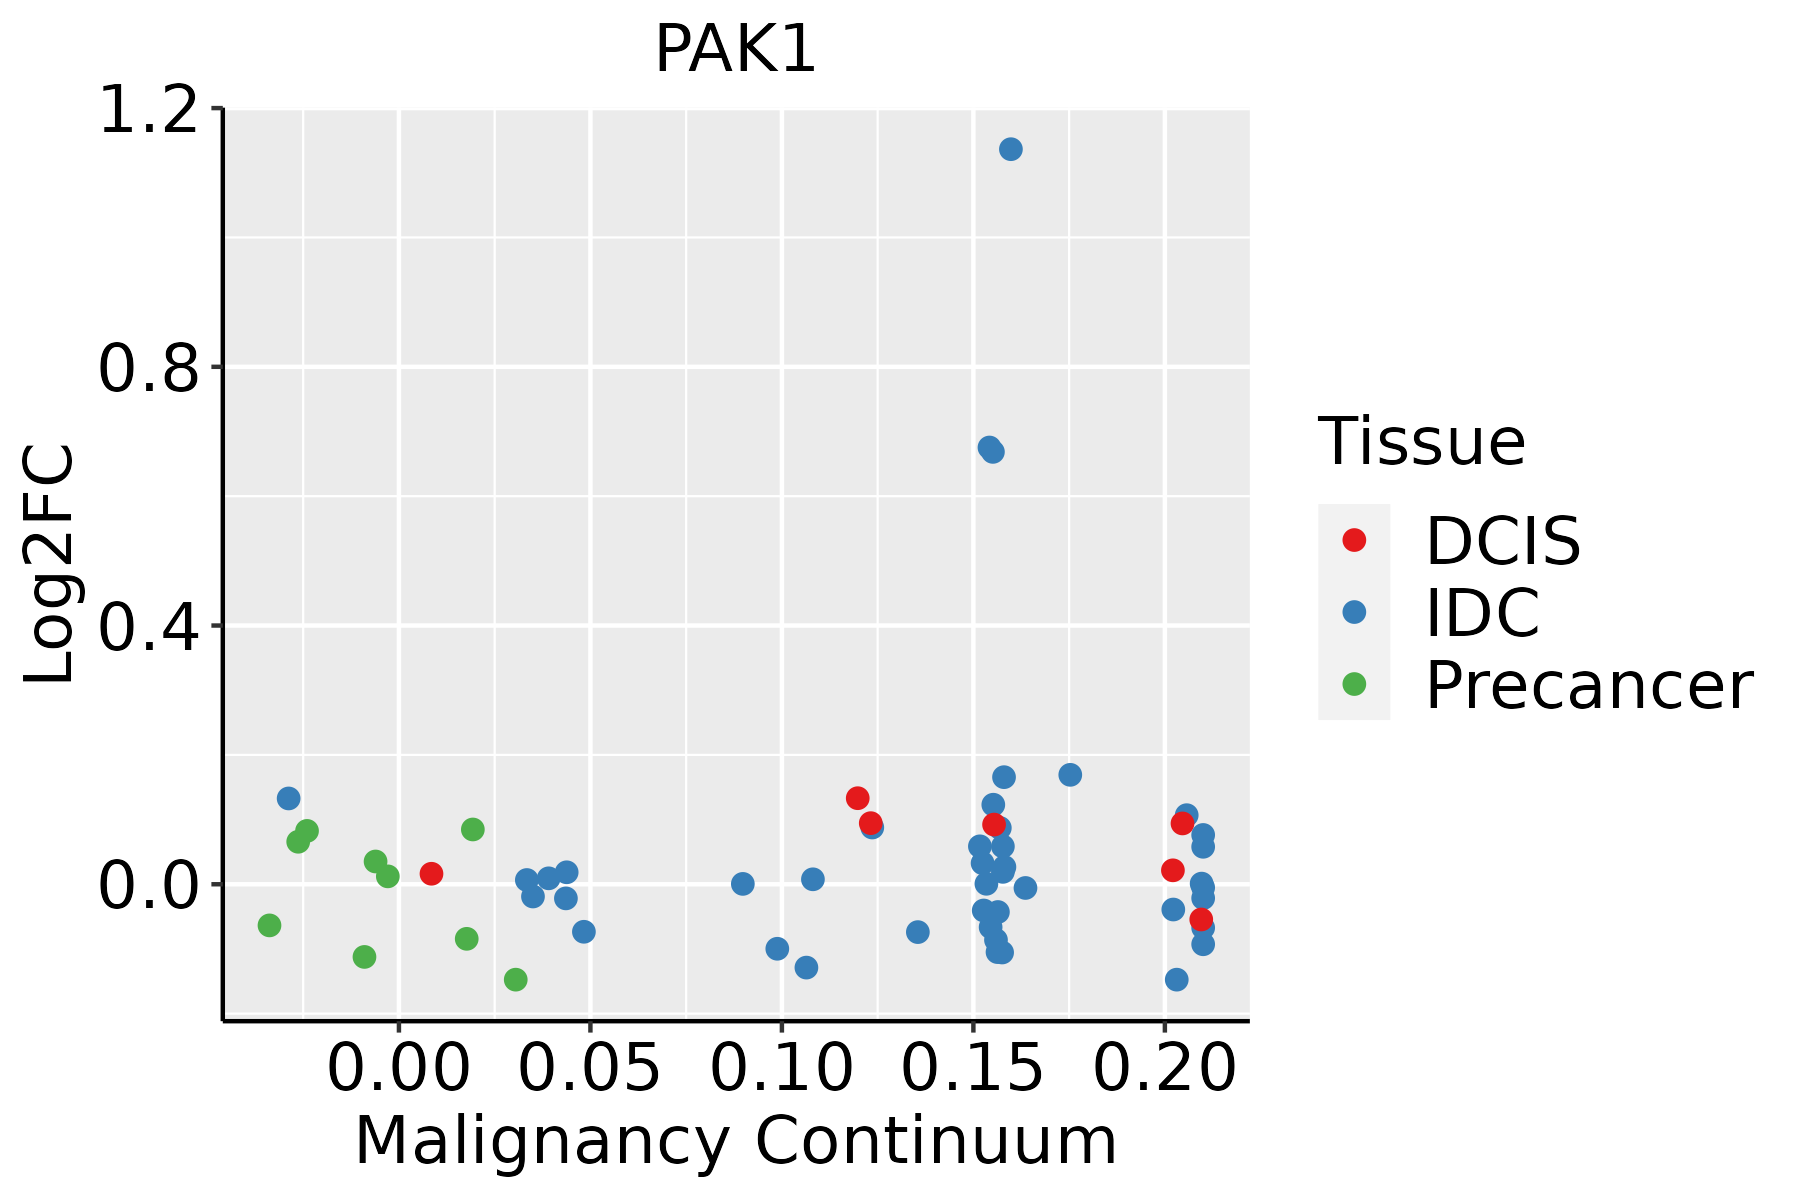 | IDC: Invasive ductal carcinoma |
| DCIS: Ductal carcinoma in situ | ||
| Precancer(BRCA1-mut): Precancerous lesion from BRCA1 mutation carriers | ||
| Colorectum (GSE201348) |  | FAP: Familial adenomatous polyposis |
| CRC: Colorectal cancer | ||
| Colorectum (HTA11) | 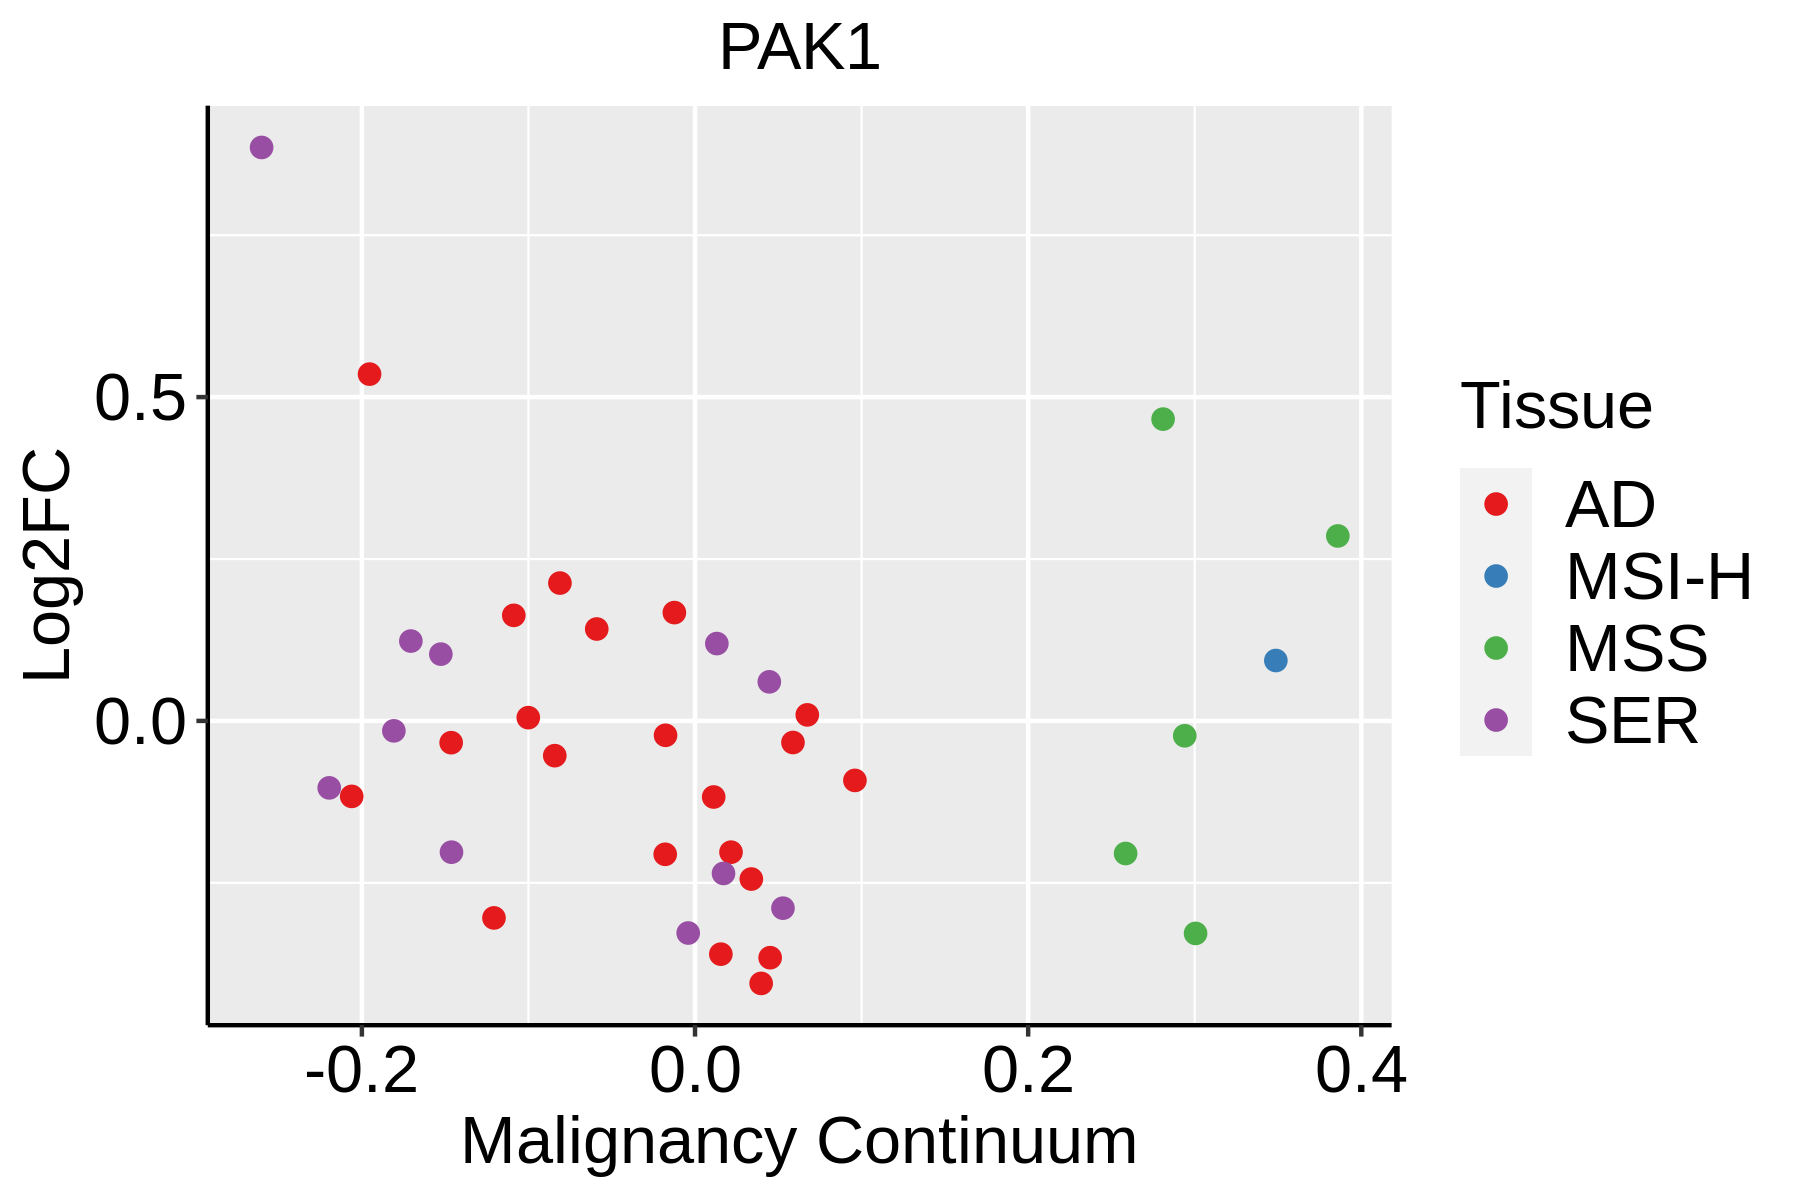 | AD: Adenomas |
| SER: Sessile serrated lesions | ||
| MSI-H: Microsatellite-high colorectal cancer | ||
| MSS: Microsatellite stable colorectal cancer | ||
| Endometrium | 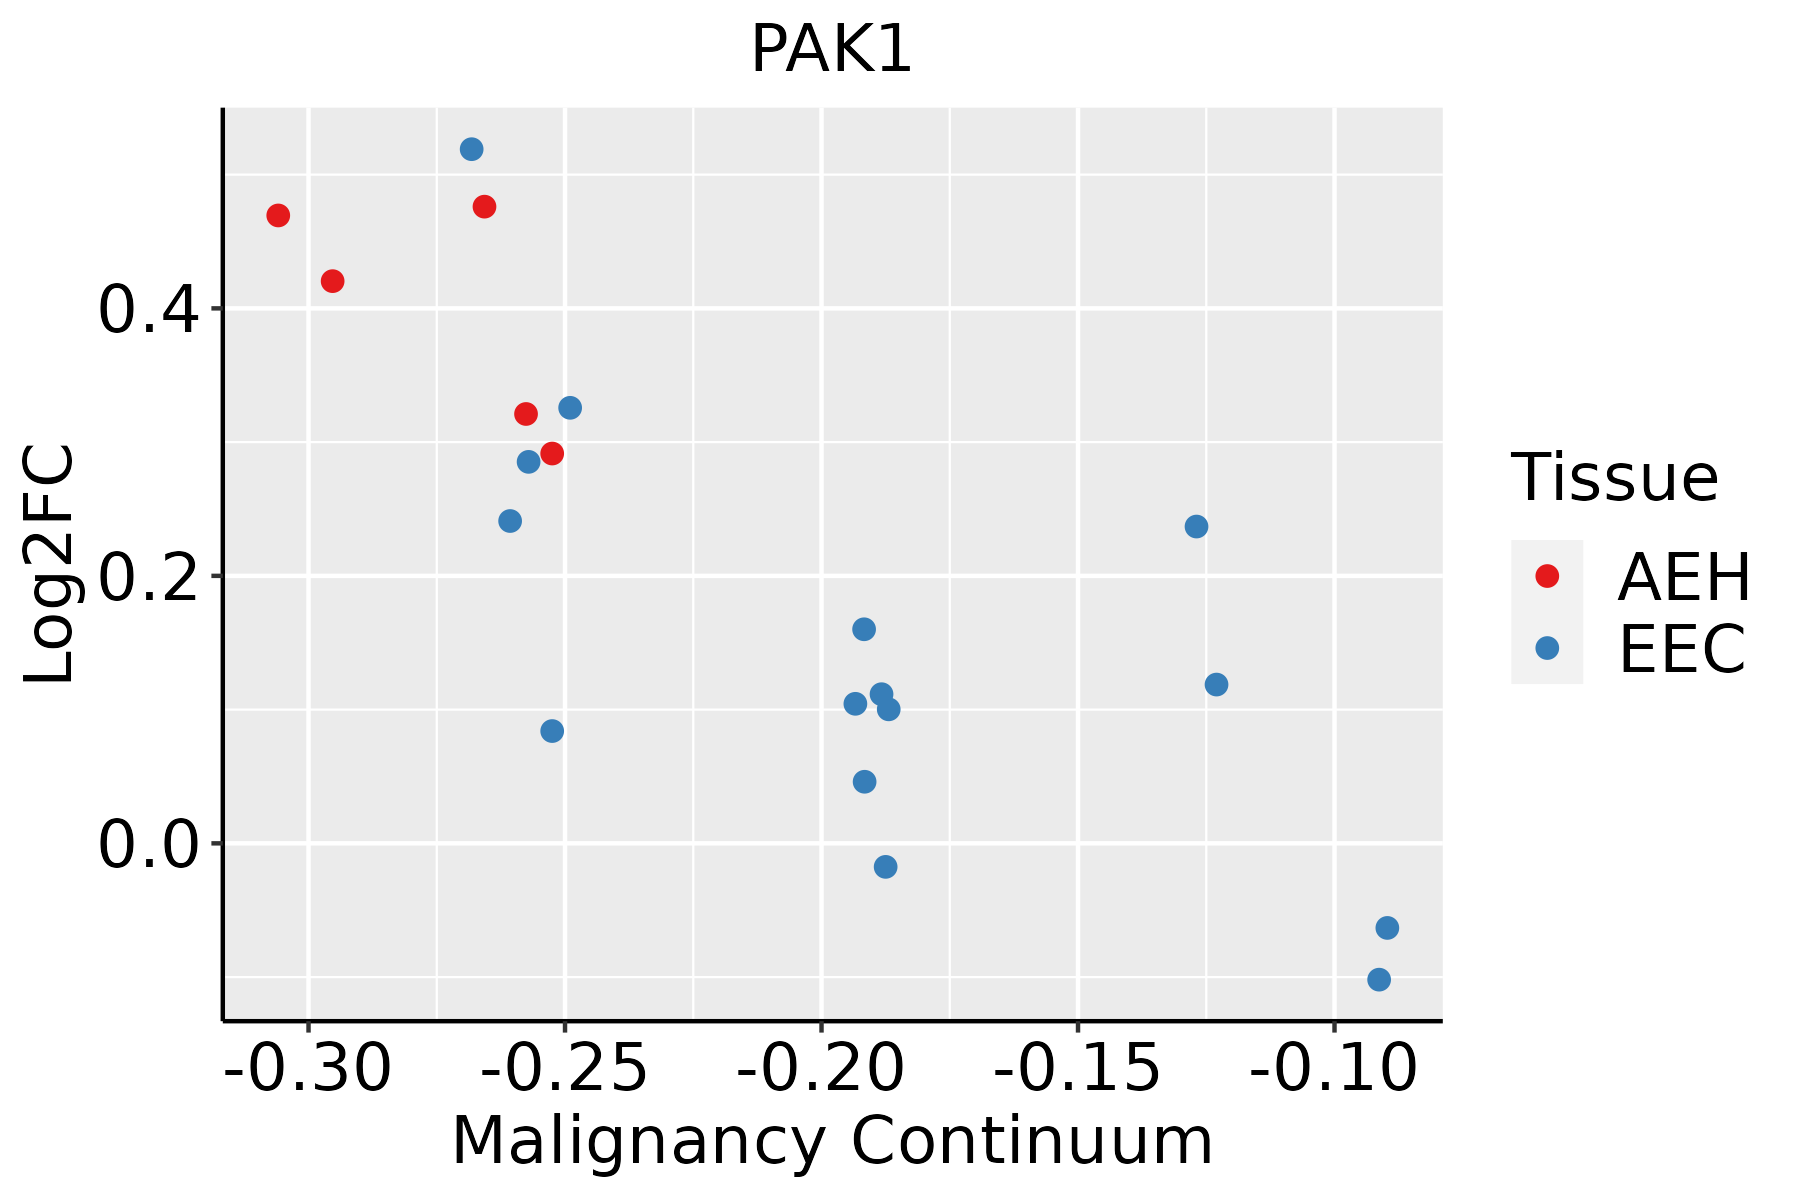 | AEH: Atypical endometrial hyperplasia |
| EEC: Endometrioid Cancer | ||
| Esophagus | 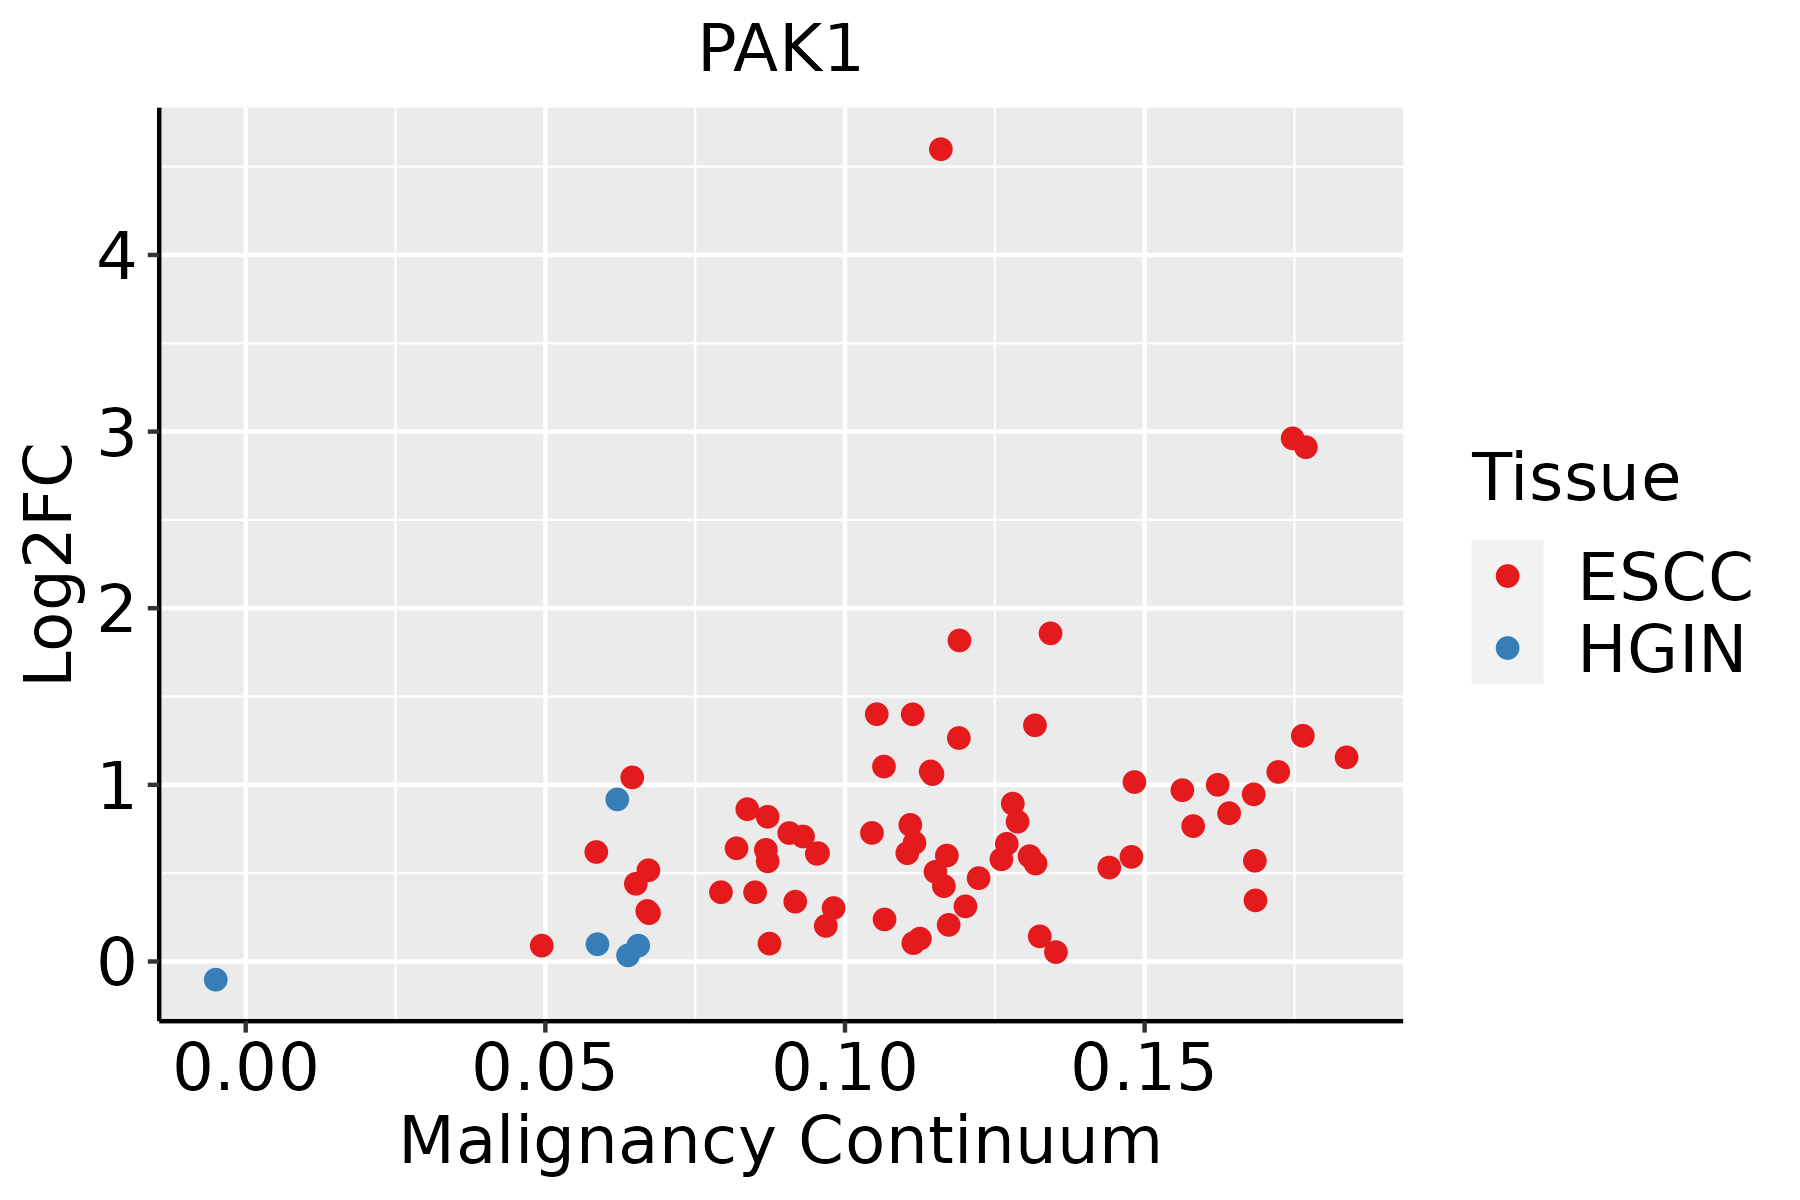 | ESCC: Esophageal squamous cell carcinoma |
| HGIN: High-grade intraepithelial neoplasias | ||
| LGIN: Low-grade intraepithelial neoplasias | ||
| Liver | 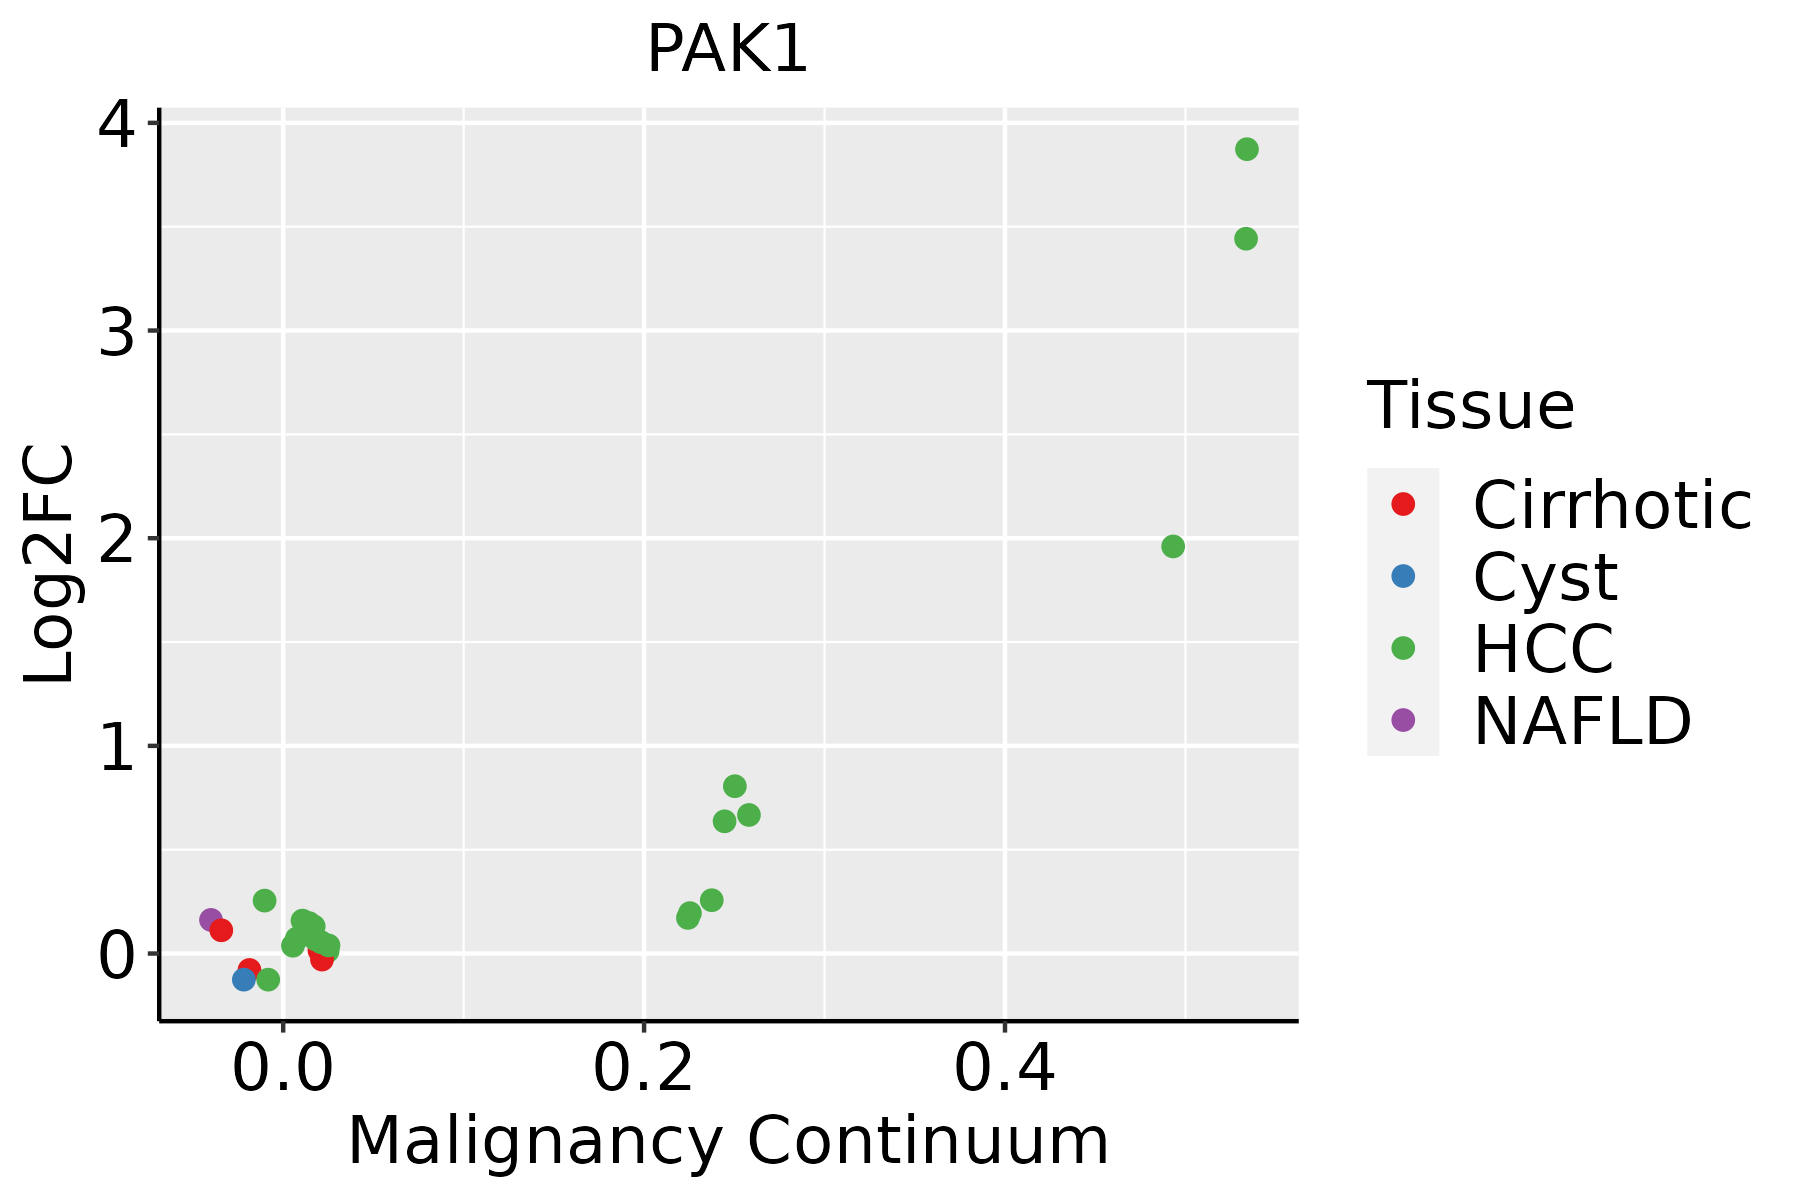 | HCC: Hepatocellular carcinoma |
| NAFLD: Non-alcoholic fatty liver disease | ||
| Lung | 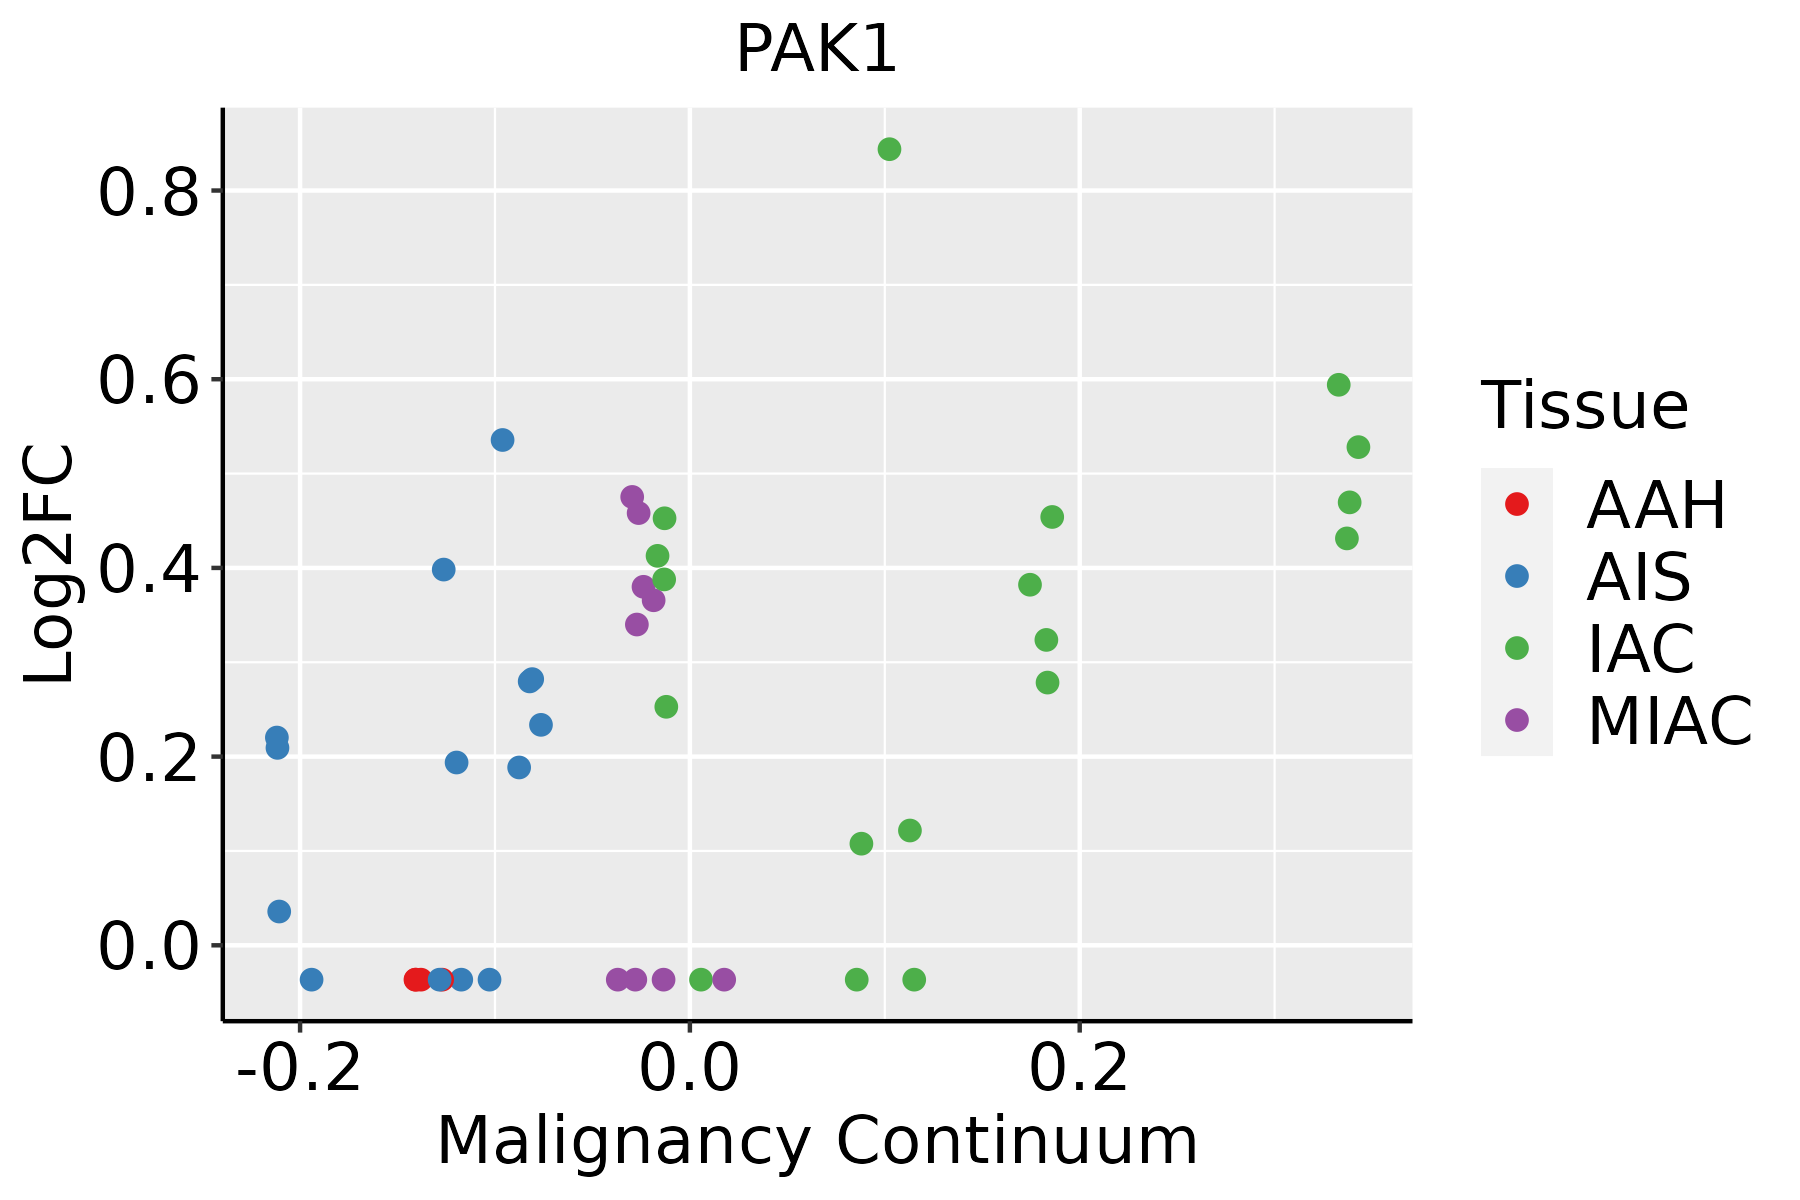 | AAH: Atypical adenomatous hyperplasia |
| AIS: Adenocarcinoma in situ | ||
| IAC: Invasive lung adenocarcinoma | ||
| MIA: Minimally invasive adenocarcinoma | ||
| Oral Cavity | 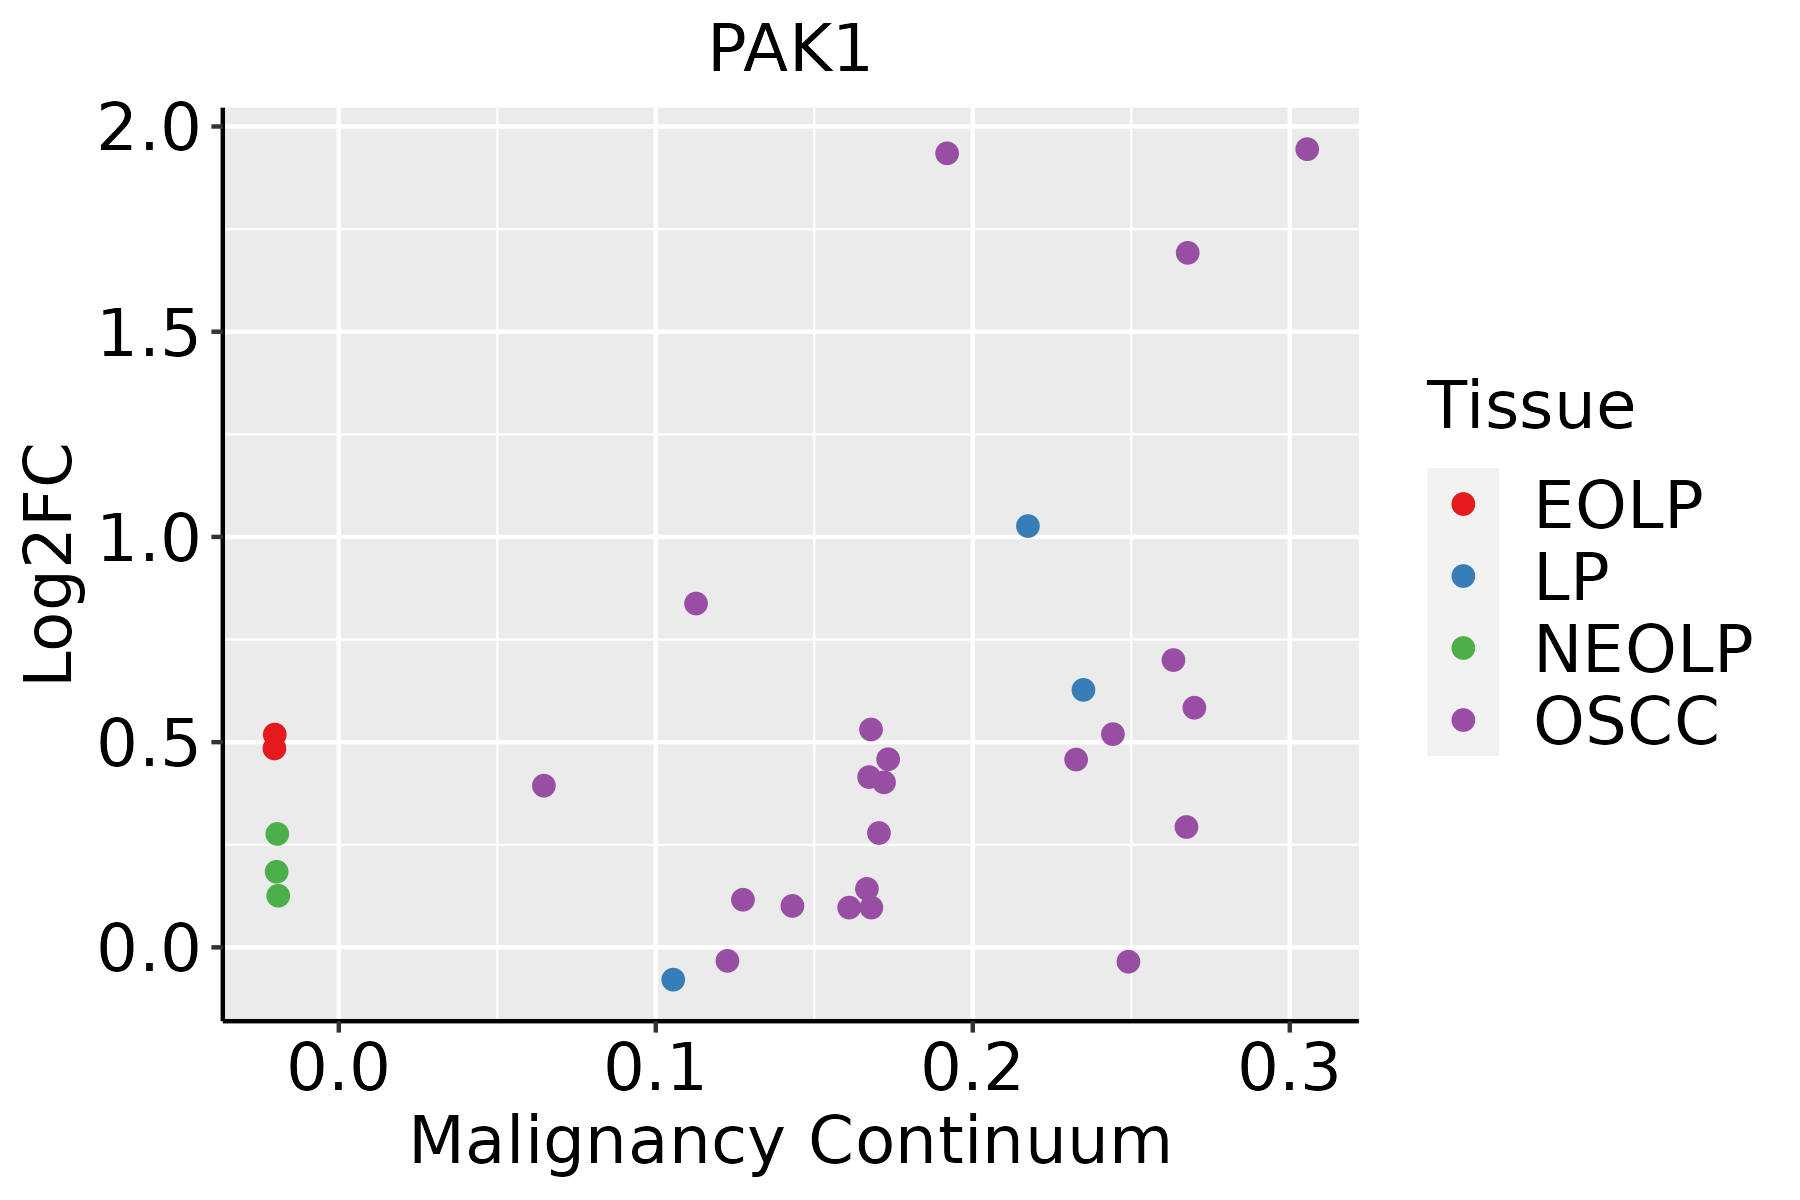 | EOLP: Erosive Oral lichen planus |
| LP: leukoplakia | ||
| NEOLP: Non-erosive oral lichen planus | ||
| OSCC: Oral squamous cell carcinoma | ||
| Skin |  | AK: Actinic keratosis |
| cSCC: Cutaneous squamous cell carcinoma | ||
| SCCIS:squamous cell carcinoma in situ | ||
| Thyroid |  | ATC: Anaplastic thyroid cancer |
| HT: Hashimoto's thyroiditis | ||
| PTC: Papillary thyroid cancer |
| ∗log2FC in expression of this searched gene in stem-like cells from each diseased tissue sample relative to stem-like cells in normal samples in each tissue plotted against the malignancy continuum. Samples are colored based on if they are from different disease stage. |
Top |
Malignant transformation related pathway analysis |
| Find out the enriched GO biological processes and KEGG pathways involved in transition from healthy to precancer to cancer |
| Tissue | Disease Stage | Enriched GO biological Processes |
| Colorectum | AD |  |
| Colorectum | SER |  |
| Colorectum | MSS |  |
| Colorectum | MSI-H |  |
| Colorectum | FAP |  |
| ∗Top 15 enriched GO BP terms are showed in the bar plot of each disease state in each tissue. Each row represents a significant GO biological process which is colored according to the -log10(p.adjust). |
| Page: 1 2 3 4 5 6 7 8 9 |
| GO ID | Tissue | Disease Stage | Description | Gene Ratio | Bg Ratio | pvalue | p.adjust | Count |
| GO:003227120 | Oral cavity | OSCC | regulation of protein polymerization | 134/7305 | 233/18723 | 7.20e-09 | 1.51e-07 | 134 |
| GO:003052218 | Oral cavity | OSCC | intracellular receptor signaling pathway | 149/7305 | 265/18723 | 8.69e-09 | 1.81e-07 | 149 |
| GO:000701520 | Oral cavity | OSCC | actin filament organization | 230/7305 | 442/18723 | 1.37e-08 | 2.77e-07 | 230 |
| GO:190547516 | Oral cavity | OSCC | regulation of protein localization to membrane | 105/7305 | 175/18723 | 1.42e-08 | 2.85e-07 | 105 |
| GO:00028317 | Oral cavity | OSCC | regulation of response to biotic stimulus | 177/7305 | 327/18723 | 1.73e-08 | 3.43e-07 | 177 |
| GO:003297020 | Oral cavity | OSCC | regulation of actin filament-based process | 209/7305 | 397/18723 | 1.89e-08 | 3.72e-07 | 209 |
| GO:003253519 | Oral cavity | OSCC | regulation of cellular component size | 201/7305 | 383/18723 | 4.80e-08 | 8.88e-07 | 201 |
| GO:190179620 | Oral cavity | OSCC | regulation of signal transduction by p53 class mediator | 62/7305 | 93/18723 | 5.99e-08 | 1.09e-06 | 62 |
| GO:003295620 | Oral cavity | OSCC | regulation of actin cytoskeleton organization | 189/7305 | 358/18723 | 6.81e-08 | 1.21e-06 | 189 |
| GO:011005320 | Oral cavity | OSCC | regulation of actin filament organization | 150/7305 | 278/18723 | 2.68e-07 | 4.15e-06 | 150 |
| GO:00107209 | Oral cavity | OSCC | positive regulation of cell development | 159/7305 | 298/18723 | 3.06e-07 | 4.66e-06 | 159 |
| GO:003286916 | Oral cavity | OSCC | cellular response to insulin stimulus | 114/7305 | 203/18723 | 5.07e-07 | 7.41e-06 | 114 |
| GO:00459266 | Oral cavity | OSCC | negative regulation of growth | 135/7305 | 249/18723 | 7.29e-07 | 1.03e-05 | 135 |
| GO:00434054 | Oral cavity | OSCC | regulation of MAP kinase activity | 101/7305 | 177/18723 | 8.13e-07 | 1.12e-05 | 101 |
| GO:00070204 | Oral cavity | OSCC | microtubule nucleation | 28/7305 | 35/18723 | 8.71e-07 | 1.19e-05 | 28 |
| GO:00182098 | Oral cavity | OSCC | peptidyl-serine modification | 175/7305 | 338/18723 | 1.09e-06 | 1.46e-05 | 175 |
| GO:007137510 | Oral cavity | OSCC | cellular response to peptide hormone stimulus | 153/7305 | 290/18723 | 1.23e-06 | 1.63e-05 | 153 |
| GO:001810510 | Oral cavity | OSCC | peptidyl-serine phosphorylation | 164/7305 | 315/18723 | 1.51e-06 | 1.99e-05 | 164 |
| GO:004343419 | Oral cavity | OSCC | response to peptide hormone | 208/7305 | 414/18723 | 1.83e-06 | 2.35e-05 | 208 |
| GO:00467779 | Oral cavity | OSCC | protein autophosphorylation | 123/7305 | 227/18723 | 2.31e-06 | 2.93e-05 | 123 |
| Page: 1 2 3 4 5 6 7 8 9 10 11 12 13 14 15 16 17 18 19 20 21 22 23 24 25 26 27 28 29 30 31 32 33 34 35 36 37 38 39 40 41 42 43 44 45 46 47 48 49 50 51 52 53 54 55 56 57 58 59 60 61 62 63 64 65 66 67 68 69 70 71 72 73 74 75 76 77 78 79 80 81 82 83 84 85 86 87 88 89 90 91 92 93 94 95 96 97 98 99 100 101 102 103 104 105 106 107 108 109 110 111 |
| Pathway ID | Tissue | Disease Stage | Description | Gene Ratio | Bg Ratio | pvalue | p.adjust | qvalue | Count |
| hsa0513224 | Breast | IDC | Salmonella infection | 55/867 | 249/8465 | 2.07e-08 | 4.49e-07 | 3.36e-07 | 55 |
| hsa0513024 | Breast | IDC | Pathogenic Escherichia coli infection | 42/867 | 197/8465 | 2.66e-06 | 3.92e-05 | 2.94e-05 | 42 |
| hsa0520523 | Breast | IDC | Proteoglycans in cancer | 42/867 | 205/8465 | 7.69e-06 | 9.99e-05 | 7.48e-05 | 42 |
| hsa0513234 | Breast | IDC | Salmonella infection | 55/867 | 249/8465 | 2.07e-08 | 4.49e-07 | 3.36e-07 | 55 |
| hsa0513034 | Breast | IDC | Pathogenic Escherichia coli infection | 42/867 | 197/8465 | 2.66e-06 | 3.92e-05 | 2.94e-05 | 42 |
| hsa0520533 | Breast | IDC | Proteoglycans in cancer | 42/867 | 205/8465 | 7.69e-06 | 9.99e-05 | 7.48e-05 | 42 |
| hsa0513243 | Breast | DCIS | Salmonella infection | 55/846 | 249/8465 | 8.71e-09 | 1.87e-07 | 1.38e-07 | 55 |
| hsa0520542 | Breast | DCIS | Proteoglycans in cancer | 39/846 | 205/8465 | 5.36e-05 | 5.58e-04 | 4.11e-04 | 39 |
| hsa0481023 | Breast | DCIS | Regulation of actin cytoskeleton | 35/846 | 229/8465 | 6.89e-03 | 3.37e-02 | 2.48e-02 | 35 |
| hsa0513253 | Breast | DCIS | Salmonella infection | 55/846 | 249/8465 | 8.71e-09 | 1.87e-07 | 1.38e-07 | 55 |
| hsa0520552 | Breast | DCIS | Proteoglycans in cancer | 39/846 | 205/8465 | 5.36e-05 | 5.58e-04 | 4.11e-04 | 39 |
| hsa0481033 | Breast | DCIS | Regulation of actin cytoskeleton | 35/846 | 229/8465 | 6.89e-03 | 3.37e-02 | 2.48e-02 | 35 |
| hsa05132 | Colorectum | AD | Salmonella infection | 102/2092 | 249/8465 | 7.65e-09 | 1.28e-07 | 8.17e-08 | 102 |
| hsa04666 | Colorectum | AD | Fc gamma R-mediated phagocytosis | 46/2092 | 97/8465 | 9.10e-07 | 1.22e-05 | 7.77e-06 | 46 |
| hsa05130 | Colorectum | AD | Pathogenic Escherichia coli infection | 79/2092 | 197/8465 | 1.05e-06 | 1.36e-05 | 8.65e-06 | 79 |
| hsa05205 | Colorectum | AD | Proteoglycans in cancer | 70/2092 | 205/8465 | 1.37e-03 | 8.46e-03 | 5.39e-03 | 70 |
| hsa05170 | Colorectum | AD | Human immunodeficiency virus 1 infection | 72/2092 | 212/8465 | 1.40e-03 | 8.46e-03 | 5.39e-03 | 72 |
| hsa05211 | Colorectum | AD | Renal cell carcinoma | 28/2092 | 69/8465 | 2.58e-03 | 1.37e-02 | 8.75e-03 | 28 |
| hsa04810 | Colorectum | AD | Regulation of actin cytoskeleton | 75/2092 | 229/8465 | 3.36e-03 | 1.76e-02 | 1.12e-02 | 75 |
| hsa04360 | Colorectum | AD | Axon guidance | 61/2092 | 182/8465 | 4.36e-03 | 2.17e-02 | 1.38e-02 | 61 |
| Page: 1 2 3 4 5 6 7 8 9 10 11 12 13 14 15 16 17 |
Top |
Cell-cell communication analysis |
| Identification of potential cell-cell interactions between two cell types and their ligand-receptor pairs for different disease states |
| Ligand | Receptor | LRpair | Pathway | Tissue | Disease Stage |
| Page: 1 |
Top |
Single-cell gene regulatory network inference analysis |
| Find out the significant the regulons (TFs) and the target genes of each regulon across cell types for different disease states |
| TF | Cell Type | Tissue | Disease Stage | Target Gene | RSS | Regulon Activity |
| ∗The dot plots of a searched regulon are shown for all cell subpopulations in each disease state of each tissue based on the regulon specific score inferred using pySCENIC and by calculating the average expression. |
| Page: 1 |
Top |
Somatic mutation of malignant transformation related genes |
| Annotation of somatic variants for genes involved in malignant transformation |
| Hugo Symbol | Variant Class | Variant Classification | dbSNP RS | HGVSc | HGVSp | HGVSp Short | SWISSPROT | BIOTYPE | SIFT | PolyPhen | Tumor Sample Barcode | Tissue | Histology | Sex | Age | Stage | Therapy Types | Drugs | Outcome |
| PAK1 | SNV | Missense_Mutation | c.184N>A | p.Asp62Asn | p.D62N | Q13153 | protein_coding | tolerated(0.38) | benign(0.033) | TCGA-A2-A0CX-01 | Breast | breast invasive carcinoma | Female | <65 | I/II | Chemotherapy | adriamycin | SD | |
| PAK1 | SNV | Missense_Mutation | c.1114G>A | p.Glu372Lys | p.E372K | Q13153 | protein_coding | deleterious(0) | probably_damaging(0.971) | TCGA-AC-A23H-01 | Breast | breast invasive carcinoma | Female | >=65 | I/II | Unknown | Unknown | PD | |
| PAK1 | SNV | Missense_Mutation | c.229N>A | p.Leu77Ile | p.L77I | Q13153 | protein_coding | tolerated(0.41) | benign(0.236) | TCGA-BH-A0HO-01 | Breast | breast invasive carcinoma | Female | <65 | I/II | Chemotherapy | cyclophosphamide | SD | |
| PAK1 | SNV | Missense_Mutation | c.1593N>C | p.Met531Ile | p.M531I | Q13153 | protein_coding | tolerated_low_confidence(0.54) | benign(0) | TCGA-C8-A1HM-01 | Breast | breast invasive carcinoma | Female | >=65 | I/II | Chemotherapy | doxorubicin | CR | |
| PAK1 | SNV | Missense_Mutation | c.113N>G | p.Ser38Cys | p.S38C | Q13153 | protein_coding | tolerated(0.17) | probably_damaging(0.917) | TCGA-D8-A27G-01 | Breast | breast invasive carcinoma | Female | >=65 | I/II | Unknown | Unknown | SD | |
| PAK1 | insertion | Nonsense_Mutation | novel | c.226_227insGTGCACATGTATATATATGTATGCAAGAATTTTAATTTT | p.Ile75_Ser76insCysAlaHisValTyrIleCysMetGlnGluPheTerPhe | p.I75_S76insCAHVYICMQEF*F | Q13153 | protein_coding | TCGA-BH-A0HO-01 | Breast | breast invasive carcinoma | Female | <65 | I/II | Chemotherapy | cyclophosphamide | SD | ||
| PAK1 | SNV | Missense_Mutation | c.1532C>T | p.Ser511Leu | p.S511L | Q13153 | protein_coding | deleterious(0) | benign(0.135) | TCGA-UC-A7PF-01 | Cervix | cervical & endocervical cancer | Female | <65 | I/II | Unknown | Unknown | SD | |
| PAK1 | SNV | Missense_Mutation | novel | c.946A>G | p.Ile316Val | p.I316V | Q13153 | protein_coding | deleterious(0) | possibly_damaging(0.748) | TCGA-AA-3710-01 | Colorectum | colon adenocarcinoma | Female | >=65 | I/II | Unknown | Unknown | SD |
| PAK1 | SNV | Missense_Mutation | novel | c.80N>A | p.Gly27Asp | p.G27D | Q13153 | protein_coding | deleterious_low_confidence(0.04) | benign(0.02) | TCGA-AA-3984-01 | Colorectum | colon adenocarcinoma | Female | <65 | I/II | Unknown | Unknown | SD |
| PAK1 | SNV | Missense_Mutation | c.95N>A | p.Gly32Glu | p.G32E | Q13153 | protein_coding | tolerated(1) | benign(0.007) | TCGA-AA-A010-01 | Colorectum | colon adenocarcinoma | Female | <65 | I/II | Chemotherapy | folinic | CR |
| Page: 1 2 3 4 5 |
Top |
Related drugs of malignant transformation related genes |
| Identification of chemicals and drugs interact with genes involved in malignant transfromation |
| (DGIdb 4.0) |
| Entrez ID | Symbol | Category | Interaction Types | Drug Claim Name | Drug Name | PMIDs |
| 5058 | PAK1 | KINASE, SERINE THREONINE KINASE, CLINICALLY ACTIONABLE, ENZYME, DRUGGABLE GENOME | AZD-1152-HQPA | AZD-1152-HQPA | ||
| 5058 | PAK1 | KINASE, SERINE THREONINE KINASE, CLINICALLY ACTIONABLE, ENZYME, DRUGGABLE GENOME | TOZASERTIB | TOZASERTIB | ||
| 5058 | PAK1 | KINASE, SERINE THREONINE KINASE, CLINICALLY ACTIONABLE, ENZYME, DRUGGABLE GENOME | ILORASERTIB | ILORASERTIB | ||
| 5058 | PAK1 | KINASE, SERINE THREONINE KINASE, CLINICALLY ACTIONABLE, ENZYME, DRUGGABLE GENOME | allosteric modulator | 310264717 | ||
| 5058 | PAK1 | KINASE, SERINE THREONINE KINASE, CLINICALLY ACTIONABLE, ENZYME, DRUGGABLE GENOME | MLN-8054 | MLN-8054 | ||
| 5058 | PAK1 | KINASE, SERINE THREONINE KINASE, CLINICALLY ACTIONABLE, ENZYME, DRUGGABLE GENOME | inhibitor | 310264719 | ||
| 5058 | PAK1 | KINASE, SERINE THREONINE KINASE, CLINICALLY ACTIONABLE, ENZYME, DRUGGABLE GENOME | inhibitor | 249565861 | ||
| 5058 | PAK1 | KINASE, SERINE THREONINE KINASE, CLINICALLY ACTIONABLE, ENZYME, DRUGGABLE GENOME | RG-1530 | RG-1530 | ||
| 5058 | PAK1 | KINASE, SERINE THREONINE KINASE, CLINICALLY ACTIONABLE, ENZYME, DRUGGABLE GENOME | PF-562271 | PF-00562271 | ||
| 5058 | PAK1 | KINASE, SERINE THREONINE KINASE, CLINICALLY ACTIONABLE, ENZYME, DRUGGABLE GENOME | TAE-684 | TAE-684 |
| Page: 1 2 |

Copyright 2023-Present -The University of Texas Health Science Center at Houston |