
|
|||||
|
 | |
| |
| |
| |
| |
| |
|
Gene: ZDHHC2 |
Gene summary for ZDHHC2 |
| Gene information | Species | Human | Gene symbol | ZDHHC2 | Gene ID | 51201 |
| Gene name | zinc finger DHHC-type palmitoyltransferase 2 | |
| Gene Alias | DHHC2 | |
| Cytomap | 8p22 | |
| Gene Type | protein-coding | GO ID | GO:0001941 | UniProtAcc | A0A140VKD9 |
Top |
Malignant transformation analysis |
| Identification of the aberrant gene expression in precancerous and cancerous lesions by comparing the gene expression of stem-like cells in diseased tissues with normal stem cells |
| Entrez ID | Symbol | Replicates | Species | Organ | Tissue | Adj P-value | Log2FC | Malignancy |
| 51201 | ZDHHC2 | PTCwithHT_8 | Human | Thyroid | HT | 4.82e-02 | -2.69e-01 | 0.0351 |
| 51201 | ZDHHC2 | male-WTA | Human | Thyroid | PTC | 3.43e-42 | 1.71e-01 | 0.1037 |
| 51201 | ZDHHC2 | PTC01 | Human | Thyroid | PTC | 3.04e-11 | 2.27e-01 | 0.1899 |
| 51201 | ZDHHC2 | PTC04 | Human | Thyroid | PTC | 5.78e-16 | 2.90e-01 | 0.1927 |
| 51201 | ZDHHC2 | PTC05 | Human | Thyroid | PTC | 8.56e-13 | 7.32e-01 | 0.2065 |
| 51201 | ZDHHC2 | PTC06 | Human | Thyroid | PTC | 2.63e-36 | 1.05e+00 | 0.2057 |
| 51201 | ZDHHC2 | PTC07 | Human | Thyroid | PTC | 1.46e-46 | 7.47e-01 | 0.2044 |
| 51201 | ZDHHC2 | ATC12 | Human | Thyroid | ATC | 3.17e-02 | -2.61e-01 | 0.34 |
| 51201 | ZDHHC2 | ATC13 | Human | Thyroid | ATC | 2.03e-11 | -1.18e-01 | 0.34 |
| 51201 | ZDHHC2 | ATC2 | Human | Thyroid | ATC | 6.27e-04 | 2.86e-01 | 0.34 |
| 51201 | ZDHHC2 | ATC4 | Human | Thyroid | ATC | 4.82e-05 | -2.46e-01 | 0.34 |
| 51201 | ZDHHC2 | ATC5 | Human | Thyroid | ATC | 1.27e-20 | -1.01e-01 | 0.34 |
| Page: 1 |
| Tissue | Expression Dynamics | Abbreviation |
| Thyroid | 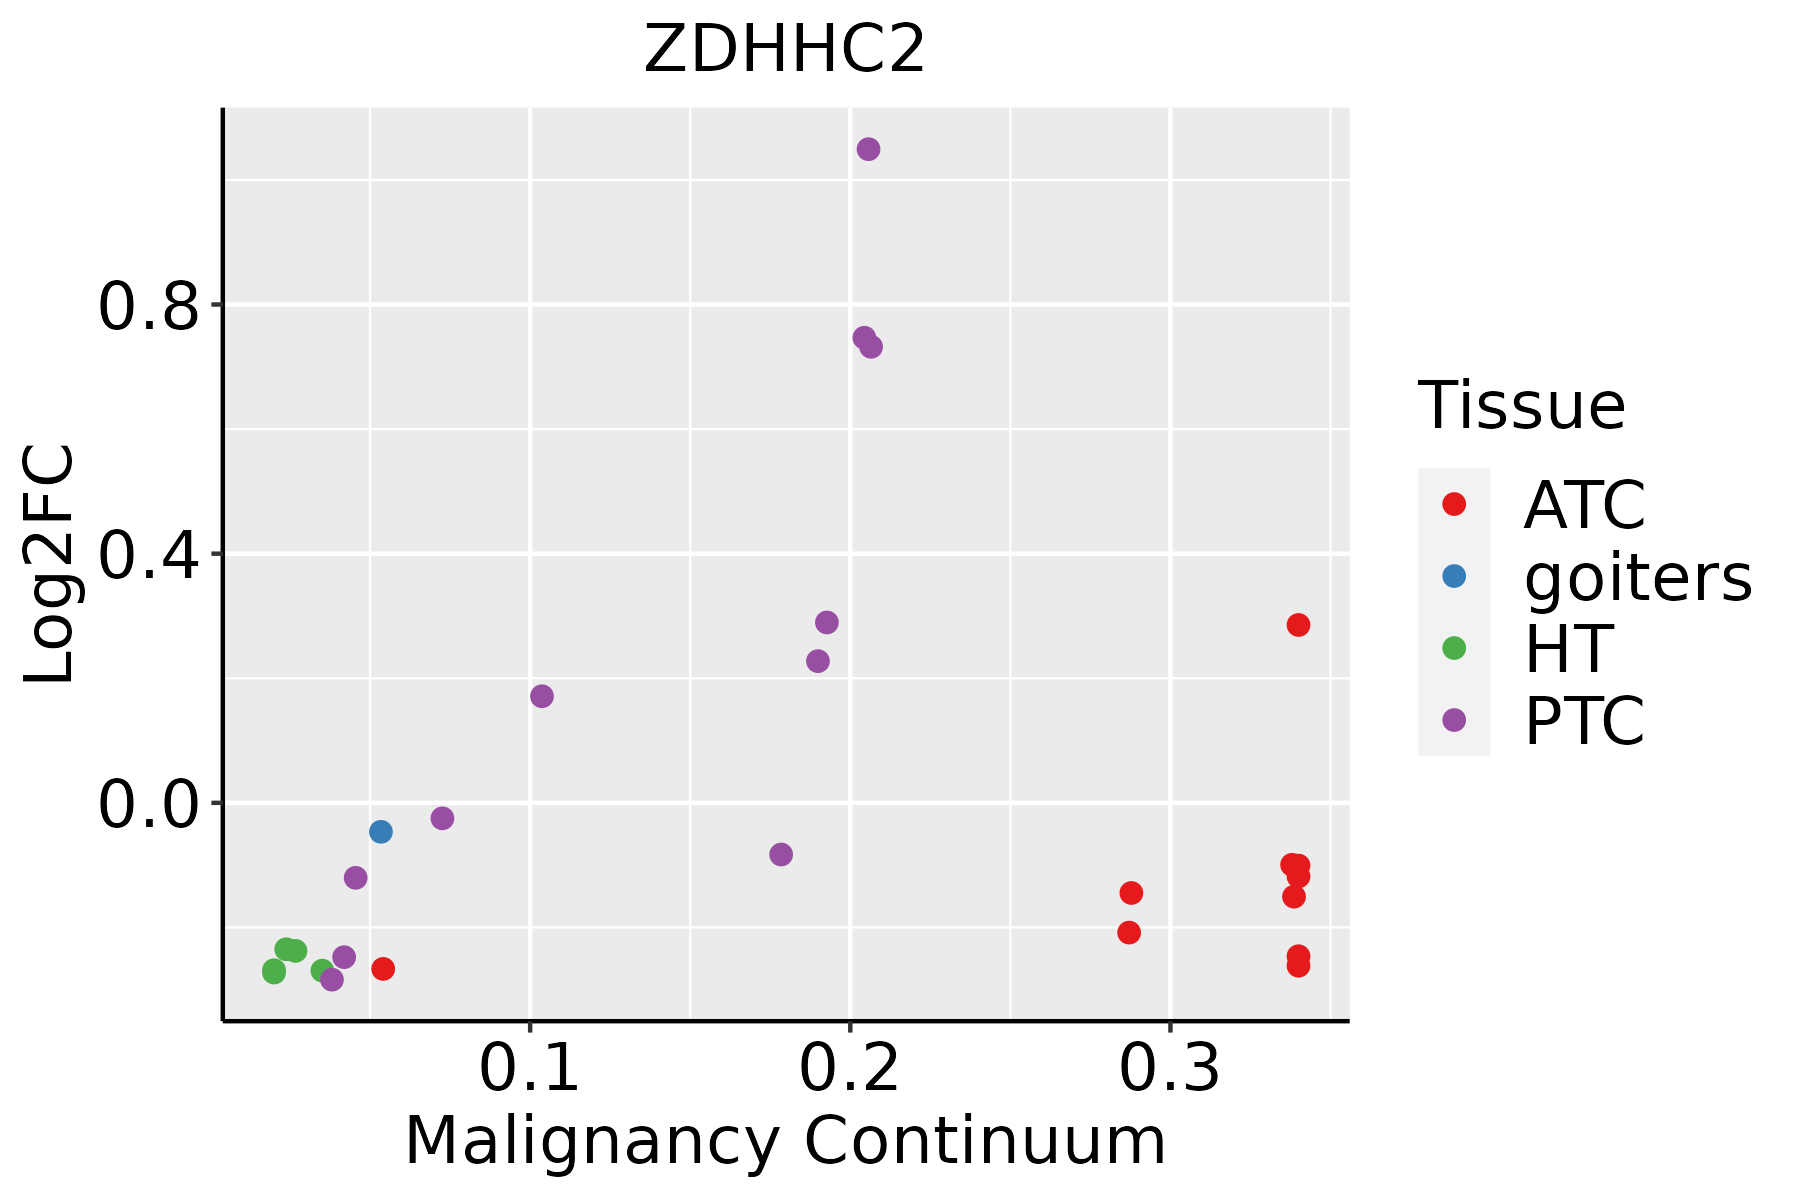 | ATC: Anaplastic thyroid cancer |
| HT: Hashimoto's thyroiditis | ||
| PTC: Papillary thyroid cancer |
| ∗log2FC in expression of this searched gene in stem-like cells from each diseased tissue sample relative to stem-like cells in normal samples in each tissue plotted against the malignancy continuum. Samples are colored based on if they are from different disease stage. |
Top |
Malignant transformation related pathway analysis |
| Find out the enriched GO biological processes and KEGG pathways involved in transition from healthy to precancer to cancer |
| Tissue | Disease Stage | Enriched GO biological Processes |
| Colorectum | AD |  |
| Colorectum | SER |  |
| Colorectum | MSS |  |
| Colorectum | MSI-H |  |
| Colorectum | FAP |  |
| ∗Top 15 enriched GO BP terms are showed in the bar plot of each disease state in each tissue. Each row represents a significant GO biological process which is colored according to the -log10(p.adjust). |
| Page: 1 2 3 4 5 6 7 8 9 |
| GO ID | Tissue | Disease Stage | Description | Gene Ratio | Bg Ratio | pvalue | p.adjust | Count |
| GO:000301211 | Lung | AIS | muscle system process | 63/1849 | 452/18723 | 3.18e-03 | 3.05e-02 | 63 |
| GO:002240711 | Lung | AIS | regulation of cell-cell adhesion | 62/1849 | 448/18723 | 4.01e-03 | 3.65e-02 | 62 |
| GO:004544612 | Lung | AIS | endothelial cell differentiation | 21/1849 | 118/18723 | 5.54e-03 | 4.71e-02 | 21 |
| GO:000660520 | Oral cavity | OSCC | protein targeting | 204/7305 | 314/18723 | 6.78e-21 | 1.13e-18 | 204 |
| GO:009015018 | Oral cavity | OSCC | establishment of protein localization to membrane | 163/7305 | 260/18723 | 7.13e-15 | 4.47e-13 | 163 |
| GO:00435434 | Oral cavity | OSCC | protein acylation | 149/7305 | 243/18723 | 1.33e-12 | 5.80e-11 | 149 |
| GO:00421572 | Oral cavity | OSCC | lipoprotein metabolic process | 77/7305 | 135/18723 | 1.61e-05 | 1.60e-04 | 77 |
| GO:00066123 | Oral cavity | OSCC | protein targeting to membrane | 75/7305 | 131/18723 | 1.72e-05 | 1.69e-04 | 75 |
| GO:00064972 | Oral cavity | OSCC | protein lipidation | 56/7305 | 92/18723 | 1.77e-05 | 1.72e-04 | 56 |
| GO:00421582 | Oral cavity | OSCC | lipoprotein biosynthetic process | 57/7305 | 96/18723 | 4.17e-05 | 3.61e-04 | 57 |
| GO:0006605110 | Oral cavity | LP | protein targeting | 156/4623 | 314/18723 | 5.43e-22 | 1.62e-19 | 156 |
| GO:009015019 | Oral cavity | LP | establishment of protein localization to membrane | 128/4623 | 260/18723 | 7.19e-18 | 1.19e-15 | 128 |
| GO:000661211 | Oral cavity | LP | protein targeting to membrane | 60/4623 | 131/18723 | 1.10e-07 | 3.59e-06 | 60 |
| GO:004354312 | Oral cavity | LP | protein acylation | 93/4623 | 243/18723 | 1.65e-06 | 3.86e-05 | 93 |
| GO:004215711 | Oral cavity | LP | lipoprotein metabolic process | 57/4623 | 135/18723 | 5.59e-06 | 1.11e-04 | 57 |
| GO:000649711 | Oral cavity | LP | protein lipidation | 40/4623 | 92/18723 | 6.04e-05 | 8.20e-04 | 40 |
| GO:004215811 | Oral cavity | LP | lipoprotein biosynthetic process | 41/4623 | 96/18723 | 8.04e-05 | 1.04e-03 | 41 |
| GO:0018198 | Oral cavity | LP | peptidyl-cysteine modification | 20/4623 | 49/18723 | 9.35e-03 | 4.98e-02 | 20 |
| GO:000660524 | Oral cavity | EOLP | protein targeting | 68/2218 | 314/18723 | 4.95e-07 | 1.34e-05 | 68 |
| GO:004354321 | Oral cavity | EOLP | protein acylation | 51/2218 | 243/18723 | 3.11e-05 | 4.41e-04 | 51 |
| Page: 1 2 3 4 5 6 7 8 9 10 11 12 |
| Pathway ID | Tissue | Disease Stage | Description | Gene Ratio | Bg Ratio | pvalue | p.adjust | qvalue | Count |
| Page: 1 |
Top |
Cell-cell communication analysis |
| Identification of potential cell-cell interactions between two cell types and their ligand-receptor pairs for different disease states |
| Ligand | Receptor | LRpair | Pathway | Tissue | Disease Stage |
| Page: 1 |
Top |
Single-cell gene regulatory network inference analysis |
| Find out the significant the regulons (TFs) and the target genes of each regulon across cell types for different disease states |
| TF | Cell Type | Tissue | Disease Stage | Target Gene | RSS | Regulon Activity |
| ∗The dot plots of a searched regulon are shown for all cell subpopulations in each disease state of each tissue based on the regulon specific score inferred using pySCENIC and by calculating the average expression. |
| Page: 1 |
Top |
Somatic mutation of malignant transformation related genes |
| Annotation of somatic variants for genes involved in malignant transformation |
| Hugo Symbol | Variant Class | Variant Classification | dbSNP RS | HGVSc | HGVSp | HGVSp Short | SWISSPROT | BIOTYPE | SIFT | PolyPhen | Tumor Sample Barcode | Tissue | Histology | Sex | Age | Stage | Therapy Types | Drugs | Outcome |
| ZDHHC2 | SNV | Missense_Mutation | c.907N>A | p.Glu303Lys | p.E303K | Q9UIJ5 | protein_coding | deleterious(0.01) | probably_damaging(0.98) | TCGA-C8-A12T-01 | Breast | breast invasive carcinoma | Female | <65 | I/II | Unknown | Unknown | SD | |
| ZDHHC2 | SNV | Missense_Mutation | novel | c.171N>A | p.Met57Ile | p.M57I | Q9UIJ5 | protein_coding | tolerated(0.72) | benign(0) | TCGA-C5-A7X3-01 | Cervix | cervical & endocervical cancer | Female | >=65 | III/IV | Chemotherapy | cisplatin | SD |
| ZDHHC2 | SNV | Missense_Mutation | novel | c.556N>C | p.Ile186Leu | p.I186L | Q9UIJ5 | protein_coding | deleterious(0) | benign(0.277) | TCGA-VS-A8EJ-01 | Cervix | cervical & endocervical cancer | Female | <65 | I/II | Chemotherapy | cisplatin | PD |
| ZDHHC2 | SNV | Missense_Mutation | rs374897759 | c.433N>A | p.Val145Ile | p.V145I | Q9UIJ5 | protein_coding | tolerated(0.08) | benign(0.411) | TCGA-AA-3811-01 | Colorectum | colon adenocarcinoma | Female | >=65 | III/IV | Unknown | Unknown | PD |
| ZDHHC2 | SNV | Missense_Mutation | c.524T>G | p.Phe175Cys | p.F175C | Q9UIJ5 | protein_coding | deleterious(0) | probably_damaging(0.998) | TCGA-AA-3815-01 | Colorectum | colon adenocarcinoma | Female | >=65 | I/II | Unknown | Unknown | SD | |
| ZDHHC2 | SNV | Missense_Mutation | rs368763365 | c.513N>A | p.Phe171Leu | p.F171L | Q9UIJ5 | protein_coding | deleterious(0) | possibly_damaging(0.744) | TCGA-F5-6814-01 | Colorectum | rectum adenocarcinoma | Male | <65 | I/II | Unknown | Unknown | SD |
| ZDHHC2 | SNV | Missense_Mutation | c.602G>A | p.Gly201Asp | p.G201D | Q9UIJ5 | protein_coding | tolerated(0.4) | benign(0.038) | TCGA-A5-A0VQ-01 | Endometrium | uterine corpus endometrioid carcinoma | Female | <65 | I/II | Chemotherapy | carboplatin | SD | |
| ZDHHC2 | SNV | Missense_Mutation | novel | c.529N>T | p.Ala177Ser | p.A177S | Q9UIJ5 | protein_coding | tolerated(0.2) | possibly_damaging(0.813) | TCGA-AJ-A3EK-01 | Endometrium | uterine corpus endometrioid carcinoma | Female | <65 | I/II | Chemotherapy | carboplatin | CR |
| ZDHHC2 | SNV | Missense_Mutation | novel | c.595N>G | p.Thr199Ala | p.T199A | Q9UIJ5 | protein_coding | deleterious(0.04) | possibly_damaging(0.63) | TCGA-AP-A051-01 | Endometrium | uterine corpus endometrioid carcinoma | Female | >=65 | I/II | Unknown | Unknown | SD |
| ZDHHC2 | SNV | Missense_Mutation | c.460N>T | p.Asp154Tyr | p.D154Y | Q9UIJ5 | protein_coding | deleterious(0) | probably_damaging(0.964) | TCGA-AP-A056-01 | Endometrium | uterine corpus endometrioid carcinoma | Female | <65 | I/II | Unknown | Unknown | SD |
| Page: 1 2 3 4 |
Top |
Related drugs of malignant transformation related genes |
| Identification of chemicals and drugs interact with genes involved in malignant transfromation |
| (DGIdb 4.0) |
| Entrez ID | Symbol | Category | Interaction Types | Drug Claim Name | Drug Name | PMIDs |
| Page: 1 |

Copyright 2023-Present -The University of Texas Health Science Center at Houston |