
|
|||||
|
 | |
| |
| |
| |
| |
| |
|
Gene: USP14 |
Gene summary for USP14 |
| Gene information | Species | Human | Gene symbol | USP14 | Gene ID | 9097 |
| Gene name | ubiquitin specific peptidase 14 | |
| Gene Alias | TGT | |
| Cytomap | 18p11.32 | |
| Gene Type | protein-coding | GO ID | GO:0002376 | UniProtAcc | P54578 |
Top |
Malignant transformation analysis |
| Identification of the aberrant gene expression in precancerous and cancerous lesions by comparing the gene expression of stem-like cells in diseased tissues with normal stem cells |
| Entrez ID | Symbol | Replicates | Species | Organ | Tissue | Adj P-value | Log2FC | Malignancy |
| 9097 | USP14 | GSM4909287 | Human | Breast | IDC | 2.36e-07 | 4.04e-01 | 0.2057 |
| 9097 | USP14 | GSM4909291 | Human | Breast | IDC | 3.60e-05 | 4.08e-01 | 0.1753 |
| 9097 | USP14 | GSM4909293 | Human | Breast | IDC | 2.13e-22 | 5.00e-01 | 0.1581 |
| 9097 | USP14 | GSM4909296 | Human | Breast | IDC | 1.86e-02 | -1.04e-01 | 0.1524 |
| 9097 | USP14 | GSM4909311 | Human | Breast | IDC | 1.12e-06 | -1.85e-01 | 0.1534 |
| 9097 | USP14 | GSM4909312 | Human | Breast | IDC | 1.06e-02 | -1.62e-01 | 0.1552 |
| 9097 | USP14 | GSM4909319 | Human | Breast | IDC | 4.32e-10 | -1.33e-01 | 0.1563 |
| 9097 | USP14 | brca2 | Human | Breast | Precancer | 5.30e-05 | 1.68e-01 | -0.024 |
| 9097 | USP14 | P1 | Human | Breast | IDC | 1.71e-02 | 1.58e-02 | 0.1527 |
| 9097 | USP14 | DCIS2 | Human | Breast | DCIS | 4.49e-59 | 2.92e-01 | 0.0085 |
| 9097 | USP14 | LZE2T | Human | Esophagus | ESCC | 5.73e-14 | 2.38e+00 | 0.082 |
| 9097 | USP14 | LZE3D | Human | Esophagus | HGIN | 2.75e-02 | 4.34e-01 | 0.0668 |
| 9097 | USP14 | LZE4T | Human | Esophagus | ESCC | 2.91e-10 | 4.23e-01 | 0.0811 |
| 9097 | USP14 | LZE7T | Human | Esophagus | ESCC | 1.67e-05 | 6.25e-01 | 0.0667 |
| 9097 | USP14 | LZE8T | Human | Esophagus | ESCC | 5.28e-10 | 3.19e-02 | 0.067 |
| 9097 | USP14 | LZE20T | Human | Esophagus | ESCC | 7.72e-08 | 1.37e-01 | 0.0662 |
| 9097 | USP14 | LZE24T | Human | Esophagus | ESCC | 2.72e-14 | 4.40e-01 | 0.0596 |
| 9097 | USP14 | LZE21T | Human | Esophagus | ESCC | 8.77e-07 | 3.78e-01 | 0.0655 |
| 9097 | USP14 | LZE6T | Human | Esophagus | ESCC | 1.05e-10 | 5.51e-01 | 0.0845 |
| 9097 | USP14 | P1T-E | Human | Esophagus | ESCC | 3.46e-09 | 4.80e-01 | 0.0875 |
| Page: 1 2 3 4 5 6 7 8 |
| Tissue | Expression Dynamics | Abbreviation |
| Breast | 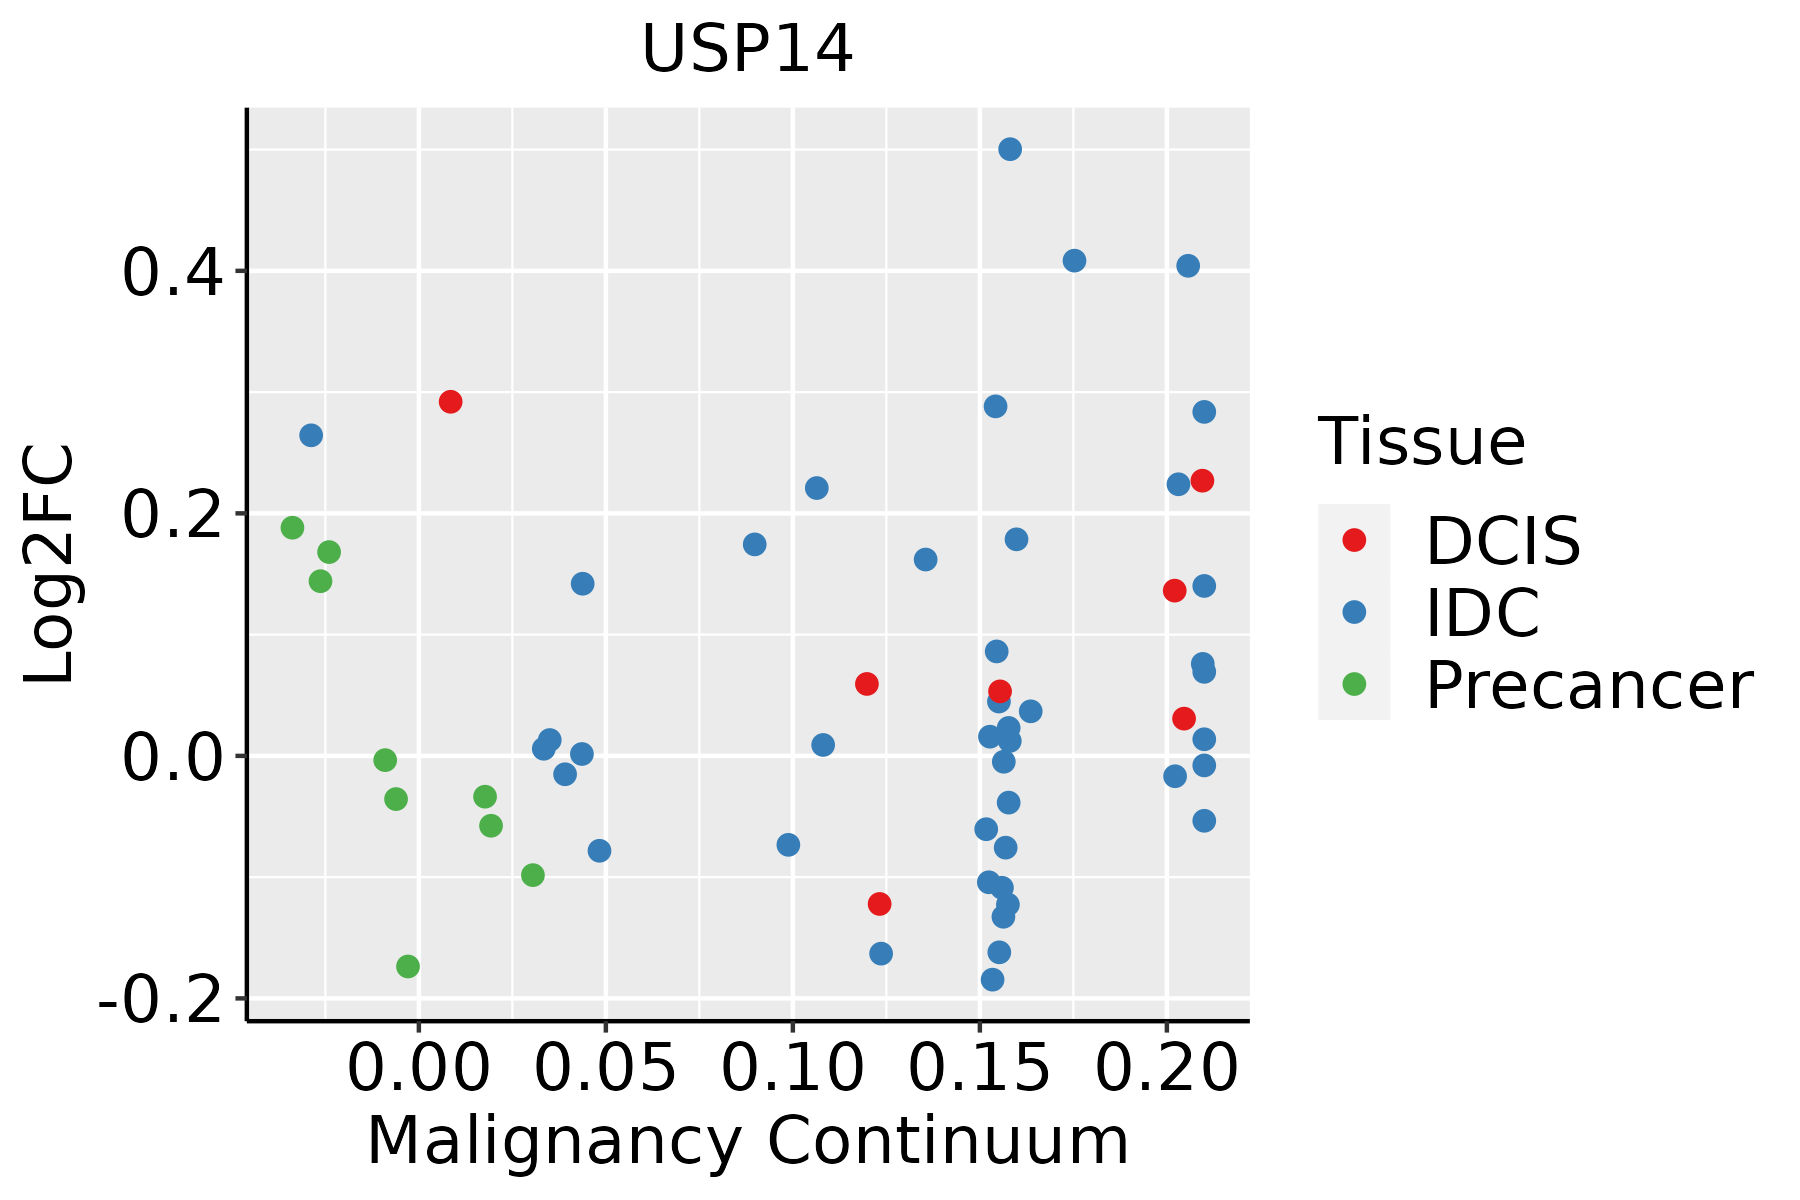 | IDC: Invasive ductal carcinoma |
| DCIS: Ductal carcinoma in situ | ||
| Precancer(BRCA1-mut): Precancerous lesion from BRCA1 mutation carriers | ||
| Esophagus | 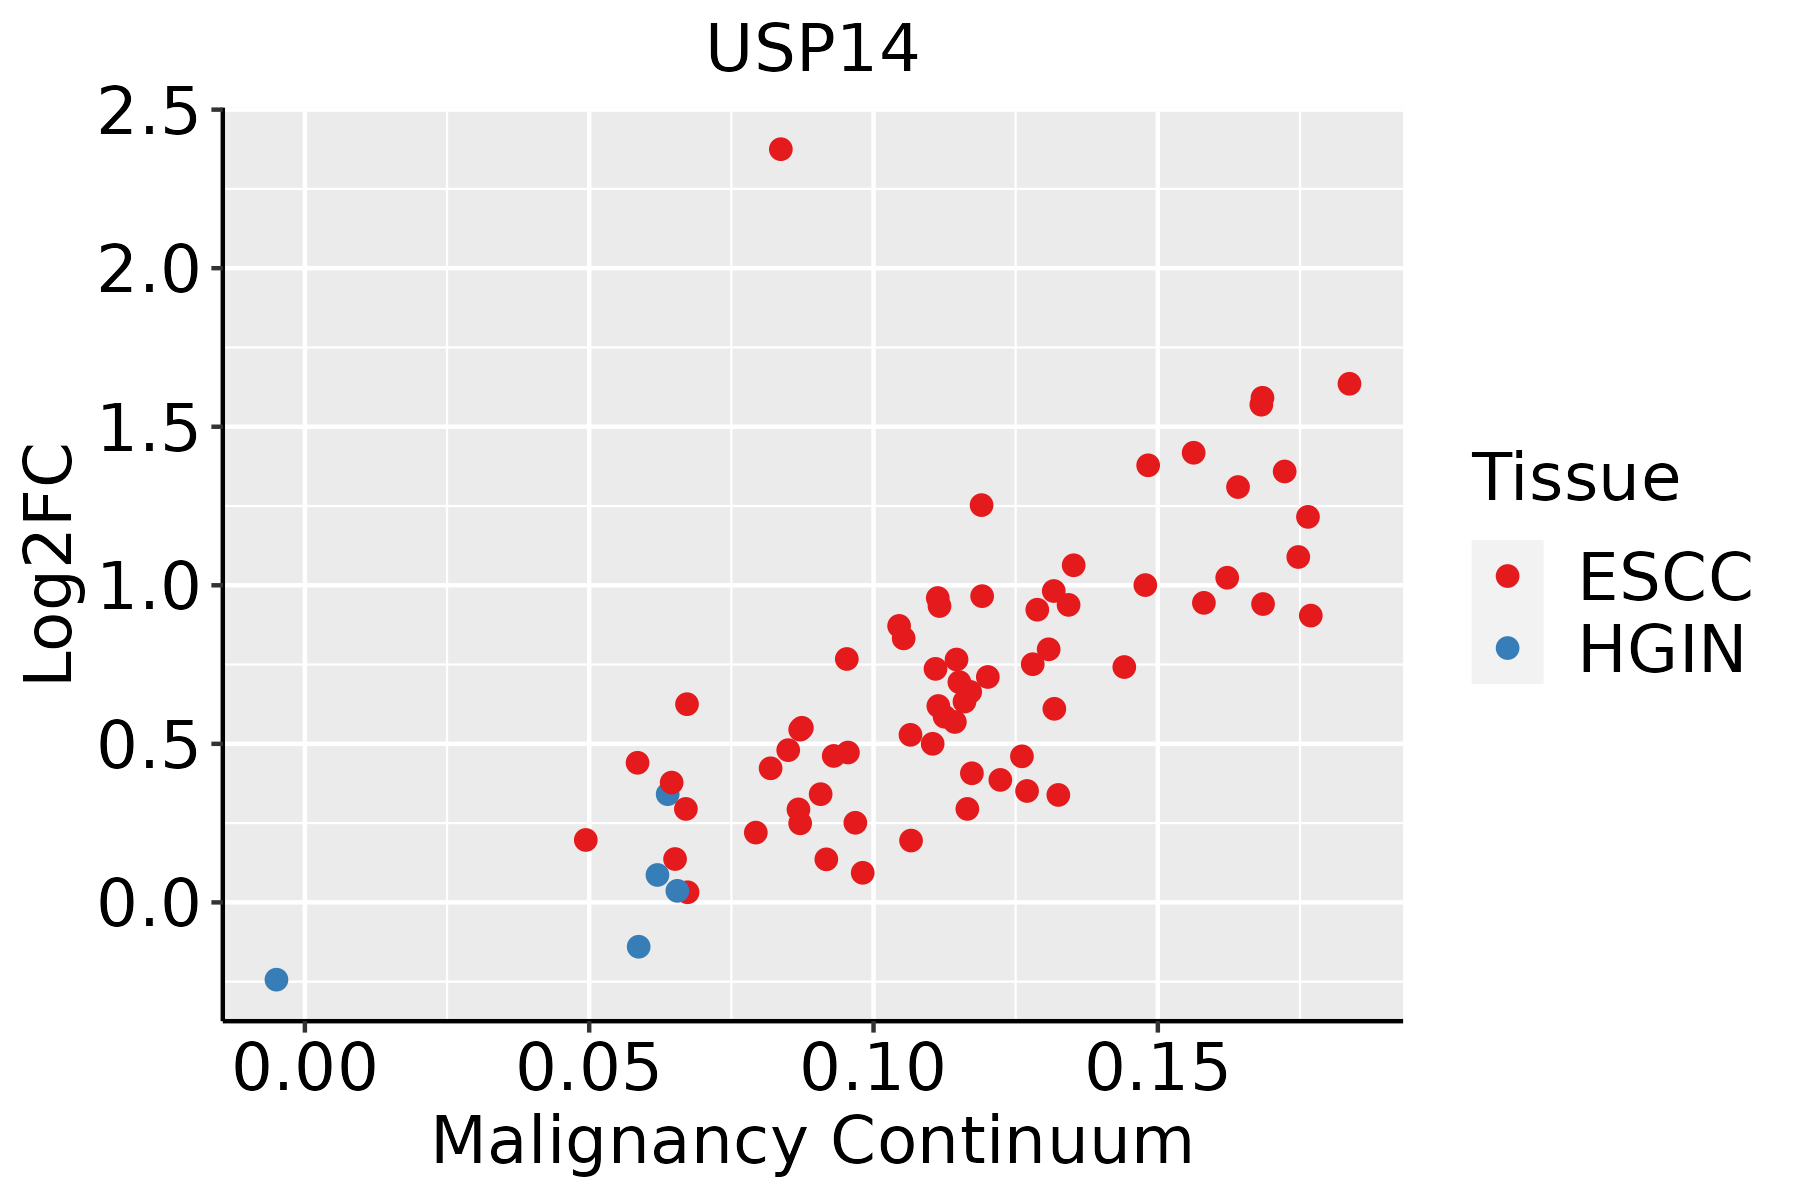 | ESCC: Esophageal squamous cell carcinoma |
| HGIN: High-grade intraepithelial neoplasias | ||
| LGIN: Low-grade intraepithelial neoplasias | ||
| Liver |  | HCC: Hepatocellular carcinoma |
| NAFLD: Non-alcoholic fatty liver disease | ||
| Oral Cavity | 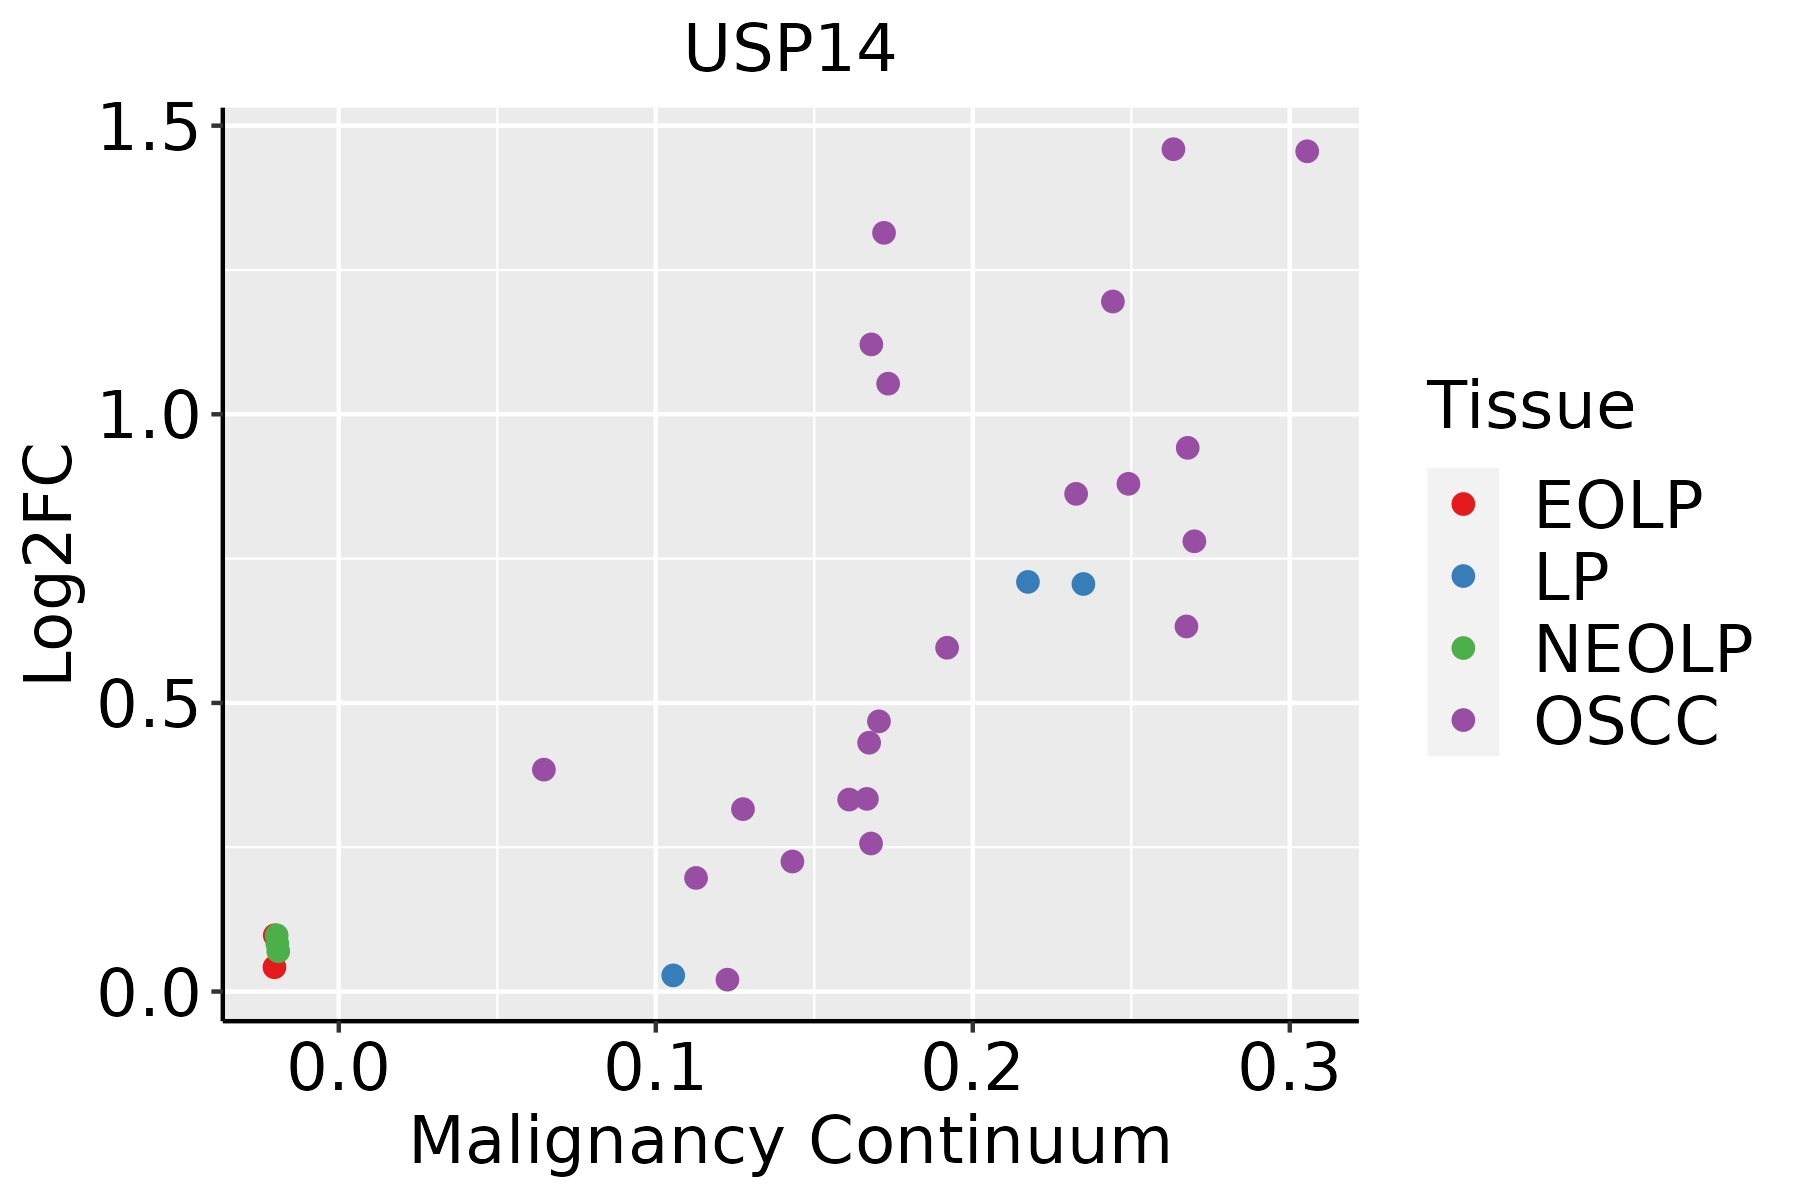 | EOLP: Erosive Oral lichen planus |
| LP: leukoplakia | ||
| NEOLP: Non-erosive oral lichen planus | ||
| OSCC: Oral squamous cell carcinoma | ||
| Prostate | 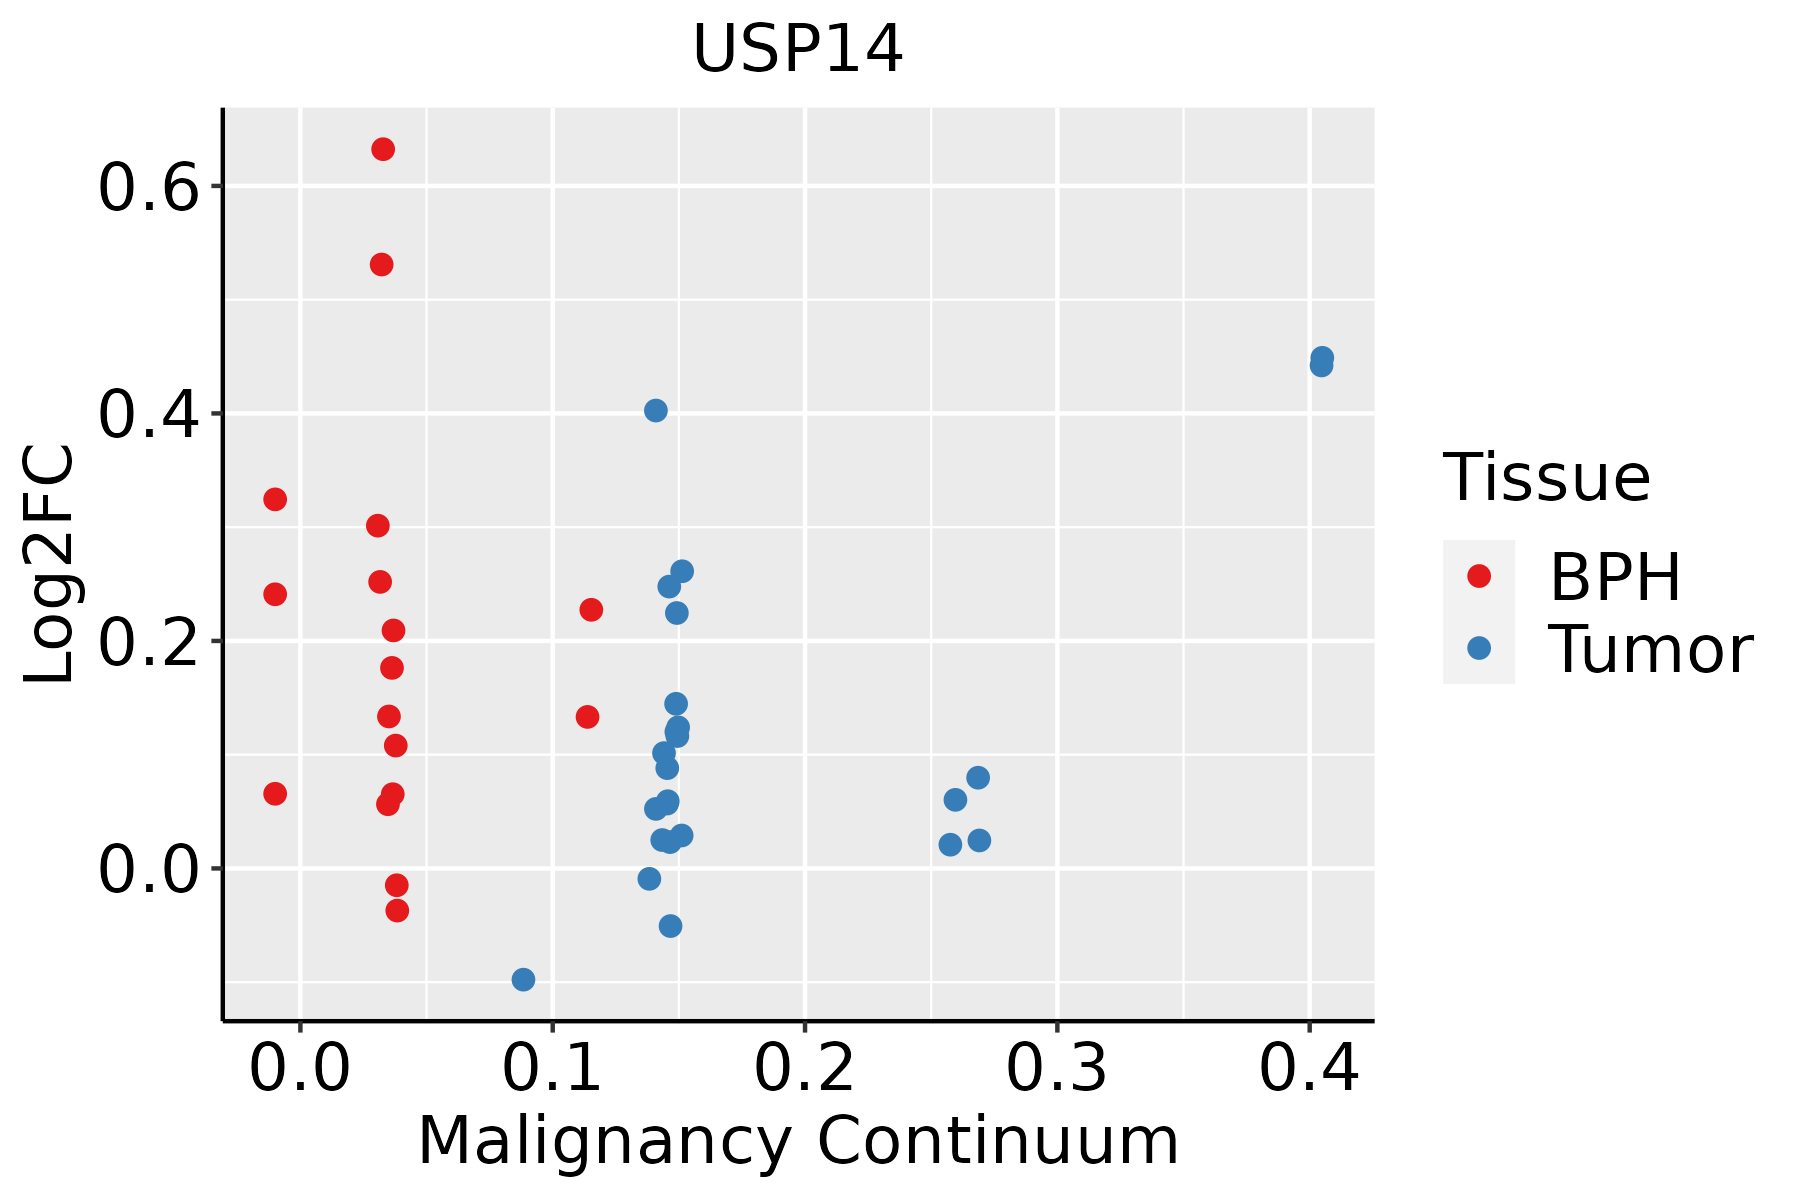 | BPH: Benign Prostatic Hyperplasia |
| Skin | 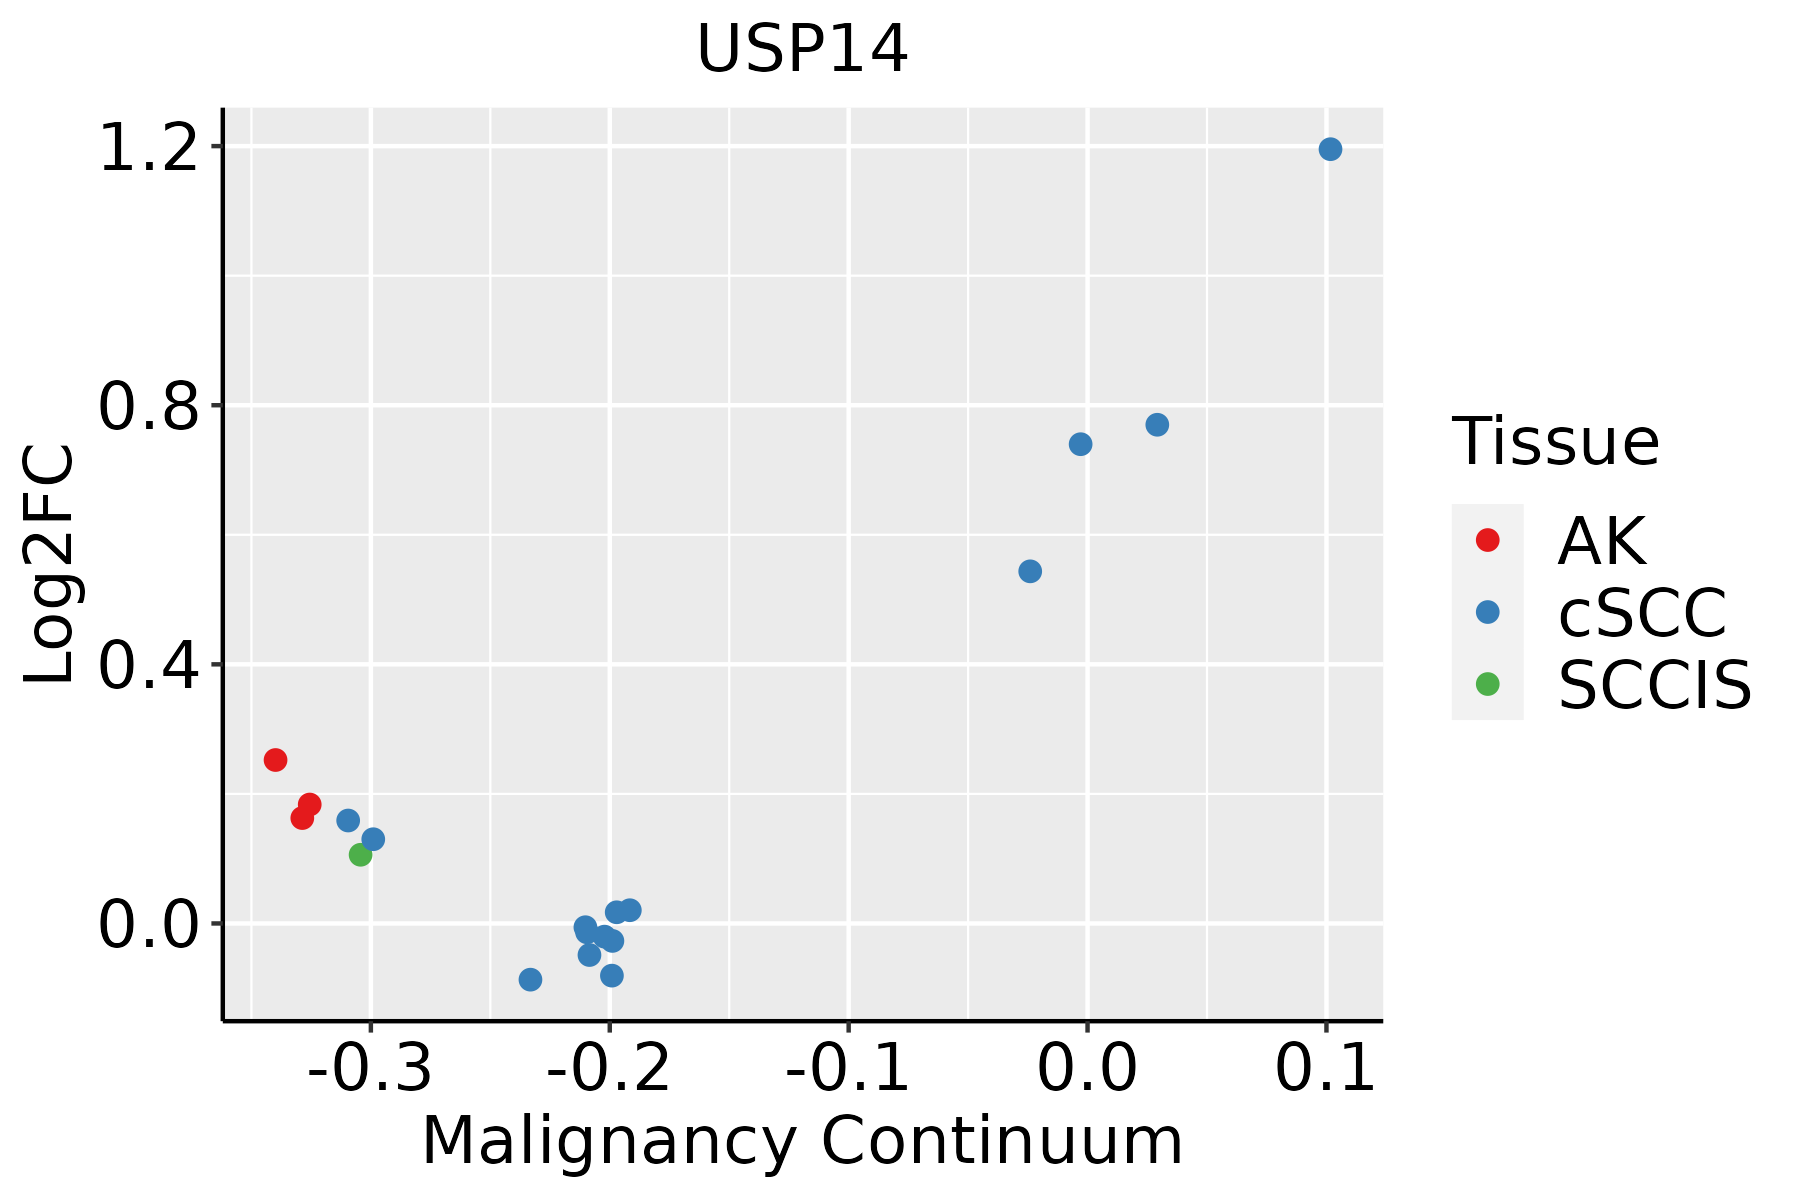 | AK: Actinic keratosis |
| cSCC: Cutaneous squamous cell carcinoma | ||
| SCCIS:squamous cell carcinoma in situ | ||
| Thyroid | 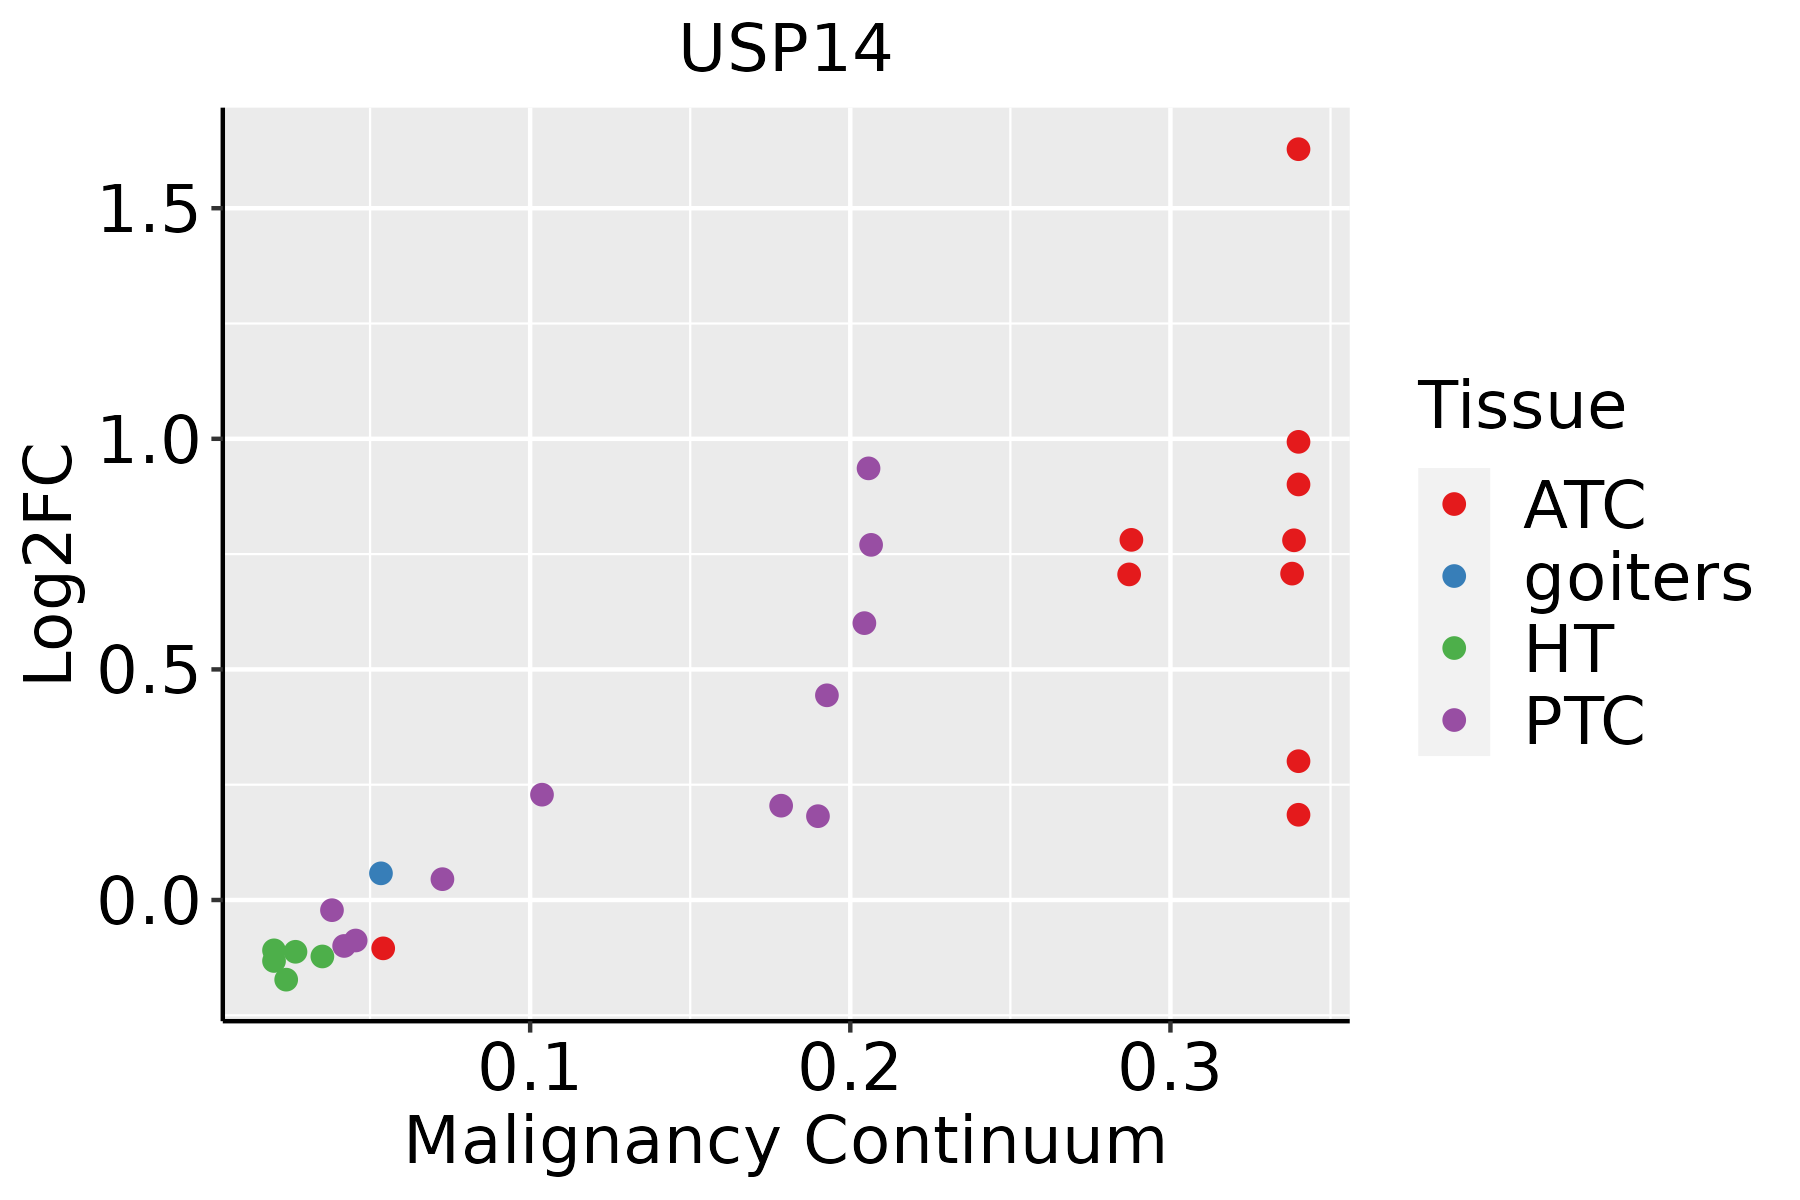 | ATC: Anaplastic thyroid cancer |
| HT: Hashimoto's thyroiditis | ||
| PTC: Papillary thyroid cancer |
| ∗log2FC in expression of this searched gene in stem-like cells from each diseased tissue sample relative to stem-like cells in normal samples in each tissue plotted against the malignancy continuum. Samples are colored based on if they are from different disease stage. |
Top |
Malignant transformation related pathway analysis |
| Find out the enriched GO biological processes and KEGG pathways involved in transition from healthy to precancer to cancer |
| Tissue | Disease Stage | Enriched GO biological Processes |
| Colorectum | AD |  |
| Colorectum | SER |  |
| Colorectum | MSS |  |
| Colorectum | MSI-H |  |
| Colorectum | FAP |  |
| ∗Top 15 enriched GO BP terms are showed in the bar plot of each disease state in each tissue. Each row represents a significant GO biological process which is colored according to the -log10(p.adjust). |
| Page: 1 2 3 4 5 6 7 8 9 |
| GO ID | Tissue | Disease Stage | Description | Gene Ratio | Bg Ratio | pvalue | p.adjust | Count |
| GO:200005922 | Liver | HCC | negative regulation of ubiquitin-dependent protein catabolic process | 37/7958 | 48/18723 | 1.12e-06 | 1.66e-05 | 37 |
| GO:005254822 | Liver | HCC | regulation of endopeptidase activity | 230/7958 | 432/18723 | 3.58e-06 | 4.68e-05 | 230 |
| GO:004217721 | Liver | HCC | negative regulation of protein catabolic process | 76/7958 | 121/18723 | 5.11e-06 | 6.41e-05 | 76 |
| GO:003243521 | Liver | HCC | negative regulation of proteasomal ubiquitin-dependent protein catabolic process | 28/7958 | 35/18723 | 6.54e-06 | 7.88e-05 | 28 |
| GO:1904292 | Liver | HCC | regulation of ERAD pathway | 18/7958 | 20/18723 | 1.38e-05 | 1.51e-04 | 18 |
| GO:004586122 | Liver | HCC | negative regulation of proteolysis | 186/7958 | 351/18723 | 4.19e-05 | 4.11e-04 | 186 |
| GO:00706461 | Liver | HCC | protein modification by small protein removal | 91/7958 | 157/18723 | 6.50e-05 | 5.92e-04 | 91 |
| GO:190305121 | Liver | HCC | negative regulation of proteolysis involved in cellular protein catabolic process | 42/7958 | 64/18723 | 1.58e-04 | 1.26e-03 | 42 |
| GO:005134622 | Liver | HCC | negative regulation of hydrolase activity | 195/7958 | 379/18723 | 2.44e-04 | 1.82e-03 | 195 |
| GO:190336321 | Liver | HCC | negative regulation of cellular protein catabolic process | 47/7958 | 75/18723 | 3.36e-04 | 2.35e-03 | 47 |
| GO:00165791 | Liver | HCC | protein deubiquitination | 78/7958 | 139/18723 | 8.13e-04 | 4.87e-03 | 78 |
| GO:19017994 | Liver | HCC | negative regulation of proteasomal protein catabolic process | 32/7958 | 49/18723 | 1.06e-03 | 6.11e-03 | 32 |
| GO:001095121 | Liver | HCC | negative regulation of endopeptidase activity | 129/7958 | 252/18723 | 3.17e-03 | 1.47e-02 | 129 |
| GO:001046621 | Liver | HCC | negative regulation of peptidase activity | 132/7958 | 262/18723 | 5.82e-03 | 2.42e-02 | 132 |
| GO:001049820 | Oral cavity | OSCC | proteasomal protein catabolic process | 336/7305 | 490/18723 | 5.45e-41 | 8.63e-38 | 336 |
| GO:004316120 | Oral cavity | OSCC | proteasome-mediated ubiquitin-dependent protein catabolic process | 285/7305 | 412/18723 | 5.68e-36 | 5.99e-33 | 285 |
| GO:004217620 | Oral cavity | OSCC | regulation of protein catabolic process | 254/7305 | 391/18723 | 1.07e-25 | 3.22e-23 | 254 |
| GO:003497620 | Oral cavity | OSCC | response to endoplasmic reticulum stress | 178/7305 | 256/18723 | 2.59e-23 | 6.06e-21 | 178 |
| GO:190336220 | Oral cavity | OSCC | regulation of cellular protein catabolic process | 174/7305 | 255/18723 | 2.04e-21 | 3.70e-19 | 174 |
| GO:190305020 | Oral cavity | OSCC | regulation of proteolysis involved in cellular protein catabolic process | 152/7305 | 221/18723 | 2.16e-19 | 3.15e-17 | 152 |
| Page: 1 2 3 4 5 6 7 8 9 10 11 12 13 14 15 16 17 18 |
| Pathway ID | Tissue | Disease Stage | Description | Gene Ratio | Bg Ratio | pvalue | p.adjust | qvalue | Count |
| Page: 1 |
Top |
Cell-cell communication analysis |
| Identification of potential cell-cell interactions between two cell types and their ligand-receptor pairs for different disease states |
| Ligand | Receptor | LRpair | Pathway | Tissue | Disease Stage |
| Page: 1 |
Top |
Single-cell gene regulatory network inference analysis |
| Find out the significant the regulons (TFs) and the target genes of each regulon across cell types for different disease states |
| TF | Cell Type | Tissue | Disease Stage | Target Gene | RSS | Regulon Activity |
| ∗The dot plots of a searched regulon are shown for all cell subpopulations in each disease state of each tissue based on the regulon specific score inferred using pySCENIC and by calculating the average expression. |
| Page: 1 |
Top |
Somatic mutation of malignant transformation related genes |
| Annotation of somatic variants for genes involved in malignant transformation |
| Hugo Symbol | Variant Class | Variant Classification | dbSNP RS | HGVSc | HGVSp | HGVSp Short | SWISSPROT | BIOTYPE | SIFT | PolyPhen | Tumor Sample Barcode | Tissue | Histology | Sex | Age | Stage | Therapy Types | Drugs | Outcome |
| USP14 | SNV | Missense_Mutation | novel | c.1482N>C | p.Gln494His | p.Q494H | P54578 | protein_coding | tolerated_low_confidence(0.23) | benign(0.005) | TCGA-AR-A0U0-01 | Breast | breast invasive carcinoma | Female | >=65 | I/II | Unknown | Unknown | SD |
| USP14 | insertion | In_Frame_Ins | novel | c.1484_1485insACAGGAGAACCC | p.Ter495delinsTer | p.*495delins* | P54578 | protein_coding | TCGA-AR-A0U0-01 | Breast | breast invasive carcinoma | Female | >=65 | I/II | Unknown | Unknown | SD | ||
| USP14 | deletion | Frame_Shift_Del | novel | c.874delN | p.Leu292CysfsTer33 | p.L292Cfs*33 | P54578 | protein_coding | TCGA-EW-A2FV-01 | Breast | breast invasive carcinoma | Female | <65 | III/IV | Chemotherapy | docetaxel | SD | ||
| USP14 | SNV | Missense_Mutation | rs374300842 | c.760N>G | p.Thr254Ala | p.T254A | P54578 | protein_coding | tolerated(0.36) | benign(0.007) | TCGA-2W-A8YY-01 | Cervix | cervical & endocervical cancer | Female | <65 | I/II | Chemotherapy | cisplatin | CR |
| USP14 | SNV | Missense_Mutation | c.40N>C | p.Lys14Gln | p.K14Q | P54578 | protein_coding | tolerated(0.13) | possibly_damaging(0.823) | TCGA-AA-3510-01 | Colorectum | colon adenocarcinoma | Male | >=65 | I/II | Unknown | Unknown | SD | |
| USP14 | SNV | Missense_Mutation | c.911N>T | p.Thr304Met | p.T304M | P54578 | protein_coding | deleterious(0.01) | possibly_damaging(0.896) | TCGA-AA-A01R-01 | Colorectum | colon adenocarcinoma | Male | <65 | III/IV | Chemotherapy | 5-fluorouracil | PD | |
| USP14 | SNV | Missense_Mutation | novel | c.288N>T | p.Gln96His | p.Q96H | P54578 | protein_coding | deleterious(0) | possibly_damaging(0.679) | TCGA-AM-5820-01 | Colorectum | colon adenocarcinoma | Female | <65 | I/II | Unknown | Unknown | SD |
| USP14 | insertion | Nonsense_Mutation | novel | c.286_287insACATATAACATAATTCT | p.Gln96HisfsTer3 | p.Q96Hfs*3 | P54578 | protein_coding | TCGA-AM-5820-01 | Colorectum | colon adenocarcinoma | Female | <65 | I/II | Unknown | Unknown | SD | ||
| USP14 | insertion | Frame_Shift_Ins | novel | c.990_991insT | p.Tyr333LeufsTer2 | p.Y333Lfs*2 | P54578 | protein_coding | TCGA-CK-5916-01 | Colorectum | colon adenocarcinoma | Female | >=65 | I/II | Unknown | Unknown | PD | ||
| USP14 | SNV | Missense_Mutation | novel | c.1384N>T | p.Asp462Tyr | p.D462Y | P54578 | protein_coding | deleterious(0) | probably_damaging(0.992) | TCGA-A5-A0G1-01 | Endometrium | uterine corpus endometrioid carcinoma | Female | >=65 | I/II | Unknown | Unknown | SD |
| Page: 1 2 3 4 5 6 |
Top |
Related drugs of malignant transformation related genes |
| Identification of chemicals and drugs interact with genes involved in malignant transfromation |
| (DGIdb 4.0) |
| Entrez ID | Symbol | Category | Interaction Types | Drug Claim Name | Drug Name | PMIDs |
| 9097 | USP14 | ENZYME, CELL SURFACE, PROTEASE | inhibitor | 252827537 | ||
| 9097 | USP14 | ENZYME, CELL SURFACE, PROTEASE | PMID26077642-Compound-Figure3A | |||
| 9097 | USP14 | ENZYME, CELL SURFACE, PROTEASE | inhibitor | 328083515 | ||
| 9097 | USP14 | ENZYME, CELL SURFACE, PROTEASE | Tricyclic heterocycle derivative 4 |
| Page: 1 |

Copyright 2023-Present -The University of Texas Health Science Center at Houston |