
|
|||||
|
 | |
| |
| |
| |
| |
| |
|
Gene: THOC5 |
Gene summary for THOC5 |
| Gene information | Species | Human | Gene symbol | THOC5 | Gene ID | 8563 |
| Gene name | THO complex 5 | |
| Gene Alias | C22orf19 | |
| Cytomap | 22q12.2 | |
| Gene Type | protein-coding | GO ID | GO:0000075 | UniProtAcc | A0A024R1D6 |
Top |
Malignant transformation analysis |
| Identification of the aberrant gene expression in precancerous and cancerous lesions by comparing the gene expression of stem-like cells in diseased tissues with normal stem cells |
| Entrez ID | Symbol | Replicates | Species | Organ | Tissue | Adj P-value | Log2FC | Malignancy |
| 8563 | THOC5 | LZE4T | Human | Esophagus | ESCC | 2.73e-07 | 1.80e-01 | 0.0811 |
| 8563 | THOC5 | LZE7T | Human | Esophagus | ESCC | 1.59e-15 | 5.03e-01 | 0.0667 |
| 8563 | THOC5 | LZE8T | Human | Esophagus | ESCC | 3.30e-02 | 8.89e-02 | 0.067 |
| 8563 | THOC5 | LZE24T | Human | Esophagus | ESCC | 5.17e-10 | 2.53e-01 | 0.0596 |
| 8563 | THOC5 | LZE21T | Human | Esophagus | ESCC | 4.00e-03 | 1.74e-01 | 0.0655 |
| 8563 | THOC5 | P2T-E | Human | Esophagus | ESCC | 5.72e-14 | 2.33e-01 | 0.1177 |
| 8563 | THOC5 | P4T-E | Human | Esophagus | ESCC | 4.30e-15 | 3.37e-01 | 0.1323 |
| 8563 | THOC5 | P5T-E | Human | Esophagus | ESCC | 2.15e-05 | 9.44e-02 | 0.1327 |
| 8563 | THOC5 | P8T-E | Human | Esophagus | ESCC | 8.04e-11 | 1.72e-01 | 0.0889 |
| 8563 | THOC5 | P9T-E | Human | Esophagus | ESCC | 3.11e-12 | 2.58e-01 | 0.1131 |
| 8563 | THOC5 | P10T-E | Human | Esophagus | ESCC | 1.11e-26 | 4.17e-01 | 0.116 |
| 8563 | THOC5 | P11T-E | Human | Esophagus | ESCC | 4.72e-07 | 3.17e-01 | 0.1426 |
| 8563 | THOC5 | P12T-E | Human | Esophagus | ESCC | 2.08e-15 | 2.95e-01 | 0.1122 |
| 8563 | THOC5 | P15T-E | Human | Esophagus | ESCC | 1.90e-29 | 5.50e-01 | 0.1149 |
| 8563 | THOC5 | P16T-E | Human | Esophagus | ESCC | 5.84e-17 | 3.32e-01 | 0.1153 |
| 8563 | THOC5 | P17T-E | Human | Esophagus | ESCC | 1.58e-07 | 3.40e-01 | 0.1278 |
| 8563 | THOC5 | P19T-E | Human | Esophagus | ESCC | 1.88e-03 | 3.43e-01 | 0.1662 |
| 8563 | THOC5 | P20T-E | Human | Esophagus | ESCC | 1.04e-13 | 3.04e-01 | 0.1124 |
| 8563 | THOC5 | P21T-E | Human | Esophagus | ESCC | 1.32e-11 | 2.38e-01 | 0.1617 |
| 8563 | THOC5 | P22T-E | Human | Esophagus | ESCC | 1.67e-16 | 3.71e-01 | 0.1236 |
| Page: 1 2 3 4 5 |
| Tissue | Expression Dynamics | Abbreviation |
| Esophagus |  | ESCC: Esophageal squamous cell carcinoma |
| HGIN: High-grade intraepithelial neoplasias | ||
| LGIN: Low-grade intraepithelial neoplasias | ||
| Liver |  | HCC: Hepatocellular carcinoma |
| NAFLD: Non-alcoholic fatty liver disease | ||
| Oral Cavity | 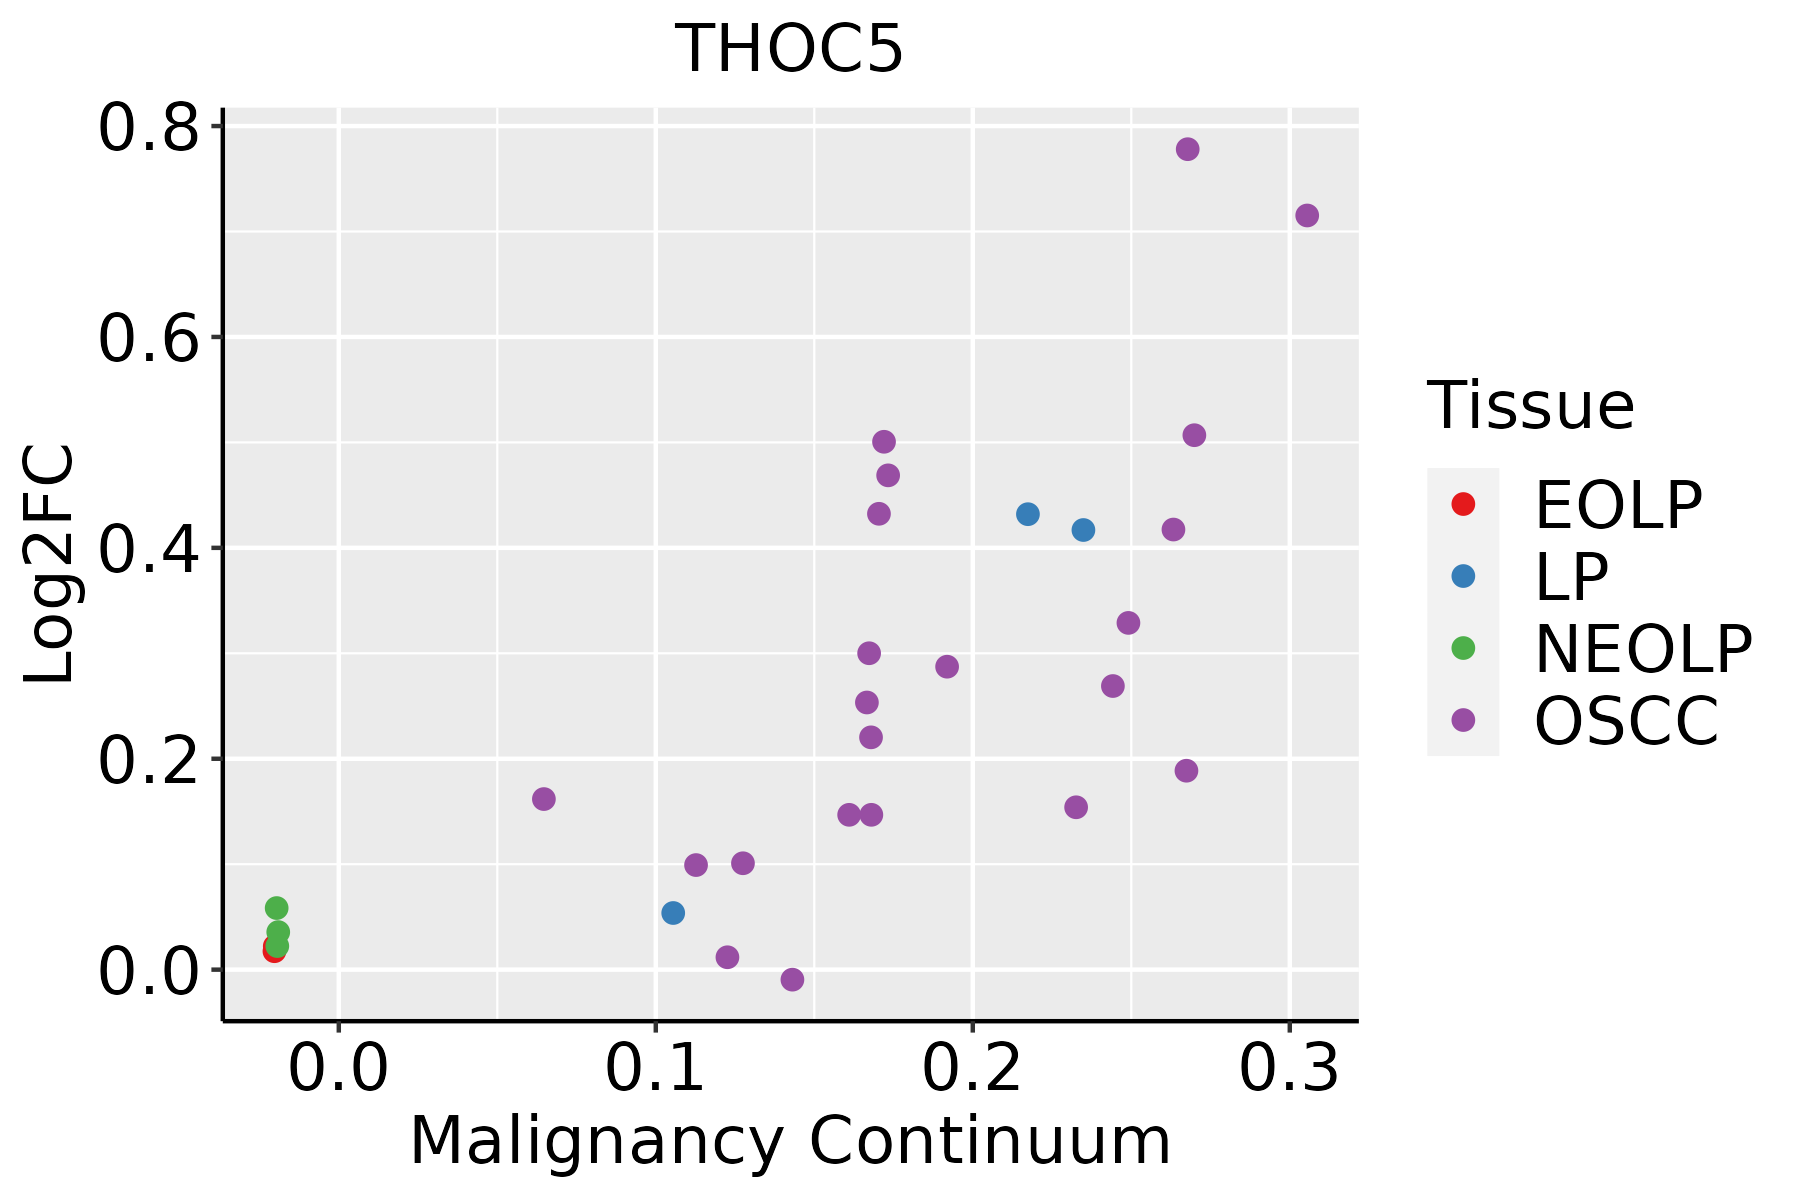 | EOLP: Erosive Oral lichen planus |
| LP: leukoplakia | ||
| NEOLP: Non-erosive oral lichen planus | ||
| OSCC: Oral squamous cell carcinoma |
| ∗log2FC in expression of this searched gene in stem-like cells from each diseased tissue sample relative to stem-like cells in normal samples in each tissue plotted against the malignancy continuum. Samples are colored based on if they are from different disease stage. |
Top |
Malignant transformation related pathway analysis |
| Find out the enriched GO biological processes and KEGG pathways involved in transition from healthy to precancer to cancer |
| Tissue | Disease Stage | Enriched GO biological Processes |
| Colorectum | AD |  |
| Colorectum | SER |  |
| Colorectum | MSS |  |
| Colorectum | MSI-H |  |
| Colorectum | FAP |  |
| ∗Top 15 enriched GO BP terms are showed in the bar plot of each disease state in each tissue. Each row represents a significant GO biological process which is colored according to the -log10(p.adjust). |
| Page: 1 2 3 4 5 6 7 8 9 |
| GO ID | Tissue | Disease Stage | Description | Gene Ratio | Bg Ratio | pvalue | p.adjust | Count |
| GO:005116918 | Oral cavity | LP | nuclear transport | 130/4623 | 301/18723 | 1.19e-12 | 9.77e-11 | 130 |
| GO:005065715 | Oral cavity | LP | nucleic acid transport | 78/4623 | 163/18723 | 1.11e-10 | 6.44e-09 | 78 |
| GO:005065815 | Oral cavity | LP | RNA transport | 78/4623 | 163/18723 | 1.11e-10 | 6.44e-09 | 78 |
| GO:005123615 | Oral cavity | LP | establishment of RNA localization | 79/4623 | 166/18723 | 1.18e-10 | 6.81e-09 | 79 |
| GO:001593115 | Oral cavity | LP | nucleobase-containing compound transport | 95/4623 | 222/18723 | 2.23e-09 | 9.98e-08 | 95 |
| GO:005102814 | Oral cavity | LP | mRNA transport | 62/4623 | 130/18723 | 1.03e-08 | 3.90e-07 | 62 |
| GO:005116818 | Oral cavity | LP | nuclear export | 68/4623 | 154/18723 | 9.55e-08 | 3.13e-06 | 68 |
| GO:007116611 | Oral cavity | LP | ribonucleoprotein complex localization | 38/4623 | 77/18723 | 2.47e-06 | 5.43e-05 | 38 |
| GO:000640511 | Oral cavity | LP | RNA export from nucleus | 40/4623 | 84/18723 | 4.24e-06 | 8.71e-05 | 40 |
| GO:007142611 | Oral cavity | LP | ribonucleoprotein complex export from nucleus | 37/4623 | 76/18723 | 5.02e-06 | 1.01e-04 | 37 |
| GO:200102018 | Oral cavity | LP | regulation of response to DNA damage stimulus | 82/4623 | 219/18723 | 1.71e-05 | 2.97e-04 | 82 |
| GO:0030099110 | Oral cavity | LP | myeloid cell differentiation | 130/4623 | 381/18723 | 1.94e-05 | 3.27e-04 | 130 |
| GO:003150313 | Oral cavity | LP | protein-containing complex localization | 82/4623 | 220/18723 | 2.08e-05 | 3.44e-04 | 82 |
| GO:000635413 | Oral cavity | LP | DNA-templated transcription, elongation | 39/4623 | 91/18723 | 1.08e-04 | 1.31e-03 | 39 |
| GO:000640611 | Oral cavity | LP | mRNA export from nucleus | 28/4623 | 59/18723 | 1.22e-04 | 1.43e-03 | 28 |
| GO:007142711 | Oral cavity | LP | mRNA-containing ribonucleoprotein complex export from nucleus | 28/4623 | 59/18723 | 1.22e-04 | 1.43e-03 | 28 |
| GO:004578612 | Oral cavity | LP | negative regulation of cell cycle | 127/4623 | 385/18723 | 1.33e-04 | 1.53e-03 | 127 |
| GO:190198712 | Oral cavity | LP | regulation of cell cycle phase transition | 126/4623 | 390/18723 | 3.69e-04 | 3.64e-03 | 126 |
| GO:000257315 | Oral cavity | LP | myeloid leukocyte differentiation | 71/4623 | 208/18723 | 1.35e-03 | 1.08e-02 | 71 |
| GO:004277013 | Oral cavity | LP | signal transduction in response to DNA damage | 60/4623 | 172/18723 | 1.71e-03 | 1.31e-02 | 60 |
| Page: 1 2 3 4 5 6 7 8 |
| Pathway ID | Tissue | Disease Stage | Description | Gene Ratio | Bg Ratio | pvalue | p.adjust | qvalue | Count |
| hsa0301321 | Esophagus | ESCC | Nucleocytoplasmic transport | 89/4205 | 108/8465 | 1.20e-12 | 2.37e-11 | 1.21e-11 | 89 |
| hsa0301331 | Esophagus | ESCC | Nucleocytoplasmic transport | 89/4205 | 108/8465 | 1.20e-12 | 2.37e-11 | 1.21e-11 | 89 |
| hsa03013 | Liver | HCC | Nucleocytoplasmic transport | 81/4020 | 108/8465 | 4.28e-09 | 6.83e-08 | 3.80e-08 | 81 |
| hsa030131 | Liver | HCC | Nucleocytoplasmic transport | 81/4020 | 108/8465 | 4.28e-09 | 6.83e-08 | 3.80e-08 | 81 |
| hsa030136 | Oral cavity | OSCC | Nucleocytoplasmic transport | 82/3704 | 108/8465 | 7.93e-12 | 1.33e-10 | 6.77e-11 | 82 |
| hsa0301311 | Oral cavity | OSCC | Nucleocytoplasmic transport | 82/3704 | 108/8465 | 7.93e-12 | 1.33e-10 | 6.77e-11 | 82 |
| hsa030132 | Oral cavity | LP | Nucleocytoplasmic transport | 53/2418 | 108/8465 | 4.68e-06 | 4.10e-05 | 2.64e-05 | 53 |
| hsa030133 | Oral cavity | LP | Nucleocytoplasmic transport | 53/2418 | 108/8465 | 4.68e-06 | 4.10e-05 | 2.64e-05 | 53 |
| Page: 1 |
Top |
Cell-cell communication analysis |
| Identification of potential cell-cell interactions between two cell types and their ligand-receptor pairs for different disease states |
| Ligand | Receptor | LRpair | Pathway | Tissue | Disease Stage |
| Page: 1 |
Top |
Single-cell gene regulatory network inference analysis |
| Find out the significant the regulons (TFs) and the target genes of each regulon across cell types for different disease states |
| TF | Cell Type | Tissue | Disease Stage | Target Gene | RSS | Regulon Activity |
| ∗The dot plots of a searched regulon are shown for all cell subpopulations in each disease state of each tissue based on the regulon specific score inferred using pySCENIC and by calculating the average expression. |
| Page: 1 |
Top |
Somatic mutation of malignant transformation related genes |
| Annotation of somatic variants for genes involved in malignant transformation |
| Hugo Symbol | Variant Class | Variant Classification | dbSNP RS | HGVSc | HGVSp | HGVSp Short | SWISSPROT | BIOTYPE | SIFT | PolyPhen | Tumor Sample Barcode | Tissue | Histology | Sex | Age | Stage | Therapy Types | Drugs | Outcome |
| THOC5 | SNV | Missense_Mutation | c.25N>G | p.Arg9Gly | p.R9G | Q13769 | protein_coding | deleterious(0) | probably_damaging(0.924) | TCGA-BH-A0C0-01 | Breast | breast invasive carcinoma | Female | <65 | I/II | Chemotherapy | carboplatin | SD | |
| THOC5 | SNV | Missense_Mutation | c.639G>C | p.Glu213Asp | p.E213D | Q13769 | protein_coding | tolerated(0.12) | benign(0.177) | TCGA-C8-A26Y-01 | Breast | breast invasive carcinoma | Female | >=65 | I/II | Unknown | Unknown | SD | |
| THOC5 | insertion | Frame_Shift_Ins | novel | c.727_728insA | p.Val243AspfsTer17 | p.V243Dfs*17 | Q13769 | protein_coding | TCGA-A2-A0CP-01 | Breast | breast invasive carcinoma | Female | <65 | I/II | Chemotherapy | cytoxan | SD | ||
| THOC5 | insertion | In_Frame_Ins | novel | c.725_726insTGTGGCTGCAGATGACGAGAGTGACTCAGATGCCGAGGA | p.Val243_Gln244insAlaAlaAspAspGluSerAspSerAspAlaGluGluVal | p.V243_Q244insAADDESDSDAEEV | Q13769 | protein_coding | TCGA-A2-A0CP-01 | Breast | breast invasive carcinoma | Female | <65 | I/II | Chemotherapy | cytoxan | SD | ||
| THOC5 | insertion | Frame_Shift_Ins | novel | c.206_207insGG | p.Ile69MetfsTer5 | p.I69Mfs*5 | Q13769 | protein_coding | TCGA-AN-A03X-01 | Breast | breast invasive carcinoma | Female | >=65 | I/II | Unknown | Unknown | SD | ||
| THOC5 | insertion | Frame_Shift_Ins | novel | c.205_206insCATTTGTAAATTTGATAAGAATCCCTTCTGAGTCTTTAATTCA | p.Ile69ThrfsTer48 | p.I69Tfs*48 | Q13769 | protein_coding | TCGA-AN-A03X-01 | Breast | breast invasive carcinoma | Female | >=65 | I/II | Unknown | Unknown | SD | ||
| THOC5 | SNV | Missense_Mutation | novel | c.1003N>A | p.Asp335Asn | p.D335N | Q13769 | protein_coding | tolerated(0.08) | possibly_damaging(0.878) | TCGA-DS-A1OB-01 | Cervix | cervical & endocervical cancer | Female | <65 | I/II | Chemotherapy | carboplatin | PD |
| THOC5 | SNV | Missense_Mutation | c.352G>A | p.Glu118Lys | p.E118K | Q13769 | protein_coding | tolerated(0.07) | probably_damaging(0.98) | TCGA-EA-A3HR-01 | Cervix | cervical & endocervical cancer | Female | <65 | I/II | Unknown | Unknown | SD | |
| THOC5 | SNV | Missense_Mutation | novel | c.1294N>A | p.Asp432Asn | p.D432N | Q13769 | protein_coding | tolerated(0.07) | possibly_damaging(0.617) | TCGA-A6-3807-01 | Colorectum | colon adenocarcinoma | Female | <65 | III/IV | Ancillary | leucovorin | SD |
| THOC5 | SNV | Missense_Mutation | c.1957N>T | p.Pro653Ser | p.P653S | Q13769 | protein_coding | tolerated(0.05) | benign(0.386) | TCGA-AA-3492-01 | Colorectum | colon adenocarcinoma | Female | >=65 | I/II | Unknown | Unknown | SD |
| Page: 1 2 3 4 5 6 7 |
Top |
Related drugs of malignant transformation related genes |
| Identification of chemicals and drugs interact with genes involved in malignant transfromation |
| (DGIdb 4.0) |
| Entrez ID | Symbol | Category | Interaction Types | Drug Claim Name | Drug Name | PMIDs |
| Page: 1 |

Copyright 2023-Present -The University of Texas Health Science Center at Houston |